1686
Increasing Mixing Time in STEAM-DTI Enhances Inter-Muscle Heterogeneity Patterns in the Lower Leg of Healthy Subjects1Radiology, Leiden University Medical Center, C.J. Gorter Center for High-field MRI, Leiden, Netherlands, 2Neurology, Leiden University Medical Center, Leiden, Netherlands
Synopsis
Hereditary muscular disorders are characterized by progressive skeletal muscle wasting and weakness. Although these diseases are caused by ubiquitous genetic mutations, the symptoms appear at different rates in different muscles. We investigated the differences in microstructural properties of different muscles of the lower leg in healthy subject using STEAM-DTI with varying diffusion times at 3T. We identified a characteristic pattern of differences in fractional anisotropy and diffusivity in healthy muscles than can serve as a knowledge base for future studies on disease progression in muscular disorders.
INTRODUCTION
Hereditary muscular disorders (MDs) are a group of genetic diseases characterized by progressive skeletal muscle wasting and weakness. Although these genetic mutations are ubiquitous, many MDs have a characteristic pattern of involvement, with muscle weakness and fatty infiltration appearing at different times and in different muscles during the disease process.1 These differences between muscles are not well understood and several factors could have an influence, such as fiber type and size,2,3 and daily life activity.4 Evaluating MR properties across different muscles in healthy subjects may help to identify the factors that make some muscles more susceptible to wasting than others in specific MDs. MDs have been extensively studied using fat quantification by MRI,5 but this does not provide information on structural properties of the remaining muscle. In this work, we used stimulated echo diffusion tensor imaging (STEAM-DTI) at 3T with varying diffusion times to map the structural properties of different muscles of the lower leg at rest in healthy subjects.METHODS
Seven healthy subjects (23 to 65 year-old) were scanned on a 3T Ingenia MR system (Philips Healthcare, Best, the Netherlands) with two 16 and 12-element receive coils. Water/fat images were obtained using a 3-point Dixon sequence (23 slices; TR/TE/ΔTE:210/4.41/0.76 ms; signal averages:2 ; FA:8°; resolution: 1x1x10mm3) and scanner-based reconstruction. Diffusion properties were measured using 6-point Dixon STEAM-DTI6 with two mixing times (TM = 100ms and 300ms, voxel size 4x4x6 mm3, TE/TR = 50/5000ms, b=400s/mm2). Data were processed with an in-house processing pipeline with full-spectrum fat suppression.6 Fractional anisotropy (FA), eigenvalues (λ1, λT= (λ2+λ3)/2) and mean diffusivity (MD) were computed in the Camino Diffusion MRI Toolkit7 and extracted from regions of interest (ROIs) drawn in six muscles – soleus (SOL), medial gastrocnemius (GM), lateral gastrocnemius (GL), peroneus (PER), extensor digitorum longus (EDL), and tibialis anterior (TA) (Figure 1). Results are reported as the mean of all pixels within an ROI. Statistical analyses were done using one-way repeated measures ANOVA and Tukey correction for multiple comparisons for muscle comparisons at each TM, and two-way repeated measures ANOVA with Sidak correction for multiple comparisons for TM effect. P-values are provided in figure legends.RESULTS
FA and MD both revealed a characteristic pattern and significant differences between muscles in all subjects over a wide age range as shown by repeated measures ANOVA.
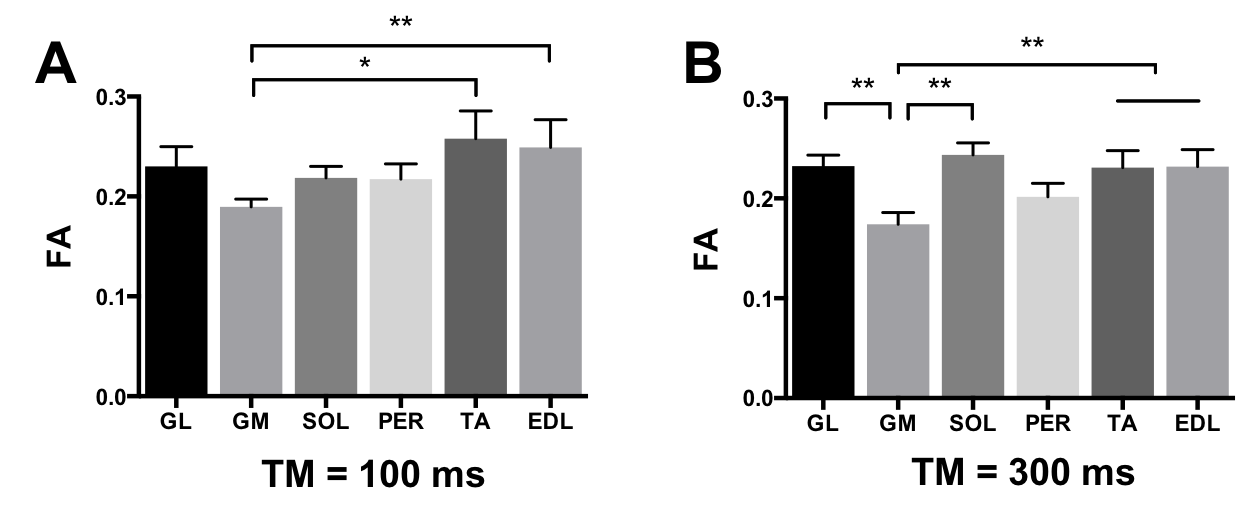
Fractional anisotropy: FA was significantly lower in the GM muscle than in the TA and EDL with TM=100ms (Figure 2A). The differences between muscles were larger when using TM=300ms, where FA was significantly lower in the GM muscle than in TA, EDL, GL, and SOL (p<0.01; Figure 2B).
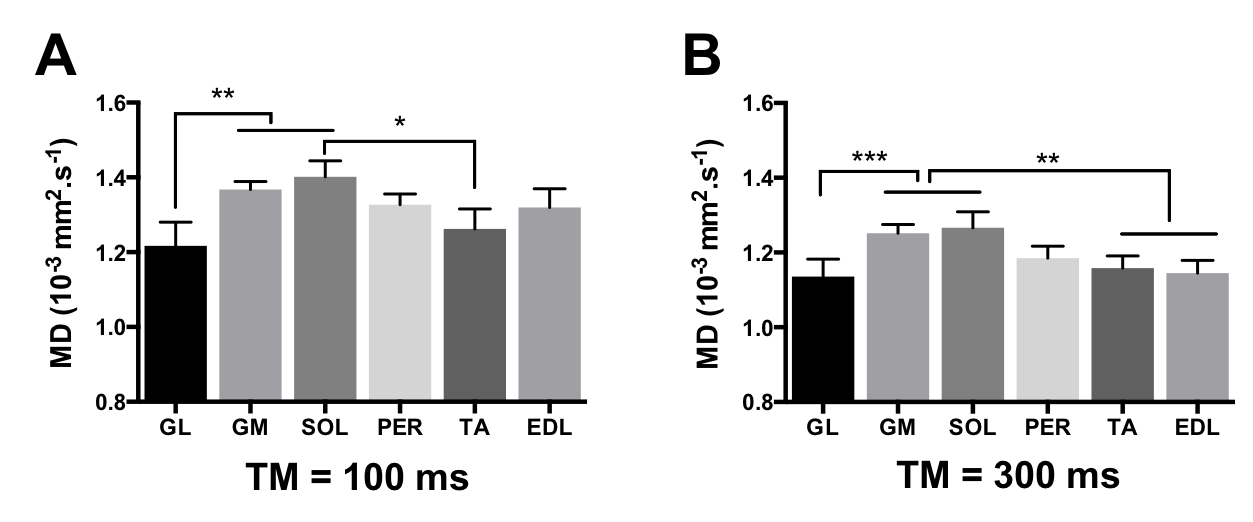
Mean diffusivity: MD showed significant differences between muscles (Figure 3). Similar to FA, the differences in MD were stronger at TM=300ms, and we found that the MD values in two of the plantar flexor muscles (GM and SOL) were significantly higher than in the extensors (TA and EDL) (figure 3B), but also significantly higher than in the GL. The analysis of the individual eigenvalues further showed that these differences reflected either λ1 or λT depending on the muscle. For example, the high MD in the GM was dominated by an effect of λT, whereas λ1 was higher in the SOL.
Effect of diffusion time: Increasing TM resulted in a significant decrease in the measured MD values in all muscles (p<0.001), which was consistent with the previous finding by Noeren et al,8 but there was no significant TM effect on the FA values in our data.
CONCLUSION AND DISCUSSION
Our results showed significant differences in diffusion values between muscles within the lower leg of healthy subjects. We found that increasing the diffusion time from 100 ms to 300 ms enhanced these differences, suggesting that the longer TM achievable with STEAM-DTI may be better suited for evaluation of large muscle cells than standard SE techniques limited to shorter TMs.
FA and MD both revealed a characteristic pattern of differences between muscles. Notably, these patterns were very consistent across subjects over a wide age range. This is of particular importance in disorders like Becker Muscular Dystrophy, which slowly progresses from teenage to elderly and shows a large variability in the age of symptoms onset. Differences in FA or MD cannot be solely explained by fiber type or function, as muscles with similar fiber types (GM and GL) or similar function (SOL, GM, GL) showed different DTI properties. Heterogeneity within the posterior muscle compartment and across subjects has been also reported for metabolic activity after simple walking.9
Overall, our data provide an important knowledge base for future studies on disease progression in MDs.
Acknowledgements
This project was funded by the European Union’s Seventh Framework Programme for research, technological development and demonstration under grant agreement #602485.References
[1] Díaz-Manera J, Llauger J, Gallardo E, Illa I. Muscle MRI in muscular dystrophies. Acta Myologica. 2015;34(2-3):95-108.
[2] Webster C, Silberstein L, Hays AP, Blau HM. Fast muscle fibers are preferentially affected in Duchenne muscular dystrophy. Cell 1988 Feb;52(4):503-13.
[3] Pedemonte M, Sandri C, Schiaffino S, Minetti C. Early decrease of IIx myosin heavy chain transcripts in Duchenne muscular dystrophy. Biochem Biophys Res Commun 1999 Feb 16;255(2):466-9.
[4] Hu, X. and Blemker, S. S. (2015), Musculoskeletal simulation can help explain selective muscle degeneration in Duchenne muscular dystrophy. Muscle Nerve, 52: 174–182.
[5] Burakiewicz J, Sinclair CDJ, Fischer D, Walter GA, Kan HE, Hollingsworth KG. Quantifying fat replacement of muscle by quantitative MRI in muscular dystrophy. Journal of Neurology. 2017;264(10):2053-2067.
[6] Burakiewicz, J., Hooijmans, M. T., Webb, A. G., Verschuuren, J. J.G.M., Niks, E. H. and Kan, H. E. (2017), Improved olefinic fat suppression in skeletal muscle DTI using a magnitude-based dixon method. Magn. Reson. Med.
[7] Cook PA, Bai Y, Nedjati-Gilani S, Seunarine KK, Hall MG, Parker GJ, Alexander DC. Camino: open-source diffusion-MRI reconstruction and processing. In Proceedings of the 14th Annual Meeting of ISMRM; Seattle, Washington, USA, 2006.
[8] Noehren B, Andersen A, Feiweier T, Damon B, Hardy P. Comparison of Twice Refocused Spin Echo versus Stimulated Echo Diffusion Tensor Imaging for Tracking Muscle Fibers. Journal of magnetic resonance imaging : JMRI. 2015;41(3):624-632.
[9] Kolk S, Klawer EME, Schepers JAN, Weerdesteyn V, Visser EP, Verdonschot N. Muscle Activity during Walking Measured Using 3D MRI Segmentations and [18F]-Fluorodeoxyglucose in Combination with Positron Emission Tomography. Medicine & Science in Sports & Exercise. 2015;47(9).
Figures
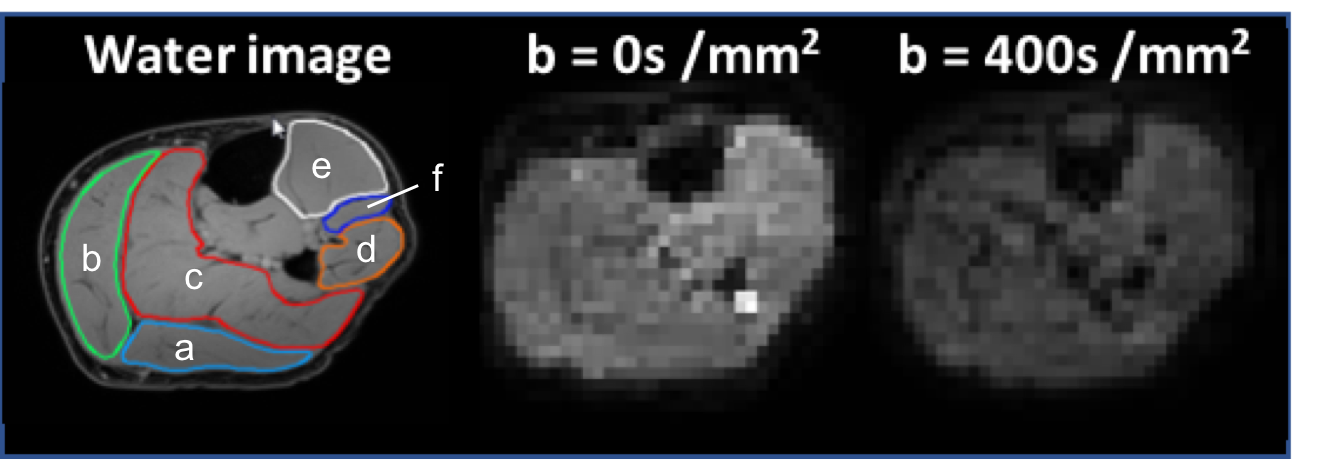
Figure 1: Example of water image with ROIs drawn on (a) GL, (b) GM, (c) SOL, (d) PER, (e) TA, (f) EDL, and STEAM-DTI images at b= 0 s/mm2 and 400 s/mm2 for acquisitions at TM=100ms