1684
Investigation of diffusion, susceptibility, and vessel morphology effects on R2 in characterizing normal and tumorous vasculature using simulations1UAE University, Al-Ain, Abu Dhabi, United Arab Emirates, 2Radiology, MGH & Harvard Medical School, Boston, MA, United States
Synopsis
Brain vasculature is conventionally represented as straight cylinders when simulating BOLD contrast effects in fMRI. In reality, the vasculature is more complicated with branching and coiling especially in tumors. We applied a cylinder fork model to reflect the bifurcation, rotations, and size of vessels and performed simulations to study the effect of the rotation angle (ϕ) on R2 at different bifurcation angles, vessel diameters, diffusion rates, and susceptibility values. This model clearly showed an R2 dependence on ϕ, which could potentially be used, in addition to R2*, as a tool to differentiate between normal and tumor vessels.
Introduction
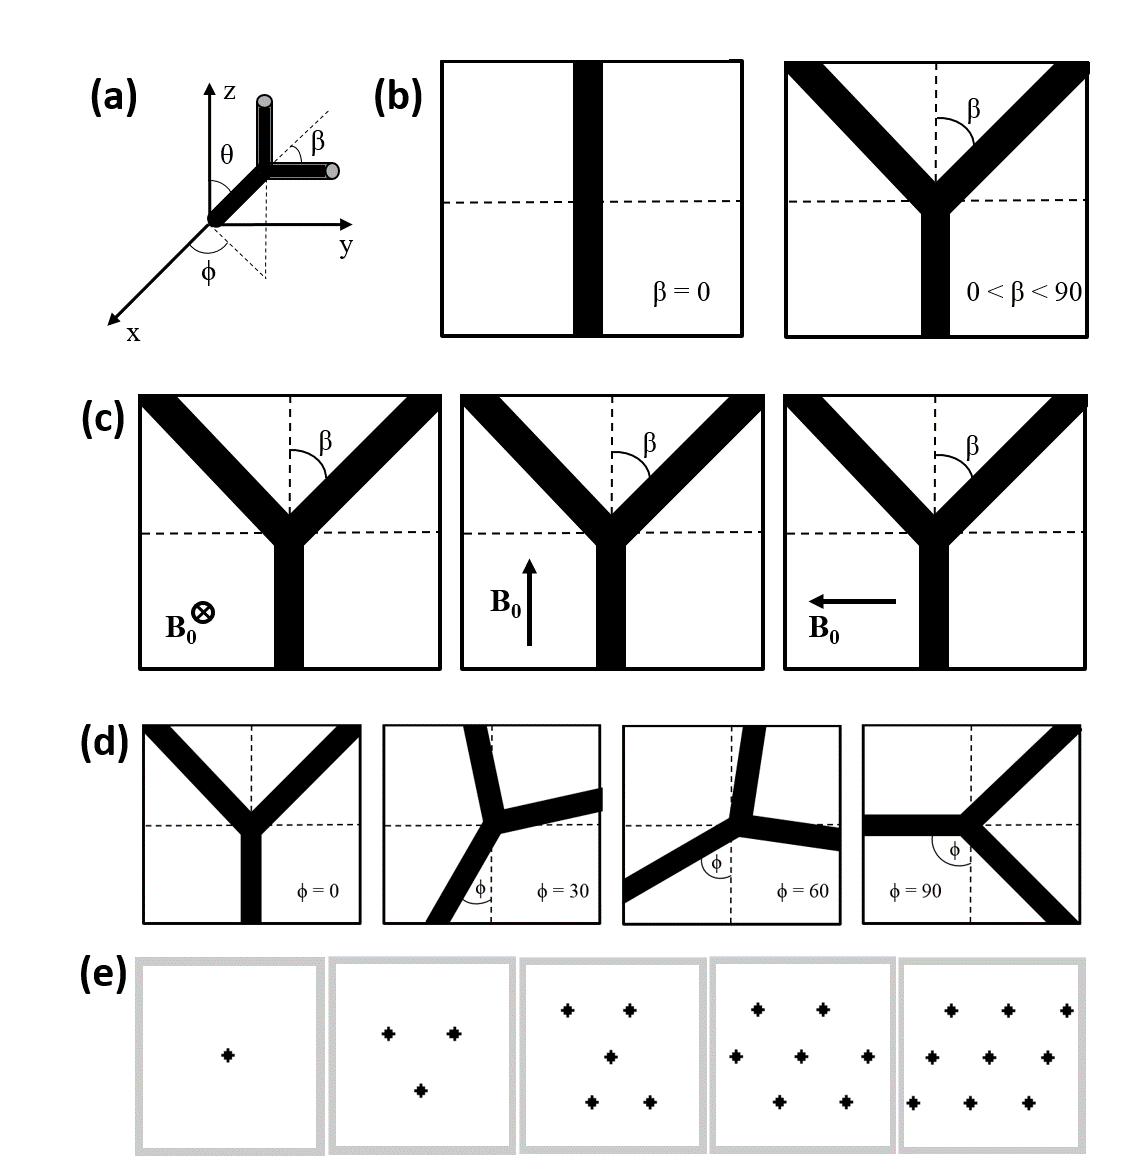
A cylinder fork model (CFM) was proposed to reflect cortical vasculature in the brain to simulate blood oxygenation level dependent (BOLD) contrast effects in functional magnetic resonance imaging (fMRI).1 Instead of infinite cylinders2 representing human cortical vasculature,3,4 the CFM reflects a more realistic model by incorporating bifurcations, rotations, and vessel sizes, which can reflect tortuosity of vessels to help characterize normal and tumorous tissue. Diffusion effects were also investigated using the CFM with respect to the bifurcation angle (β–Fig. 1ab), where a clear dependence was observed between the relaxation times (R2* and R2) and β.5 Another study further improved the CFM by incorporating a rotation angle (ϕ–Fig. 1ad) and explored diffusion effects of R2* vs. ϕ depicting behavior due to magnetic field inhomogeneities.6 However, the extent of effect will also depend upon the correlation time (τD) compared to the Larmor frequency variation at the vessel perturber surface.7 Since the state of water exchange differs between normal and tumor tissue,8 understanding diffusion effects on vessel rotation could further help characterize BOLD contrast effects. In this study, we investigate the effect of diffusion rate on R2 vs. ϕ using the CFM at different β, vessel diameters, diffusion rates, and susceptibility values within a range of physiological parameters.Methods
Monte Carlo methods were used to quantify R2 for cylindrical fork perturbers at different rotation and bifurcation angles (Fig. 1abd). The magnetic field B0 was oriented in three different directions (Fig. 1c). The vasculature was modeled using a CFM composed of a straight trunk of half cube length and the bifurcating segments. The cube of 64 µm sides incorporated cylinder fork segments (Fig. 1e) with varying angles (ϕ=0°, 15°, 30°, 45°, 60°, 75°, 90° and β=0°, 45°) that were arranged close to symmetry without any overlapping vessels. The cylinder trunks were set in a parallel orientation for all the orientations with multiple forks in the same cube. The angle θ (Fig. 1a) between the trunk and the magnetic field was 90° for orientations 1 and 3 with the vessel lying in the xy-plane (Fig. 1c), while θ=0° for orientation 2. This model was converted into a cubic 128×128×128 matrix. Magnetic field perturbations were calculated using a forward 3D Fourier transform of the susceptibility distribution of the CFM.9 The simulations were performed with a random walk of 40,000 protons using the same technique as described before using the following parameters6: true vessel diameters of 2.8, 5.6 and 8.6 µm; diffusion rates (D) values of 1×10⁻⁹, 1×10⁻¹⁰ and 1×10-11 m2/s; susceptibility (χ) values of 3×10⁻⁸, 1×10⁻⁷, and 4×10⁻⁷ in cgs units. R2 was calculated by linear least-square fitting of log signal intensity versus volume fraction. R2 per volume fraction unit was used to remove the dependence on vessel lengths and emphasize the role of ϕ. Two-way analysis of variance (ANOVA) was performed to check for significant effects of ϕ on R2 at different D values.Results and Discussion
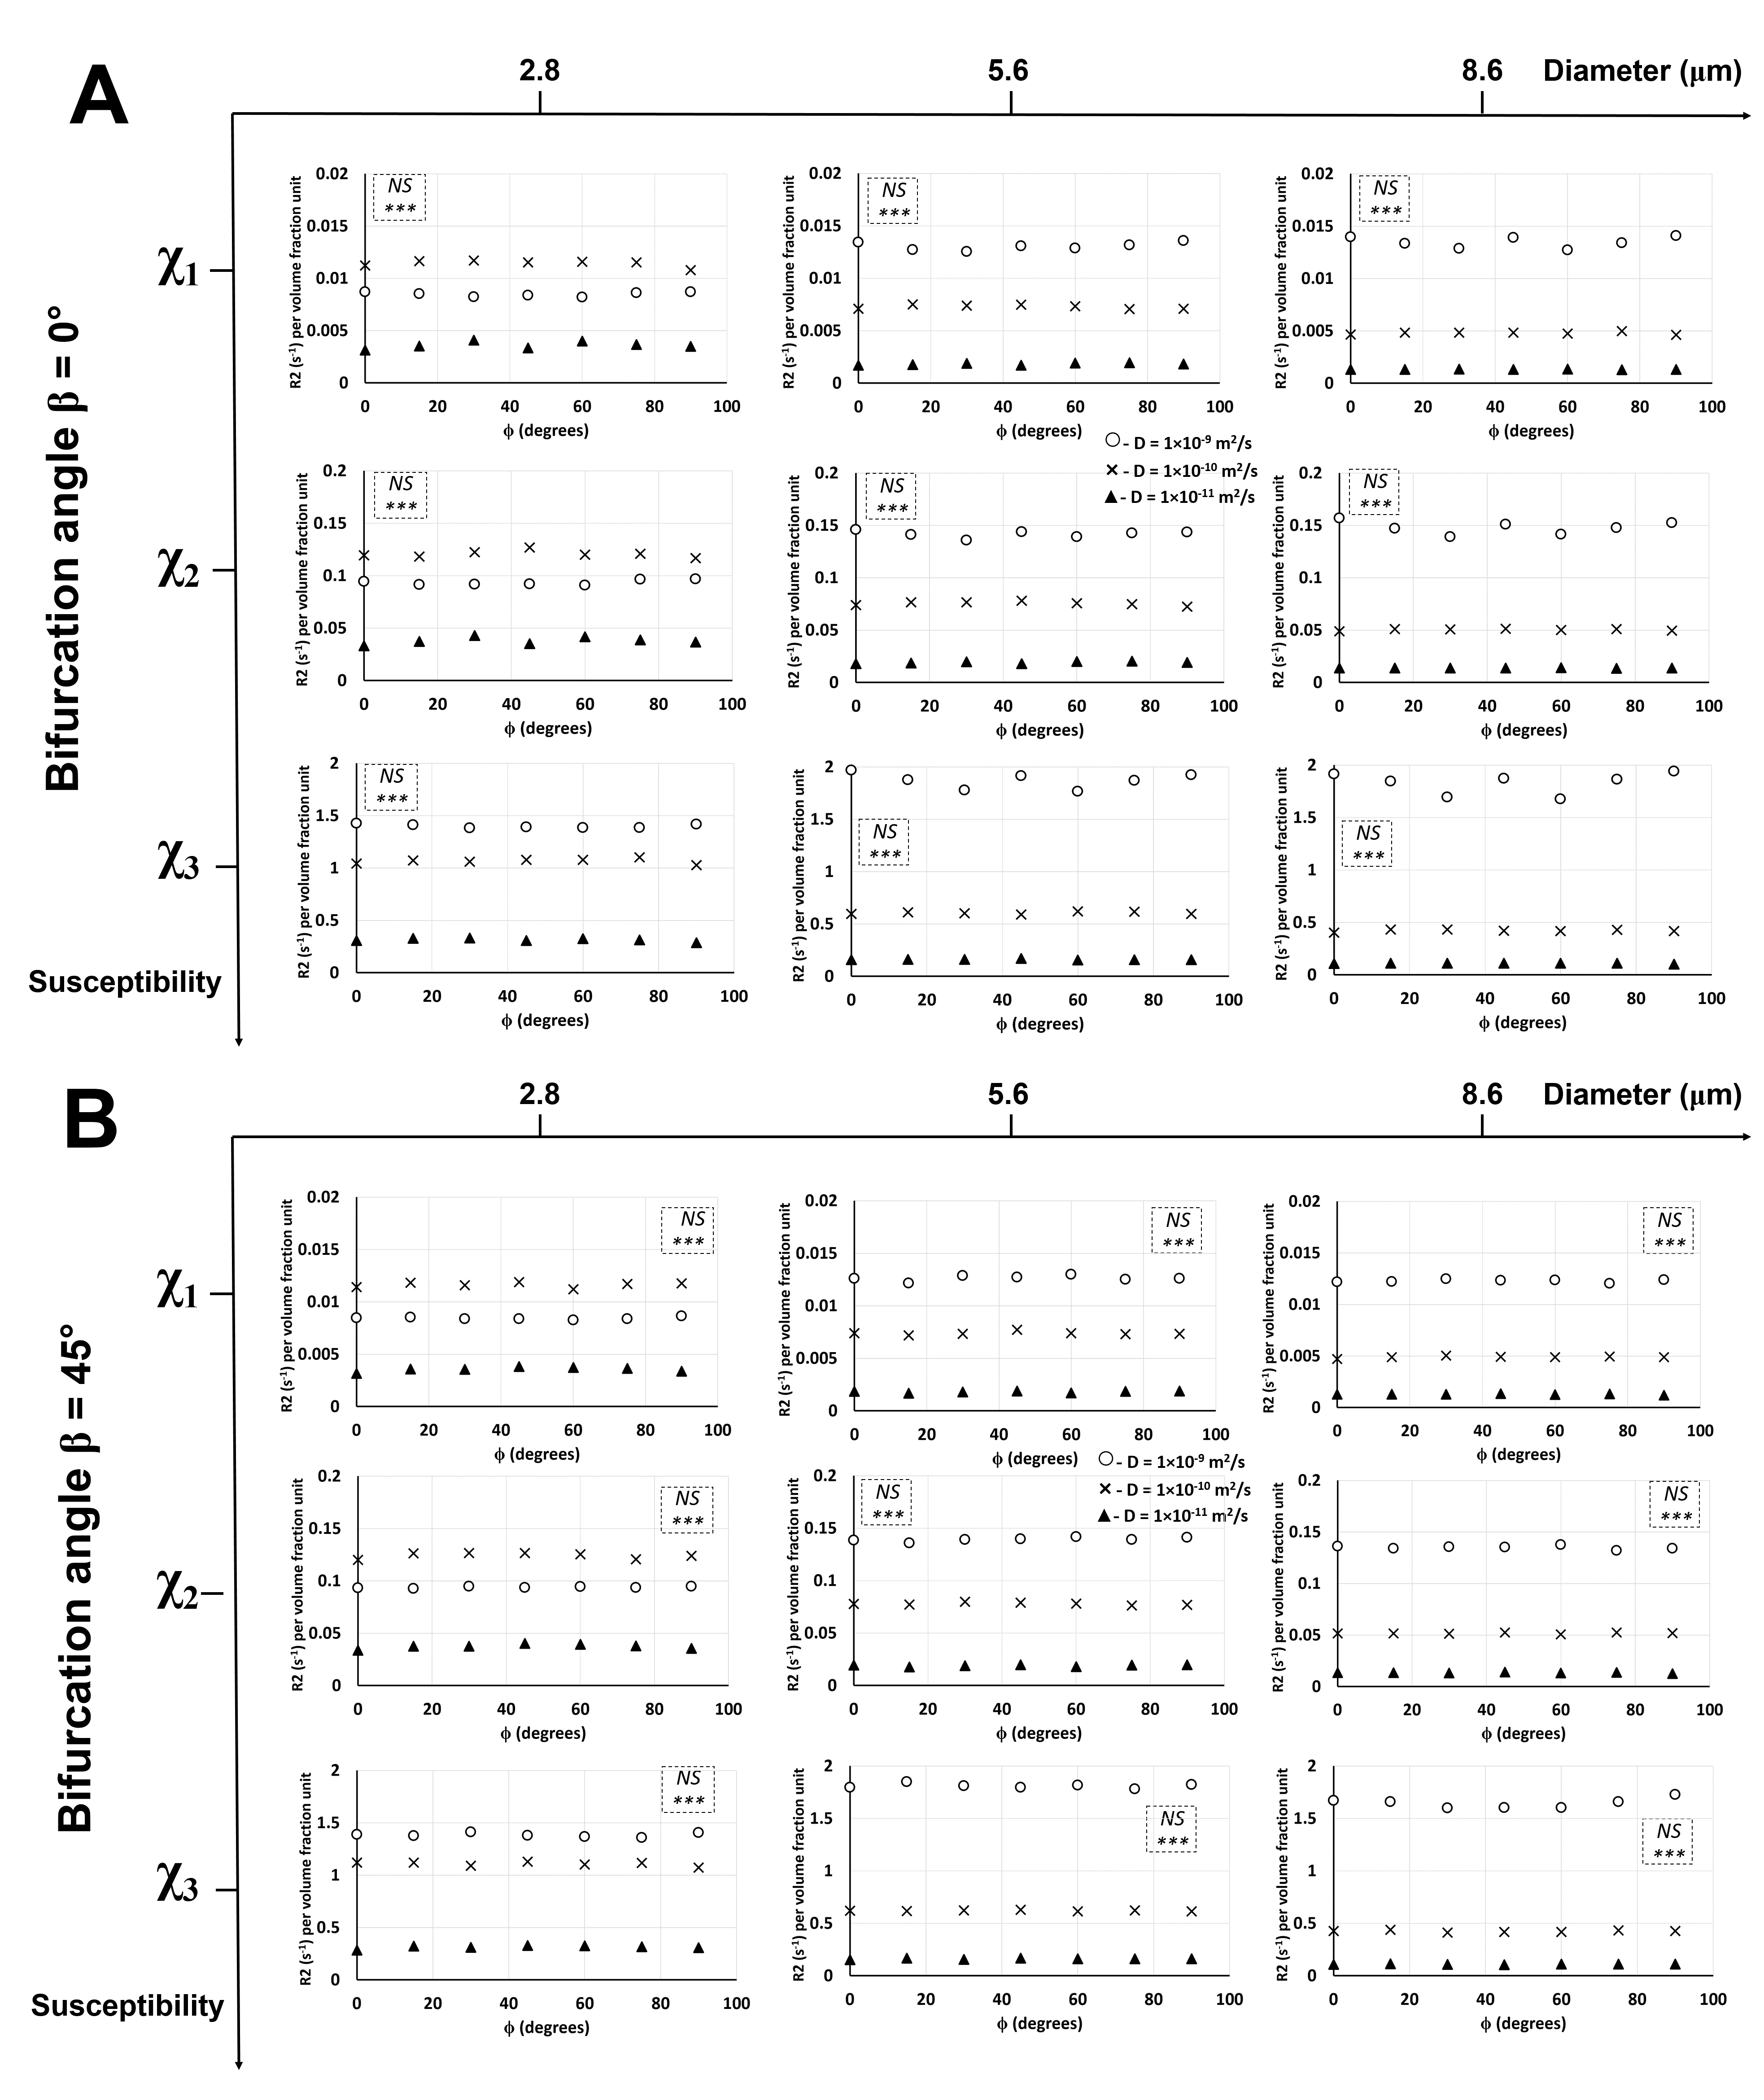
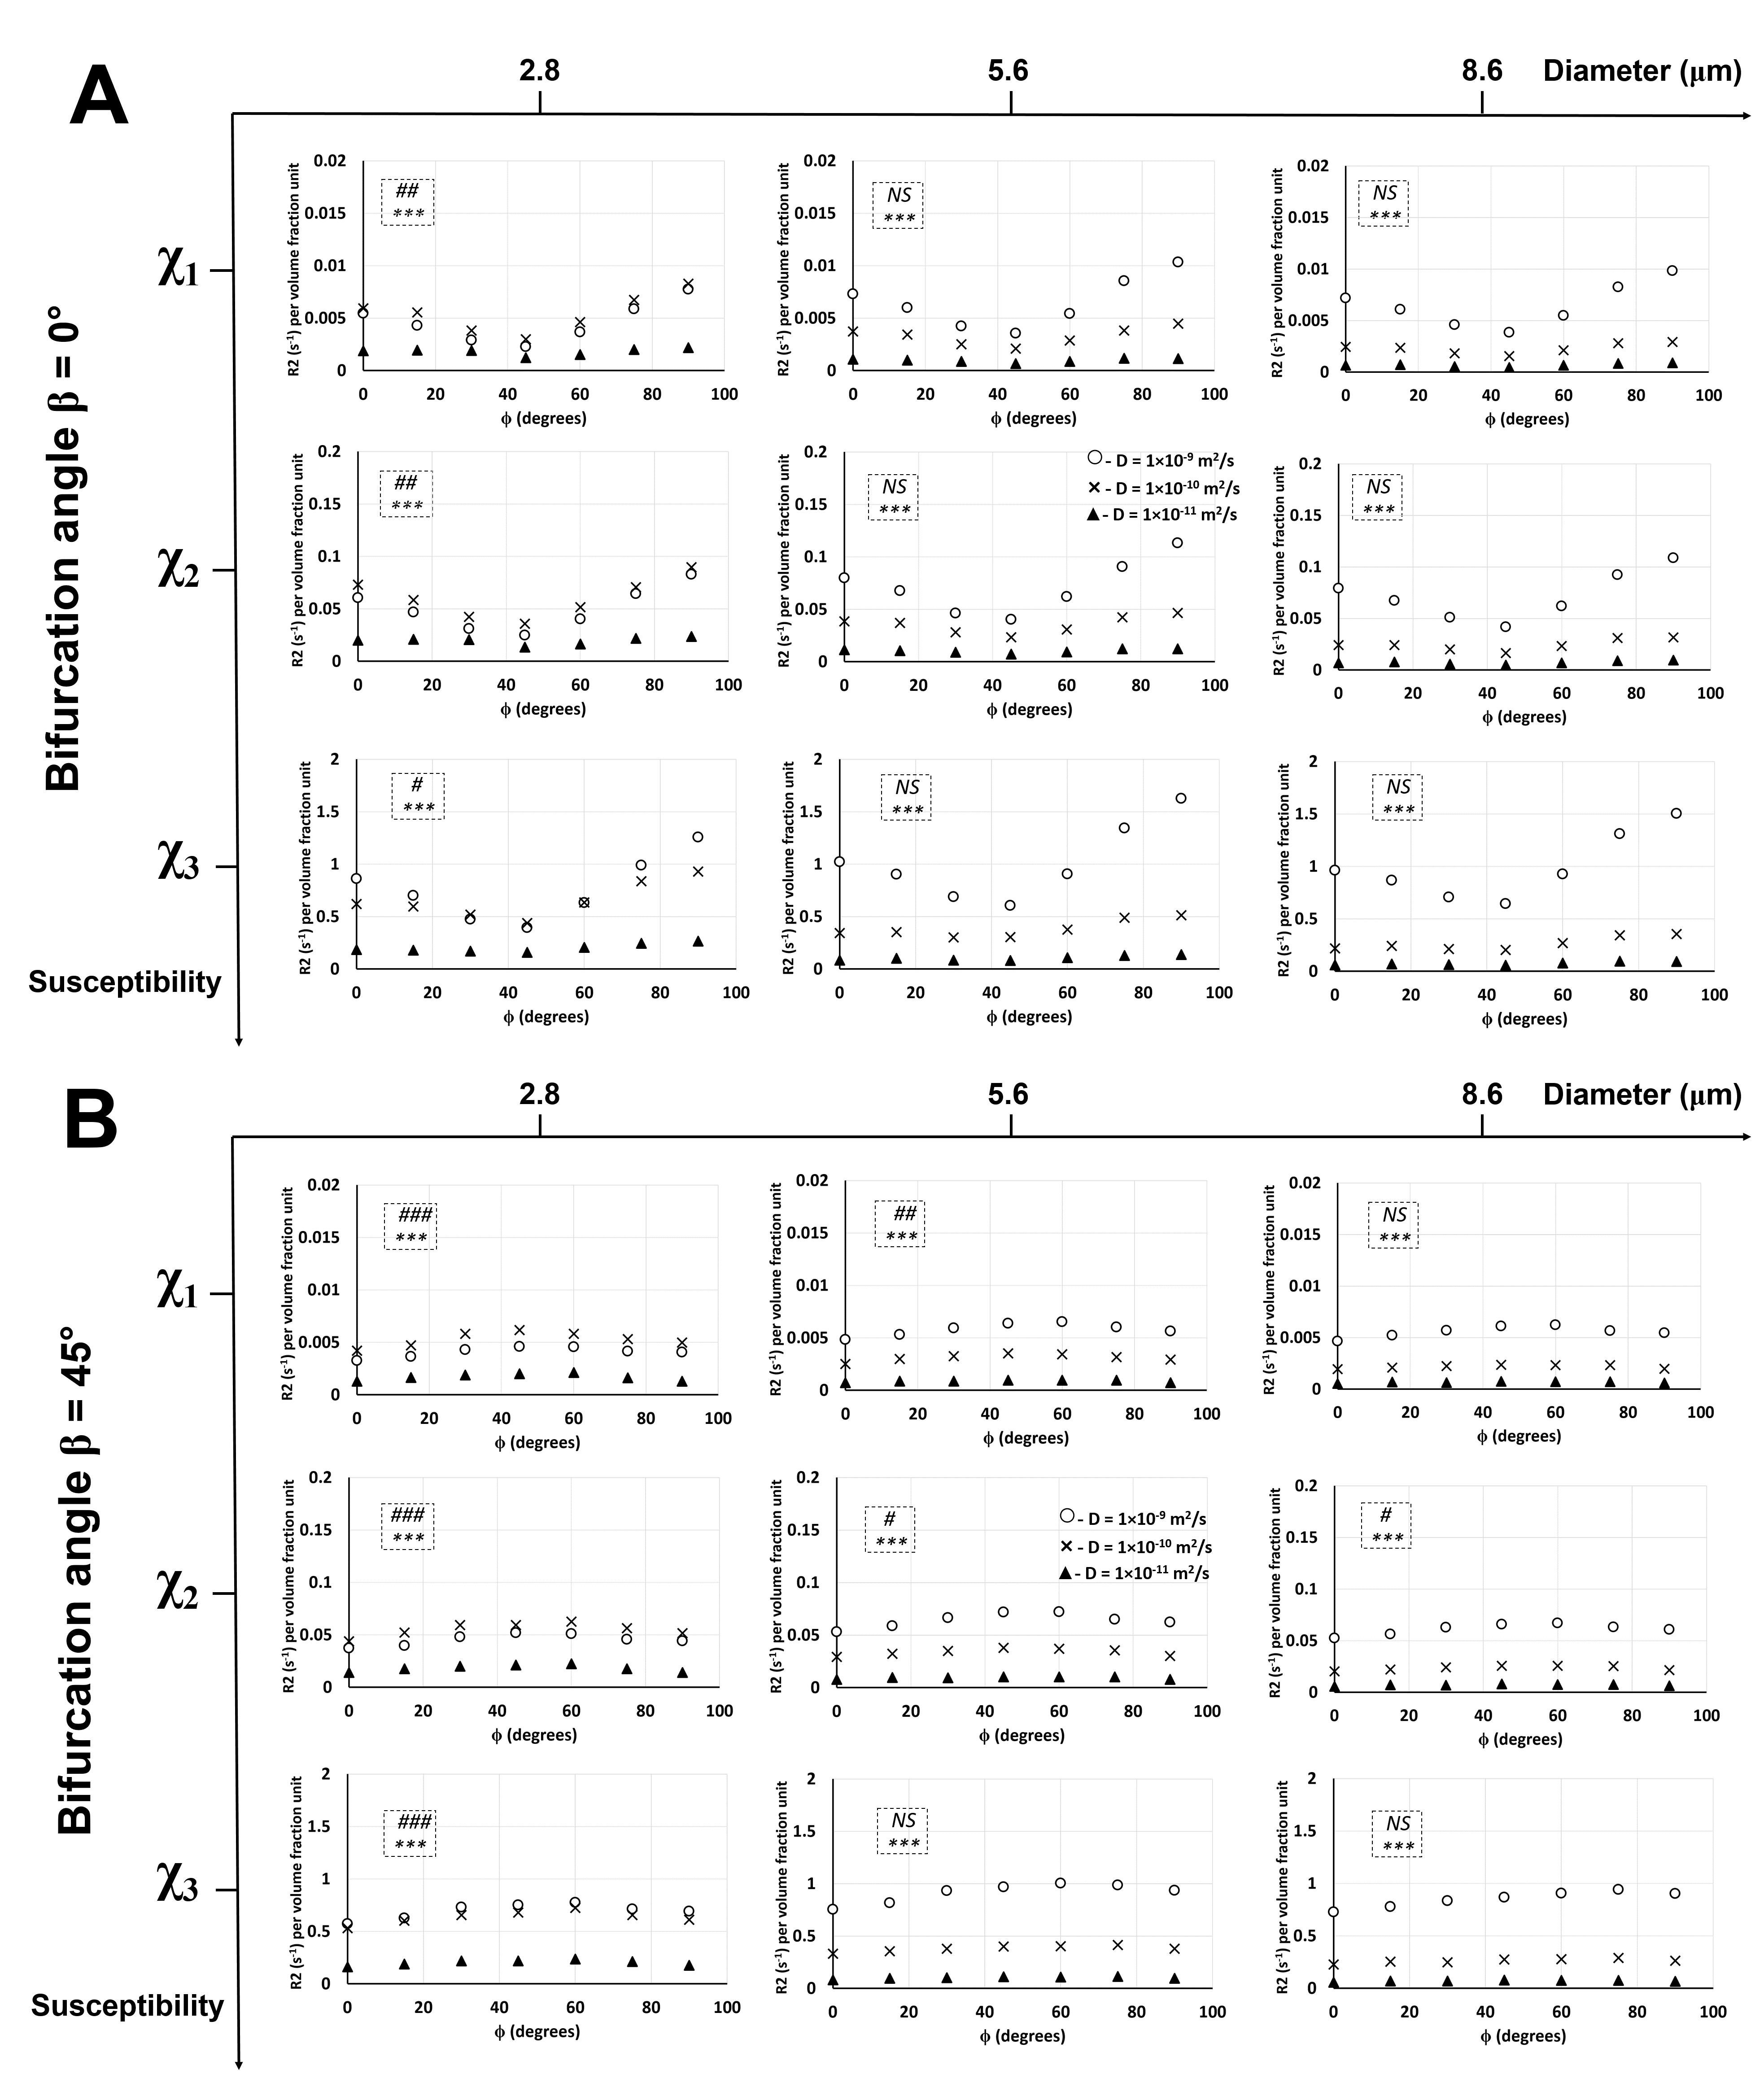
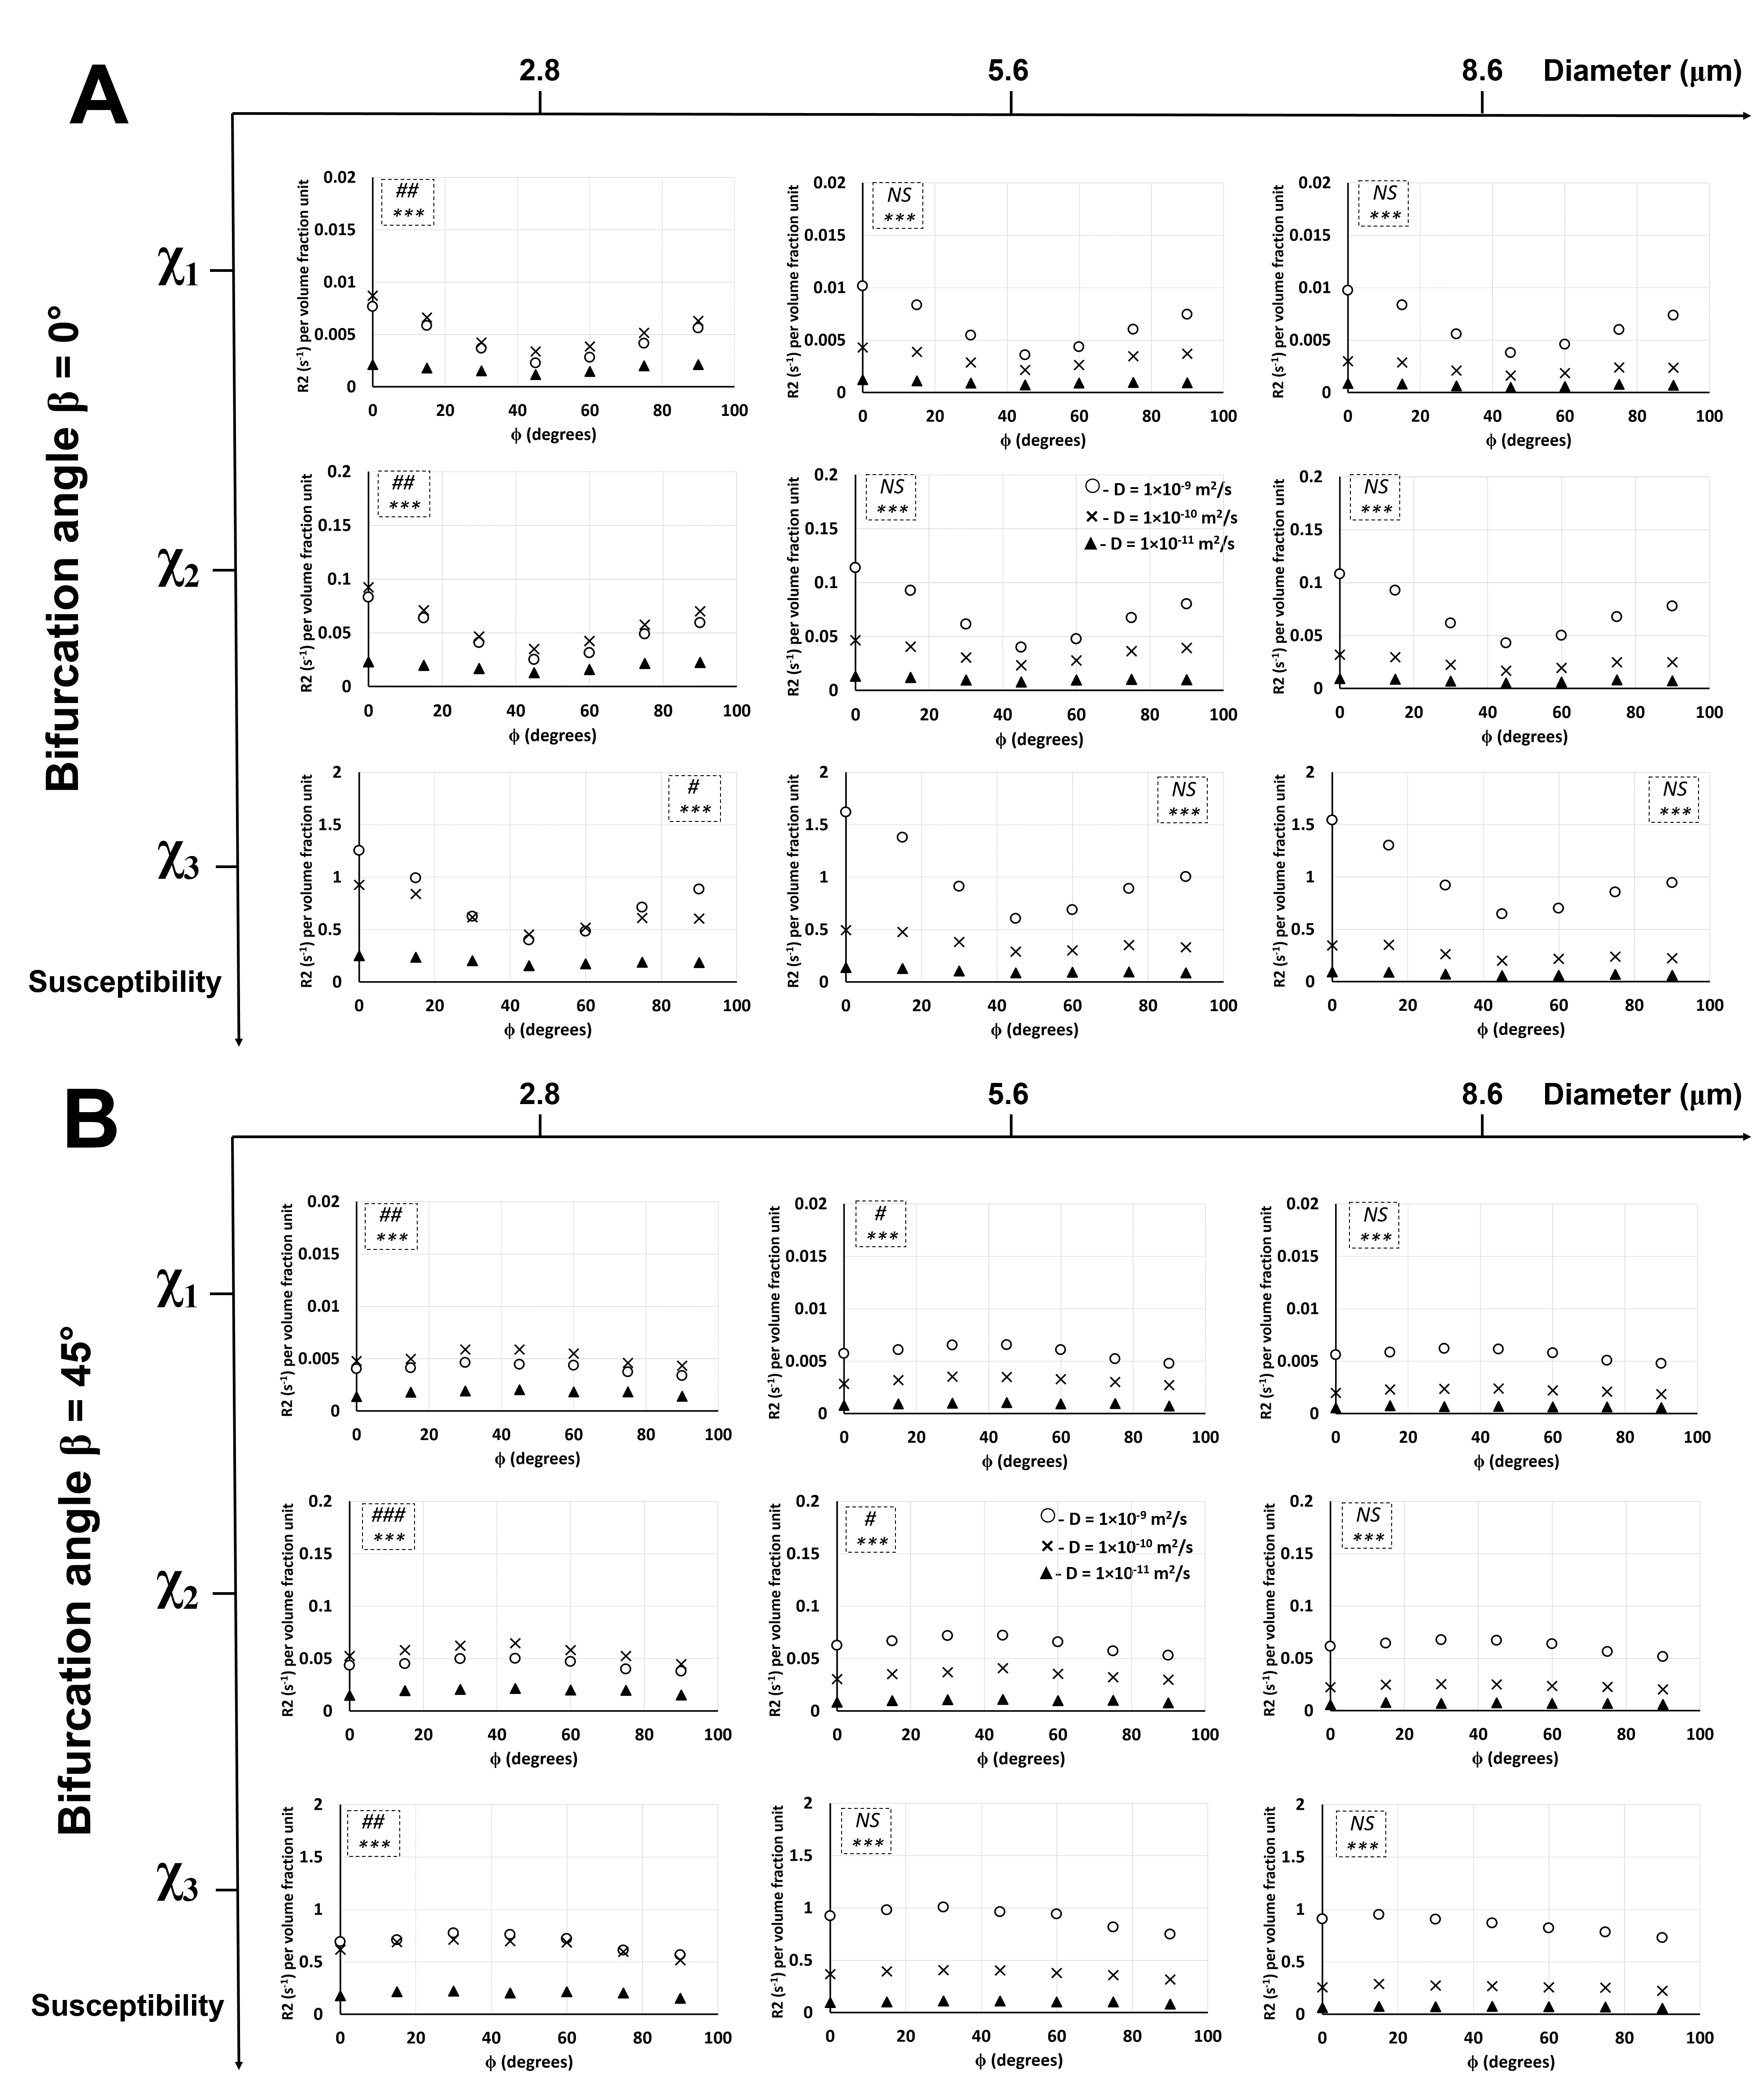
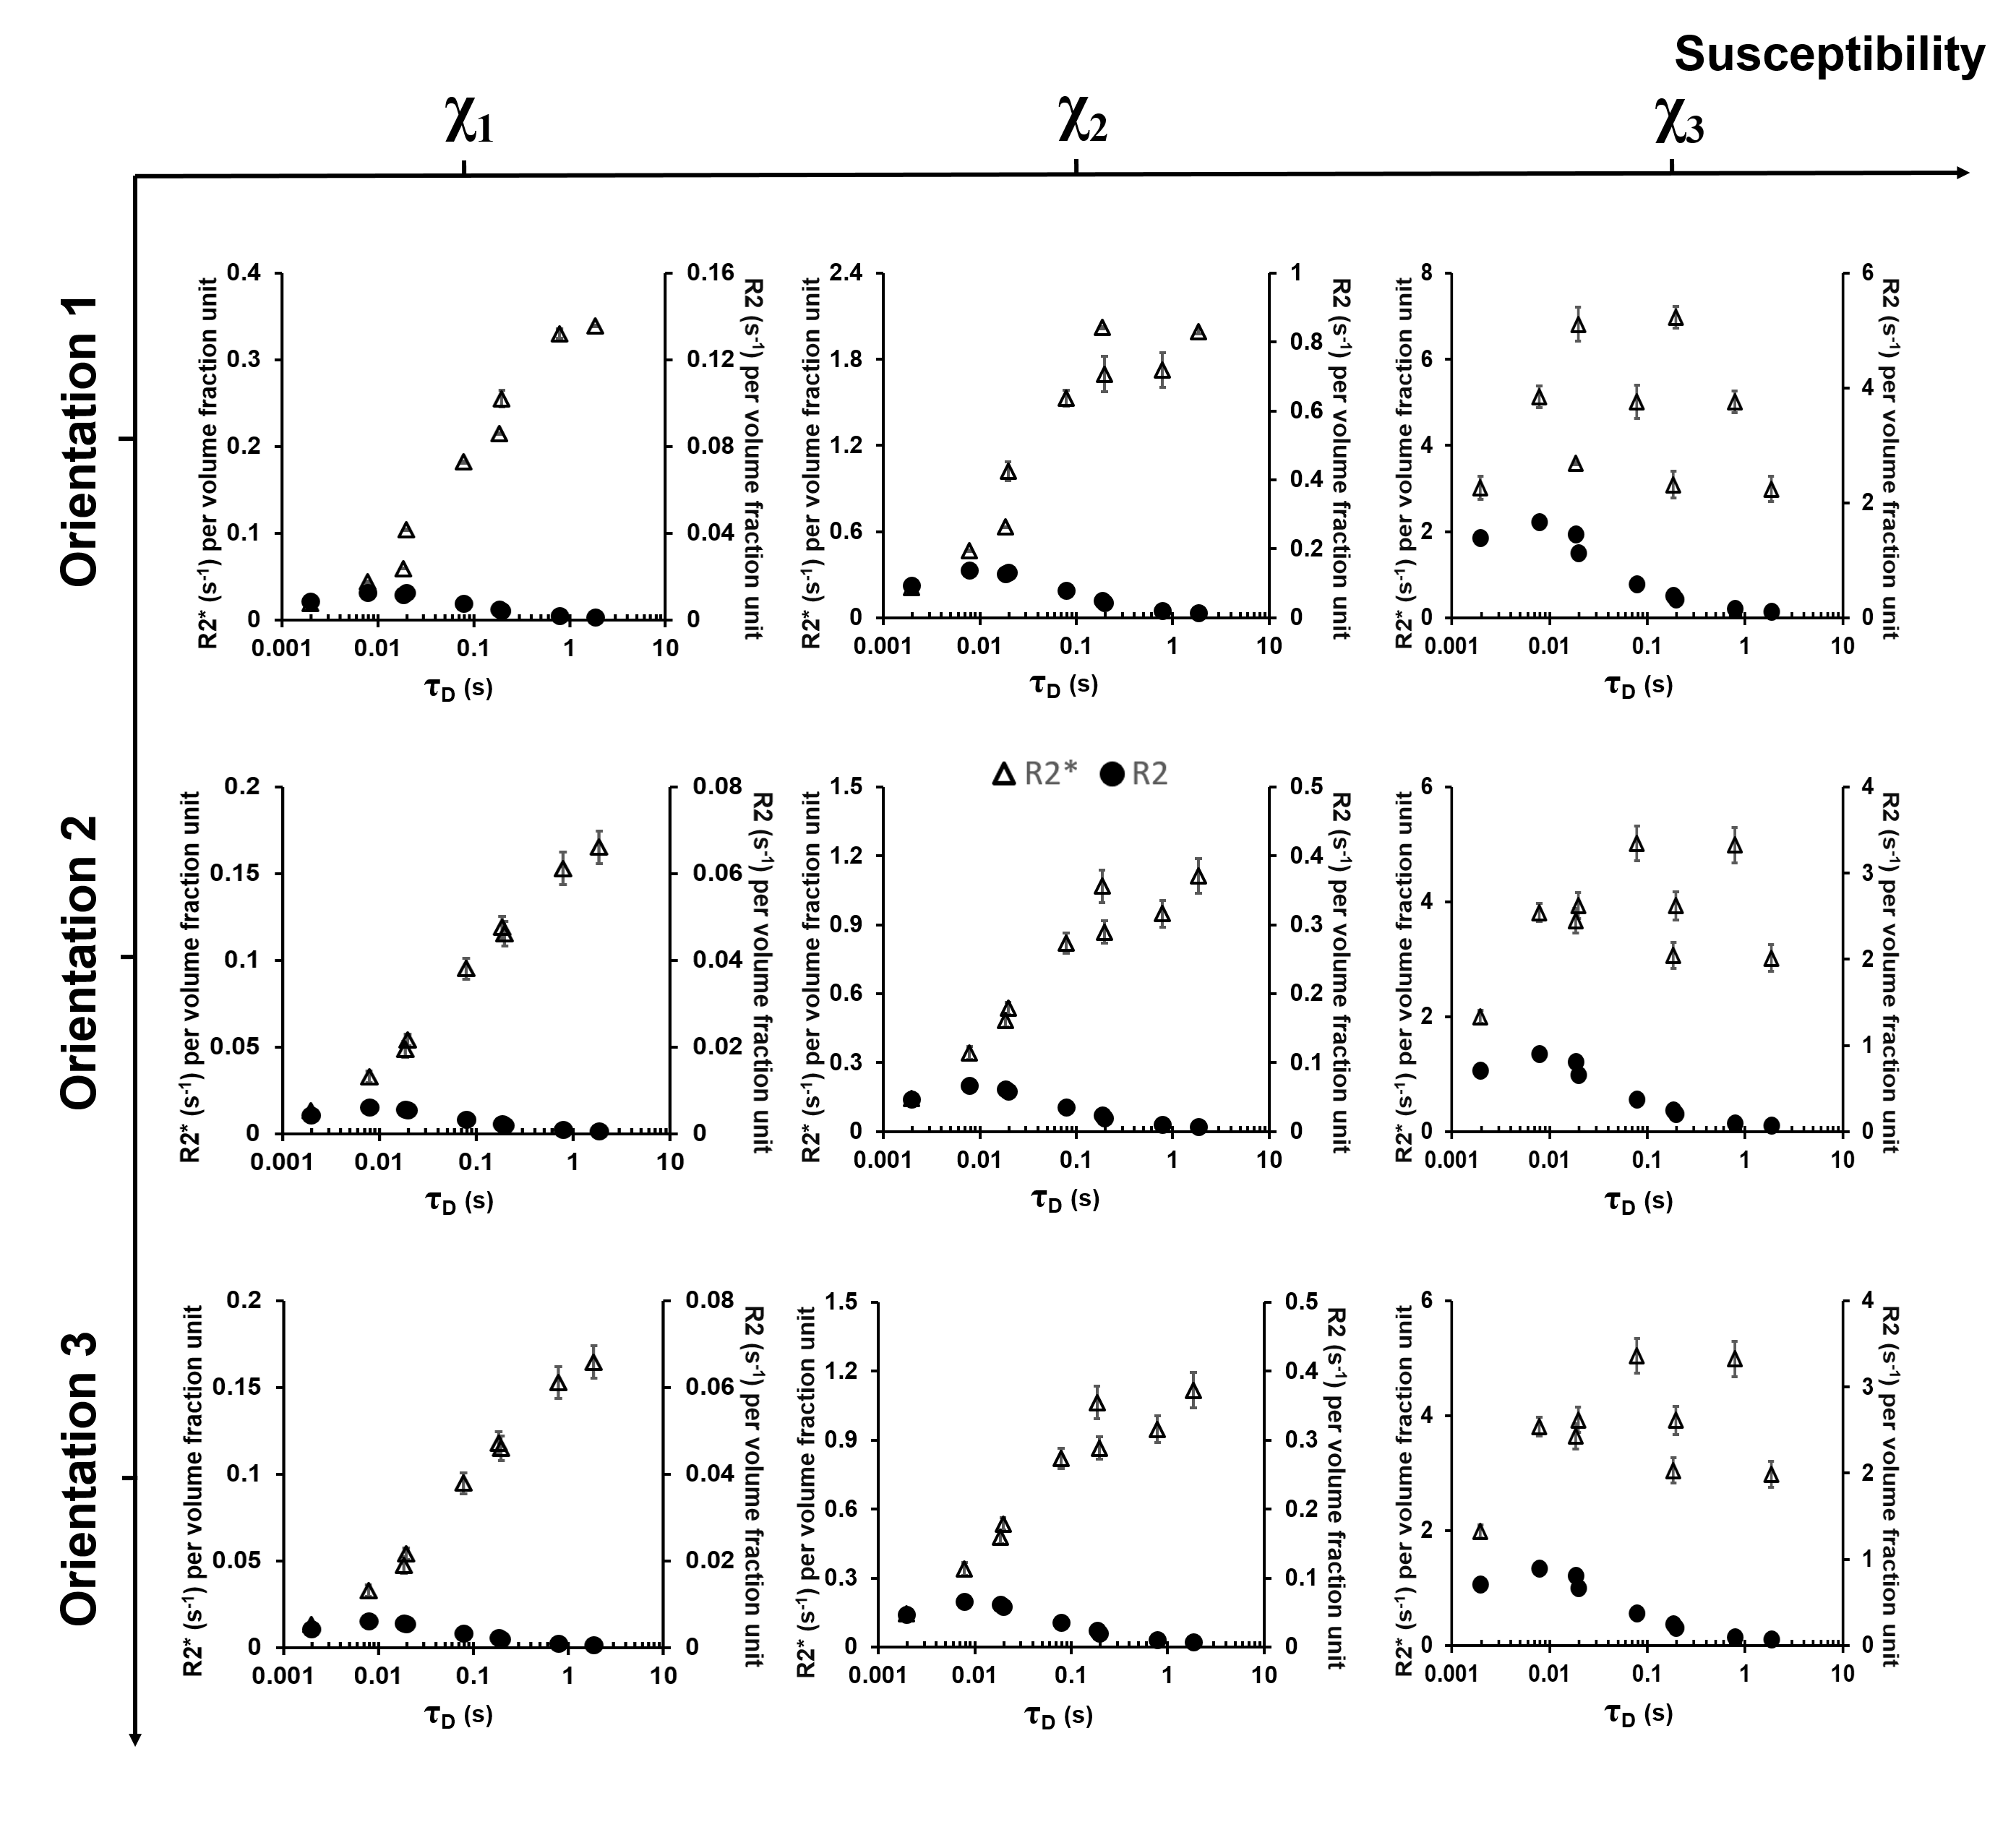
Unlike R2*,6 ϕ showed a significant effect on R2 in Orientations 2 (Fig. 3) and 3 (Fig. 4) at the lower diameters for all χ values while no significant effects were observed in Orientation 1 (Fig. 2). Thus, when combined with the information from the R2* experiments, the larger vessels could be distinguished from the lower ones based on the rotation angle signature given by the R2* and R2 values. Diffusion rates showed a significant effect on R2 for all orientations, diameters, and χ values. An interesting point to note is that at the smallest vessel size and the two lower χ values, the R2 values increased with the diffusion rate and then decreased again (Figs. 2-4), while the R2* values for the respective scenario just decreased with increasing diffusion rates.6 This behavior is indicative of a shift of R2 from the motional averaged regime (MAR) towards the echo-limited regime (ELR),10 which is depicted in the CFM correlation time (τD) plots (Fig. 5) where R2* and R2 showed an increase with the vessel size (or τD) within the MAR up to τD = 0.01 s. R2* reached a plateau only for the two higher χ values while R2 showed a decrease with vessel size after τD = 0.01 s: this is indicative of the fact that R2 lies within the ELR.Conclusion
The angular dependence of R2 and R2* using the CFM can potentially be exploited as a tool to differentiate between normal and tumor vessels. The CFM can also serve as the elementary building block to simulate a capillary network reflecting realistic topological features in the human cortex.11Acknowledgements
This work was funded by the Emirates National Research Fund (Emirates NRF - 31S087), UAE University (UPAR 31S157 and 31S246), and NIH/NCI grant (U01 CA154601).References
1. Shazeeb MS & Issa BA. Simulation study investigating the role of vessel topology in differentiating normal and tumor vessels using transverse relaxation times. Proc Intl Soc Mag Reson Med. 2015;23:3031.
2. Marques JP & Bowtell RW. Using forward calculations of the magnetic field perturbation due to a realistic vascular model to explore the BOLD effect. NMR Biomed. 2008;21:553-565.
3. Duvernoy HM, Delon S & Vannson JL. Cortical blood vessels of the human brain. Brain Res Bull. 1988;7:519-579.
4. Coomber BL, Stewart PA, Hayakawa EM, et al. A quantitative assessment of microvessel ultrastructure in C6 astrocytoma spheroids transplanted to brain and to muscle. J Neuropathol Exp Neurol. 1988;47:29-40.
5. Shazeeb MS & Issa BA. Effect of diffusion and vessel topology on relaxation mechanisms using a cylinder fork model. Proc Intl Soc Mag Reson Med. 2015;23:3032.
6. Shazeeb MS, Kalpathy-Cramer J, & Issa BA. Simulation study investigating the effect of diffusion, susceptibility, and vessel topology in characterizing normal and tumorous vasculature using R2*. Proc Intl Soc Mag Reson Med. 2016;24:3089.
7. Kennan RP, Zhong J & Gore, JC. Intravascular susceptibility contrast mechanisms in tissues. Magn Reson Med. 1994;31:9-21.
8. Le Bihan D, Breton E, Lallemand D, et al. Radiol. 1986;161:401-407.
9. Marques JP & Bowtell RW. Application of a Fourier-based method for rapid calculation of field inhomogeneity due to spatial variation of magnetic susceptibility. Concepts Magn Reson Part B Magn Reson Eng. 2005;25B:65-78.
10. Boxerman JL, Hamberg LM, Rosen BR et al. MR contrast due to intravascular magnetic susceptibility perturbations. Magn Reson Med. 1995;34:555-566.
11. Gagnon L, Sakadžić S, Lesage F, et al. Quantifying the Microvascular Origin of BOLD-fMRI from First Principles with Two-Photon Microscopy and an Oxygen-Sensitive Nanoprobe. J Neurosci. 2015;35(8):3663-3675.
Figures