1683
DWI virtual MR elastography of the upper abdominal organs in healthy volunteers1Shengjing Hospital of China Medical University, Shen Yang, China, 2Philips Healthcare, Beijing, China
Synopsis
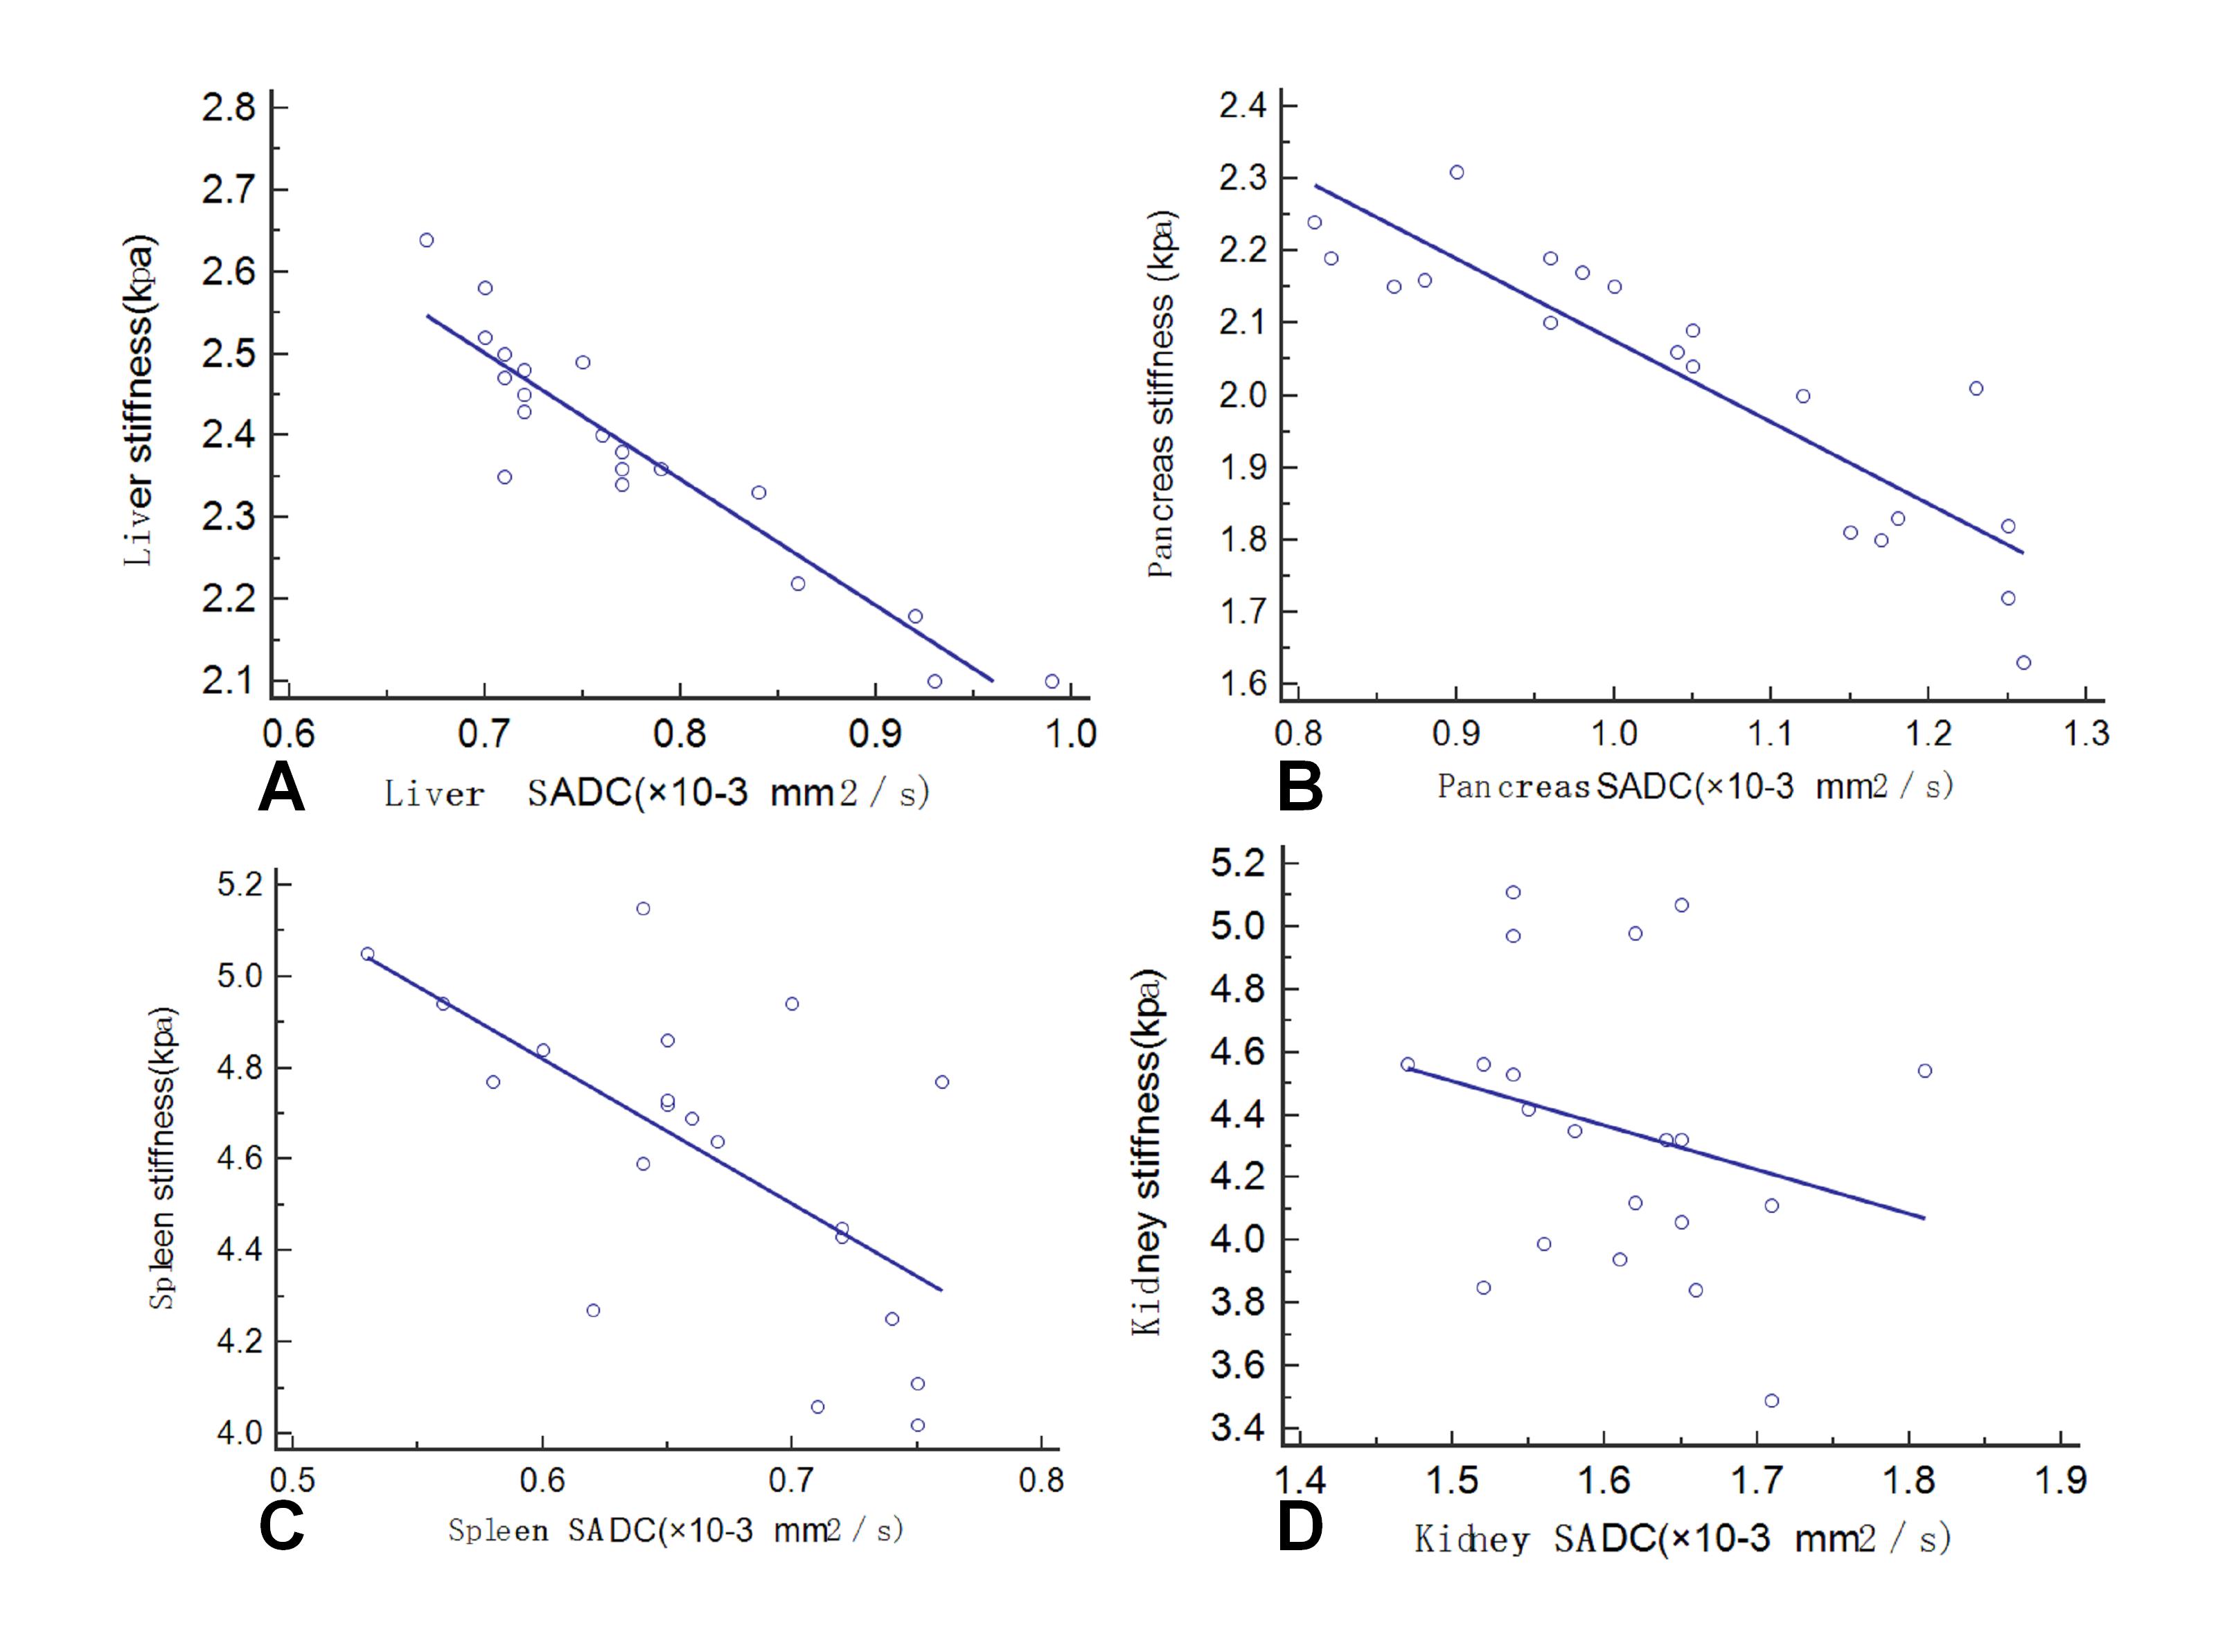
Le et al1recently found that apparent diffusion coefficient (ADC) calculated from 2 key b values (“shifted ADC”, or sADC) can be directly and quantitatively represent healthy liver stiffness and be compared with results obtained by standard MR elastography (MRE). In this study, we found that there is a strong linear relationship between sADC and stiffness in both liver and pancreas, and a weak relationship in spleen, but no coherence in kidney in healthy volunteers.
Purpose
MR elastography (MRE), the MRI-based technique for producing quantitative maps of tissue stiffness in vivo, has limitations including restricted availability, the need for extra drive system and technical difficulty to access deep organs2. In contrast, diffusion MRI (dMRI) is the broadly used sensitive measurement to understand microstructure regarding to water movement3. The “shifted ADC” (sADC) calculated from b = 200, 1500 has shown to be linearly correlated with stiffness in liver1. Hence, we carried investigate to validate this finding and to further probe the relationship between stiffness in different abdominal organ and ADC in healthy volunteers.Methods
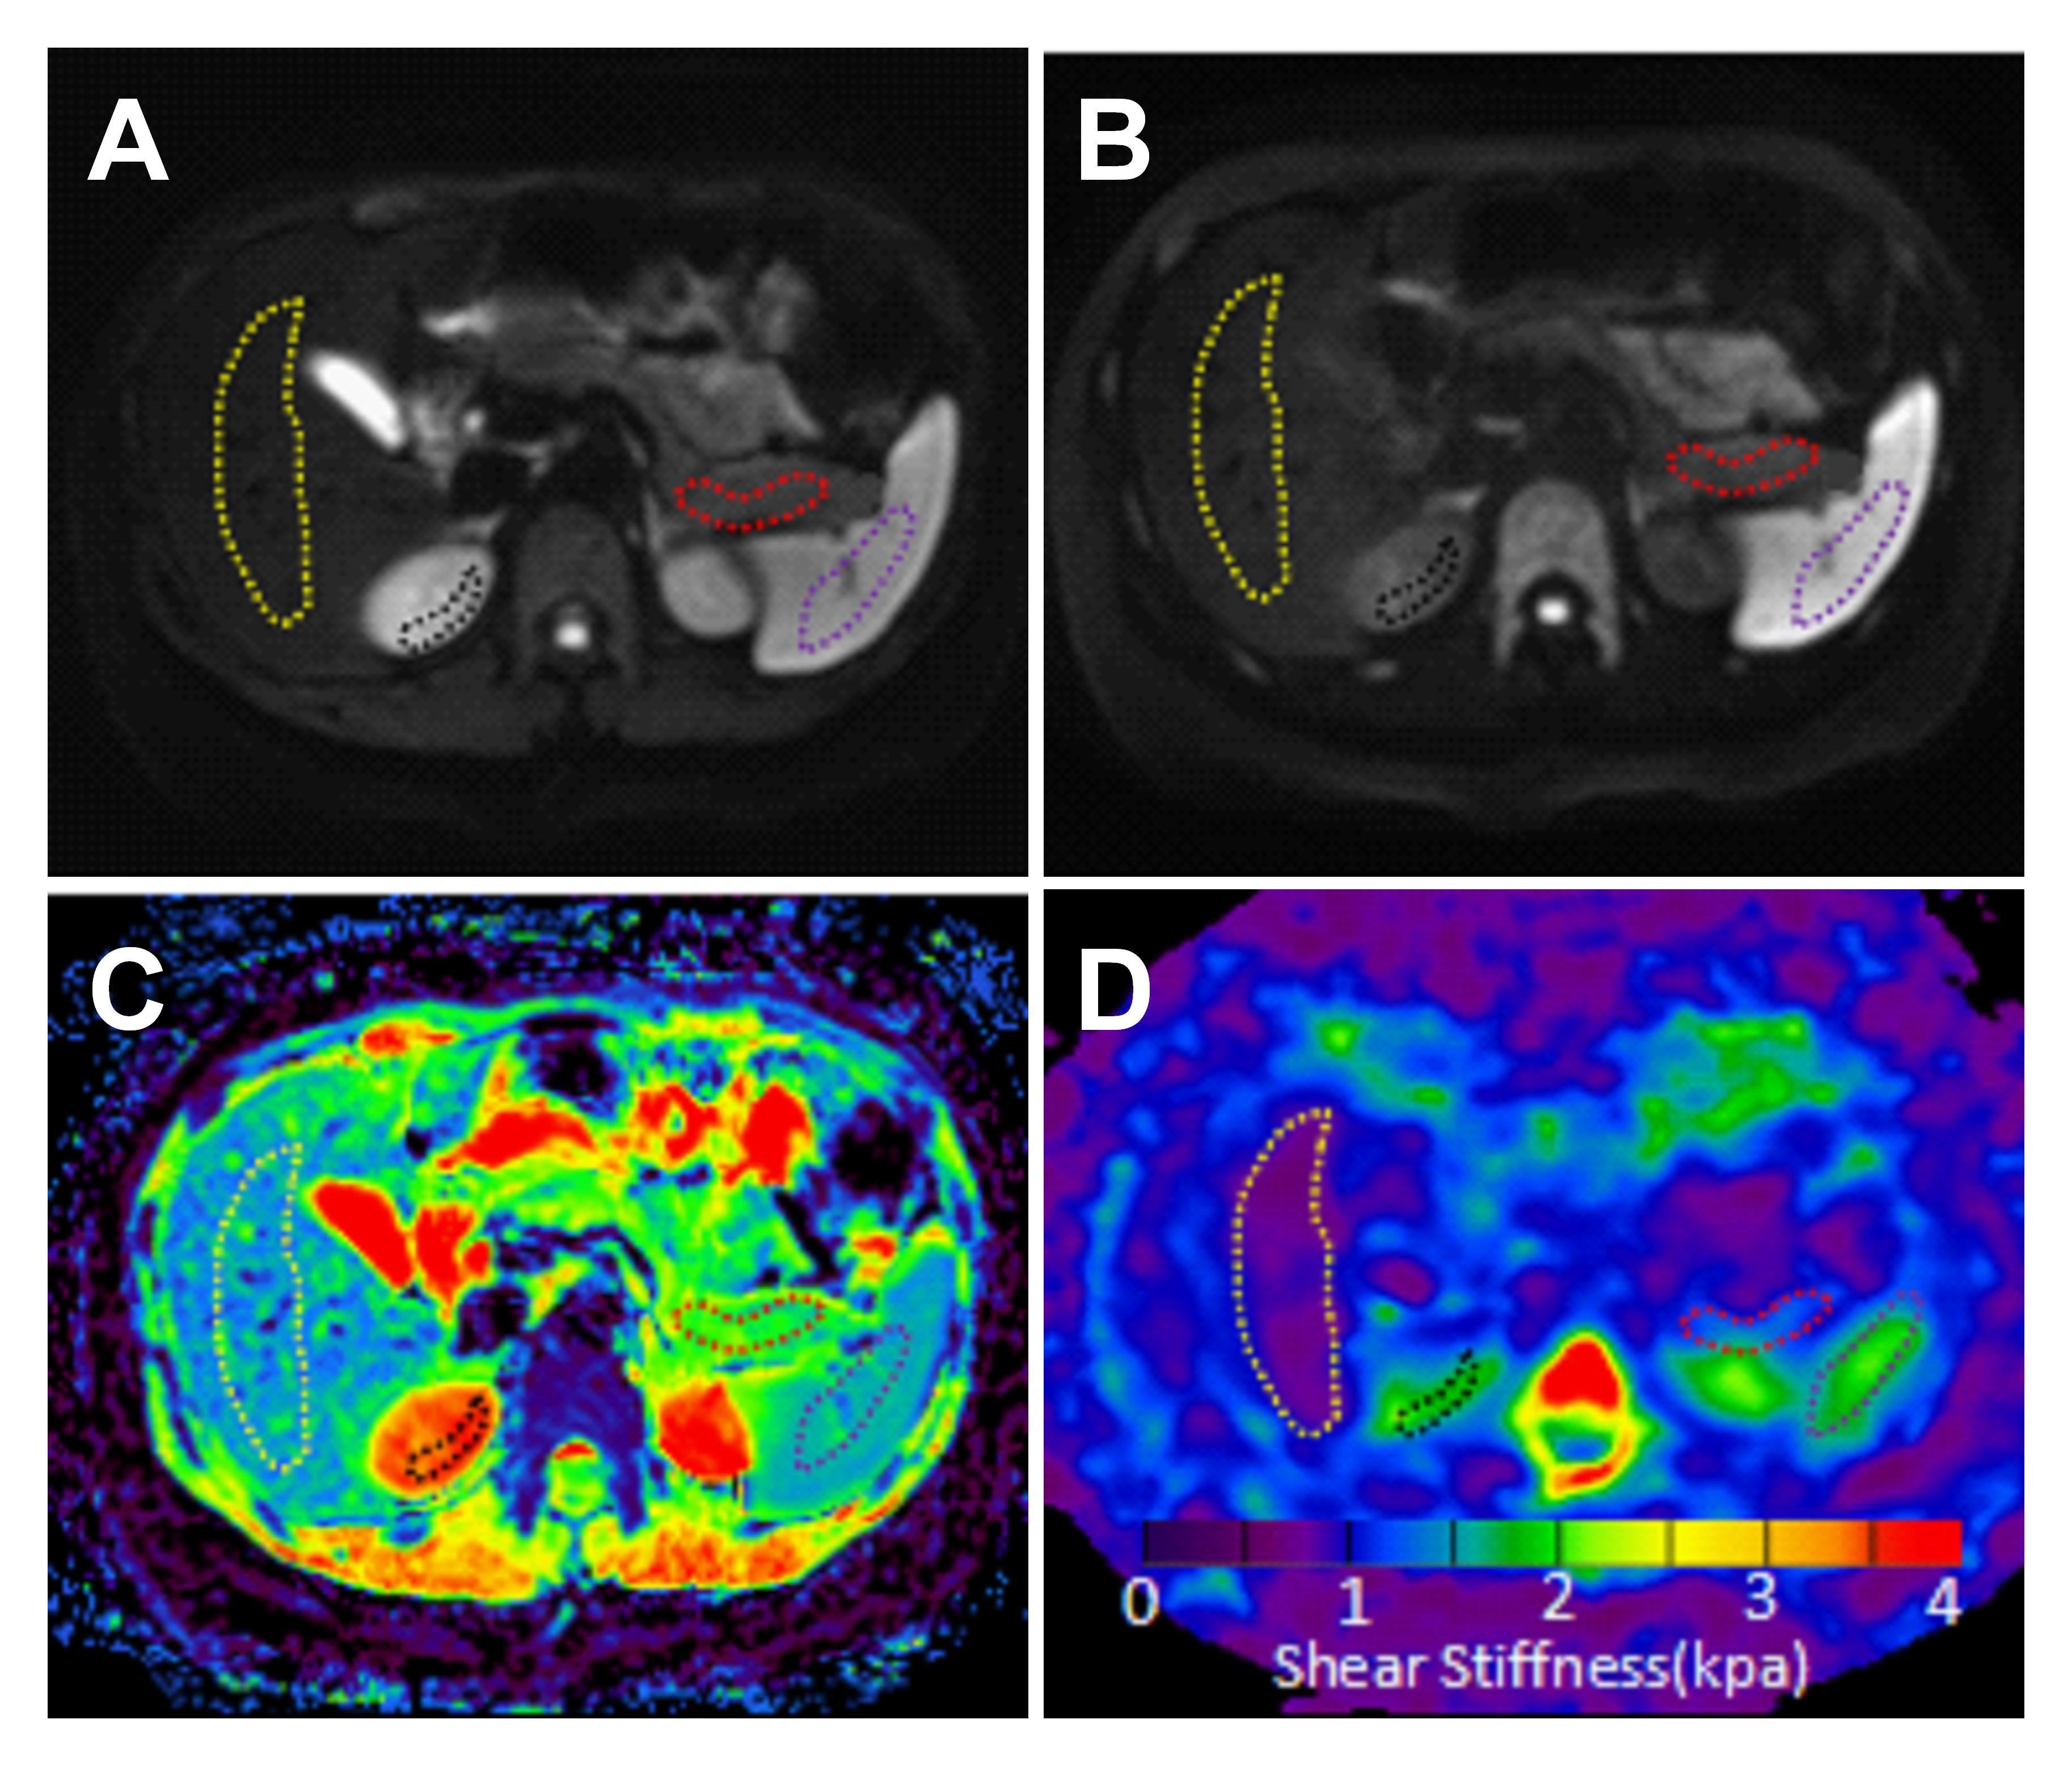
This Institutional Review Board (IRB)-approved, Health Insurance Portability and Accountability Act (HIPAA)-compliant preceding study recruited 20 volunteers (8 male,12 female). All subjects underwent dMRI(Philips 3.0T Ingenia, Philips Medical System, The Netherlands) with default clinical settings but diffusion weightings at b=200-1500, and measurement was repeated 2 and 6 times respectively to enhance SNR (imaging protocol: SE-EPI;TR/TE=3039.42ms/84.25ms;respiratory gating;NSA=2; thickness=5mm;acquisition matrix=128x110;FOV=38cmx33.6cm;number of slices = 40; WFS(pix)/BW(HZ)=11.028/39.4). Regions-of-interest (ROIs) were placed in the abdominal organs, and a “shifted ADC” (sADC) was calculated from the signals, s200 and s1500 acquired at b=200 and b=1500:
sADC=ln (s200/s1500)/1300
s200 and s1500 are the signal intensity on diffusion images of b=200 and 1500, respectively.
MRE was performed in Signa (HDX system; GE Healthcare, Milwaukee, WI). MRE protocol was set as: frequency=60Hz; TR/TE = 1333.76ms/38.4ms; phase offsets = 3; FOV = 40cmx40cm; acquisition matrix = 96×96; number of signal averages = 1; frequency-encoding direction = RL; parallel imaging acceleration factor = 3; number of slices = 32; slice thickness = 3.5 mm. Stiffness maps (elastograms) were generated by utilizing an inversion algorithm; and stiffness values on ROIs were measured from the elastograms by an independent reader, blind to the dMRI results.
Results
Linear relationship was found in liver, pancreas and spleen between sADC and MRE, but with different linear coefficients at each organ respectively: stiffnessliver =3.59-1.55sADC; stiffnesspancreas =3.21-1.13sADC; stiffnessspleen =6.73-3.18sADC. No linear relationship was found in kidney. The correlation between stiffness and MRE was strong in liver and pancreas (R2liver=0.87, p<0.001;R2pancreas=0.79, p<0.001), and weak in spleen(R2spleen=0.40, p=0.0028).
Conclusion
This study confirmed the relationship between sADC and stiffness in liver, pancreas and the spleen in normal volunteers with different coefficients, while no coherence was found in the kidney in current measurement.
Discussion
The studies found that previously assumed independent diffusivity and elasticity have intrinsic correlations. This correlation is because both are aspects in presenting tissue properties; and the relation confidents are different at different organs due to the difference in tissue properties2,4. The dMRI measurement for sADC generated similar stiffness value not only in liver, but also in deep-seated organs, such as pancreas and spleen where we found challenges in MRE acquisitions.Based on the strong relation between sADC and elastogram, it is proposed to estimate the virtual shear stiffness values in cases where mechanical vibrations for MRE is not accessible.
Weaker correlation was found in spleen than in liver and pancreas, which might because spleen is rich in blood and the tissue specific water diffusion measurement is impacted. No correlation was observed from sampled data in kidney, which might be due to the directivities in renal medulla and abundant unrestricted water contaminate the tissue specific diffusivity measurement 5. Further validation of these findings in a larger sample size will be continued; and we will investigate diffusivity and elasticity correlation in patients.
Acknowledgements
We thank Richard Ehman and Kevin Glaser from the Mayo Clinic for providing the MRE system. We also thank Jun Chen from the Mayo Clinic for his assistance with providing the tailored pancreatic MRE driver.This work was supported by a grant from the National Natural Science Foundation of China (No. 81771893,81771802 and NIH EB1801).References
1.Le B D, Ichikawa S, Motosugi U. Diffusion and Intravoxel Incoherent Motion MR Imaging-based Virtual Elastography: A Hypothesis-generating Study in the Liver. Radiology.2017:170025.
2.Venkatesh S K, Ehman R L. Magnetic resonance elastography of abdomen. Abdominal Imaging.2015; 40(4):745-759.
3.Le B D. Apparent diffusion coefficient and beyond: what diffusion MR imaging can tell us about tissue structure. Radiology.2013;268(2):318-322.
4.Morani A C, Elsayes K M, Liu P S, et al. Abdominal applications of diffusion-weighted magnetic resonance imaging: Where do we stand. World Journal of Radiology.2013; 5(3):68.
5.Bittencourt L K, Matos C, Jr C A. Diffusion-weighted magnetic resonance imaging in the upper abdomen: technical issues and clinical applications. Magn Reson Imaging Clin N Am.2011;19(1):111-131.
Figures