1682
Diffusion-Weighted MR Imaging of the Parotid glands in healthy volunteers before and after a gustatory stimulation to quantify relative function1Newcastle Magnetic Resonance Centre, Newcastle University, Newcastle upon Tyne, United Kingdom
Synopsis
Diffusion Weighted MR Imaging has been used to quantify the function of parotid
glands. Clinically gland function is measured using Scintigraphy, but MR offers
a non-invasive, non-ionising alternative to this method. A DWI sequence for
investigating parotid gland function is presented and tested in five healthy
volunteers scanned on two occasions. We used four parameters to represent gland
function: perfusion fraction (fv), apparent perfusion coefficient
(ADCperfusion), diffusion fraction (fd) and apparent
diffusion coefficient (ADCdiffusion). Statistically significant changes
were observed in fv, fd and ADCdiffusion in volunteers.
Results indicate a normal range for these parameters.
Purpose
Diffusion Weighted Imaging (DWI) can be employed in head and neck MRI to quantify the function of the parotid glands1. A number of models can be used to evaluate gland function from the diffusion attenuation behavior: mono-exponential, stretched exponential and bi-exponential (Intra-Voxel Incoherent Motion (IVIM)) 2,3,4. IVIM allows quantification of both perfusion and diffusion behavior within the gland parenchyma, utilizing low and high b-values (s/mm2), an advantage over the other models. Comparison of extracted parameters, before and after a stimulus (e.g. lemon juice) is administered allows quantification of function. Parameters from IVIM include: perfusion fraction (fv), apparent perfusion coefficient (ADCperfusion), diffusion fraction (fd) and apparent diffusion coefficient (ADCdiffusion). There is disagreement in the literature regarding pre and post stimulus parotid gland IVIM values in-vivo3,5,6. This study aimed to add to the current literature and strengthen the use of the IVIM model for quantification of gland function.Materials and Methods
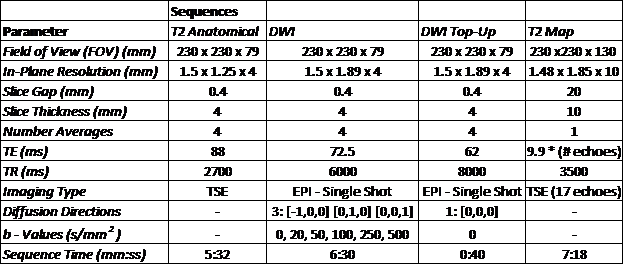
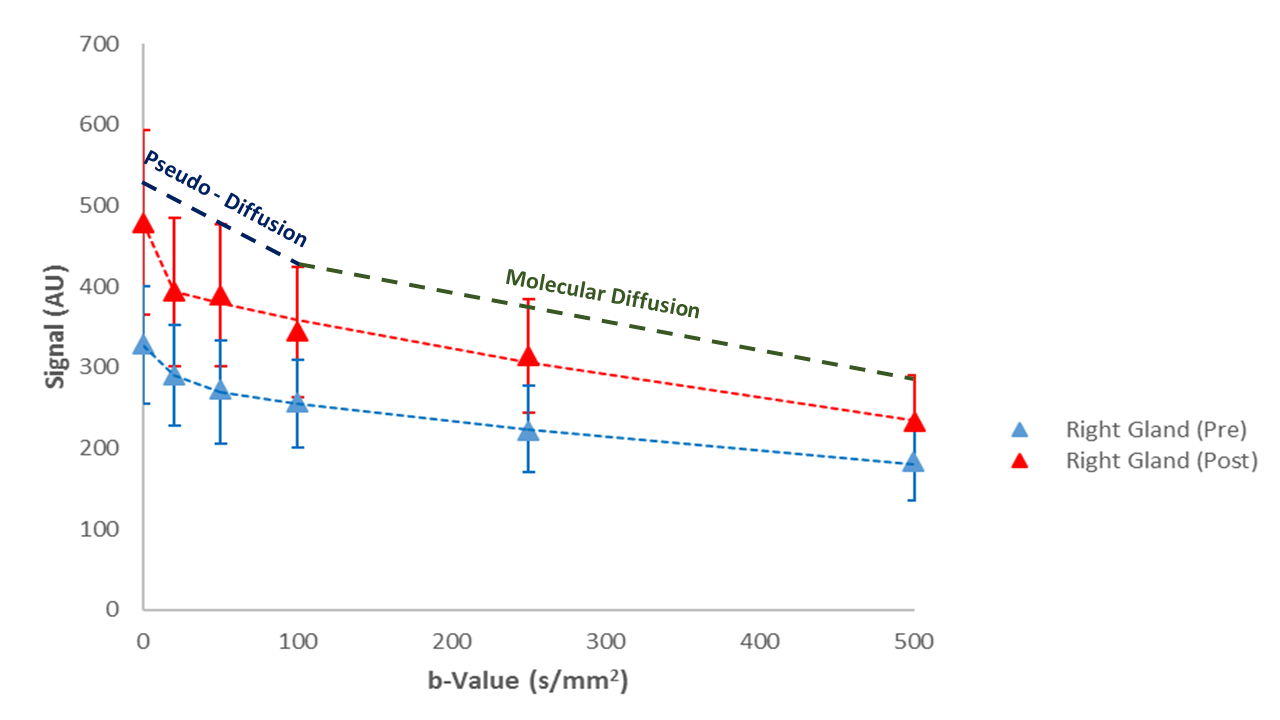
Five healthy volunteers (31.6 ± 9.6 yrs.) underwent two MRI scans one week apart on a 3 T Philips Achieva (Philips, Best, the Netherlands) using an 8 channel SENSE neurovascular coil. A T2 weighted anatomical image was acquired and then a DWI sequence was performed followed by a single scan acquired with opposite phase encode direction for distortion correction7. b-values were chosen to incorporate perfusion (low b value range < 100 s/mm2) and molecular diffusion (> 100 s/mm2) information (Fig 1). 5 ml of commercially available lemon juice was then self-administered, held in the mouth for 10 s and swallowed. The DWI protocol was then repeated. The T2 relaxation time of the parotid glands were also estimated using a T2 mapping sequence. For all sequence parameters see Fig 1. The average signal intensity across the volume of each gland was calculated by placing regions of interest (ROIs) on each slice where the gland was visible. This was used to perform bi-exponential fits to the Intra-Voxel Incoherent Motion (IVIM)8 model:
$$S(b) = f_{v}\exp(-b\times ADC_{perfusion}) + f_{d}\exp(-b\times ADC_{diffusion}) (1) $$
Mann-Whitney U tests were used to statistically compare parameters both between right and left glands and pre and post stimulus in the same gland.
Results
The measured values of T2 from this study provide independent data for the healthy parotid gland with values of 65.8 ± 4.6 ms (right gland) and 64.1 ± 4.6 ms (left gland).
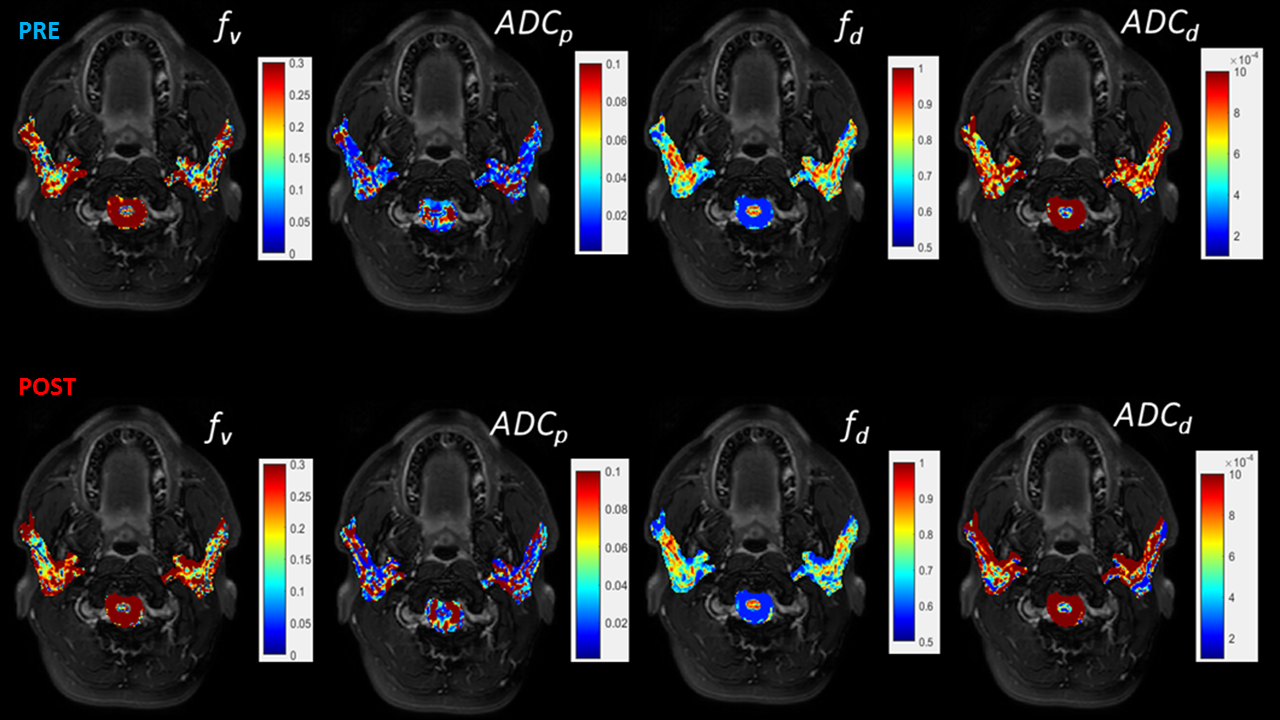
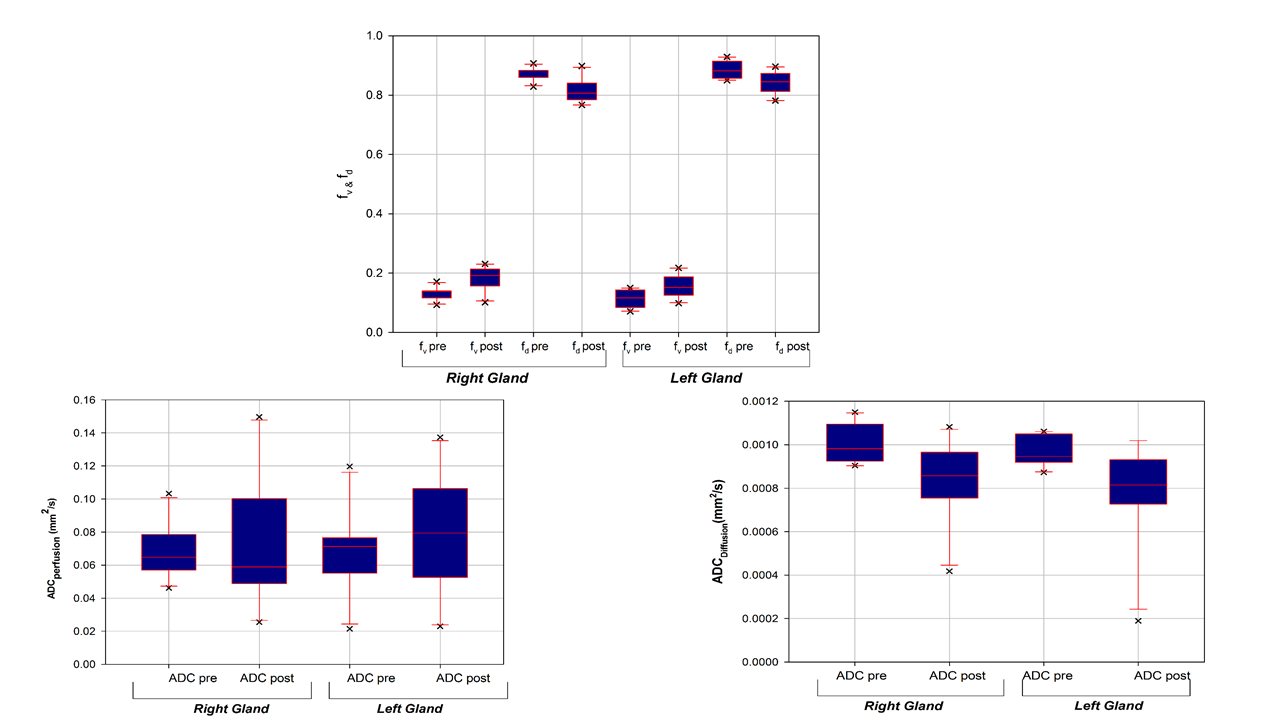
Example diffusion attenuation curves for the right gland (pre and post stimulus) along with overlaid maps for each parameter are shown in Figs. 2 & 3, with boxplots of all parameters shown in Fig. 4. There were no significant differences in any parameters when compared between right and left glands: (fv(pre) p = 0.2727 ; fv(post) p = 0.1212), (ADCp(pre) p = 0.994 ; ADCp(post) p = 0.5708), (fd(pre) p = 0.5708 ; fd(post) p = 0.2721), (ADCd(pre) p = 0.3075 ; ADCd(post) p = 0.6232). When comparing parameters pre and post stimulus in the same gland: fv(pre/post) showed a statistically significant increase post stimulation (p = 0.0036 Right; p = 0.0172 Left), ADCperfusion(pre/post) showed no significant change (p = 0.5706 Right; p = 0.3845 Left), fd(pre/post) showed a significant decrease post (p = 0.0036 Right; p = 0.0172 Left) and ADCdiffusion(pre/post) showed a significant decrease post (p = 0.0257 Right; p = 0.0139 Left).
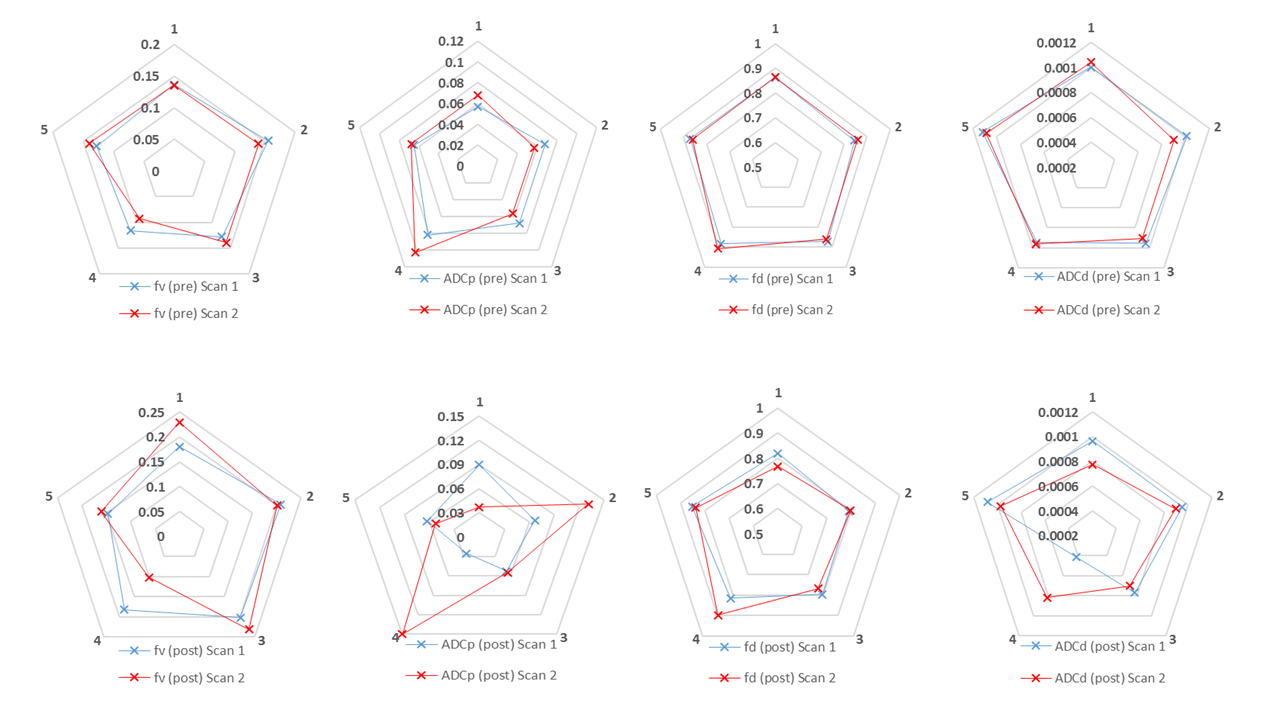
Scans within the same subject were reproducible pre-stimulus with an average coefficient of variation (CV) for each parameter of: (fv = 1.81%; ADCp = 2.63%; fd = 0.28%; ADCd = 1.88%). Post stimulus showed larger variation in ADCp with CV of: (fv = 0.24%; ADCp = 25.14%; fd = 0.06%; ADCd = 0.39%) see Fig. 5.
Discussion
This study found that post stimulation there was an increase in fv, which may be expected as the gland is stimulated to produce saliva. There was also a decrease in both fd and the ADCdiffusion, which may also be expected within the gland parenchyma as the saliva exits the gland via the parotid tract3. Comparison of parameters within the same subject for repeated scans demonstrated good reproducibility pre-stimulus, however show differences post stimulus. This suggests that volunteers may unconsciously change their stimulant response based on knowledge of the previous scan.Conclusions
The study showed significant changes in fv, fd and ADCdiffusion after stimulation, adding to the literature base and promoting the use of DWI in parotid gland evaluation. Extensions of this work include imaging patients with autoimmune conditions affecting the glands such as Sjögren’s syndrome to identify areas of functional deficit. This research also has applications in Radiotherapy allowing identification of areas of tissue to be spared during treatment.Acknowledgements
With thanks to the Radiographers at our centre.References
1. Thoeny, H., De Keyzer, F. and King, A. (2012) 'Diffusion-weighted MR Imaging in the Head and Neck ', Radiology, 263(1), 19:32.
2. Loimu, V., Seppala, T., Kapanen, M., Tuomikoski, L., Nurmi, H., Makitie, A., Tenhunen, M. and Saarilahti, K. (2017) 'Diffusion-weighted magnetic resonance imaging for evaluation of salivary gland function in head and neck cancer patients treated with intensity-modulated radiotherapy', Radiotherapy and Oncology, 122, 178:184.
3. Zhang, L., Murata, Y., Ishida, R., Ohashi, I., Yoshimura, R. and Shibuya, H. (2001) 'Functional evaultion with intravoxel incoherent motion echo-planar MRI in irradiated salivary glands: A correlative study with salivary gland scintigraphy', Journal of Magnetic Resonance Imaging, 14(3), 223:229.
4. Chun, J., Hing, C., Chun, J., Hua, S., Yin, C., Hsiao, W., Cheng, Y., Hung, W. and Guo, S. (2009) 'Salivary Glands: Echo-Planar versus PROPELLER Diffusion-weighted MR Imaging for Assessment of ADCs', Radiology, 253(1), 144:152.
5. Yoshino, N., Yamada, I., Ohbayashi, N., Honda, E., Ida, M., Kurabayashi, T., Maruyama, K. and Sasaki, T. (2001) 'Salivary Glands and Lesions: Evaluation of Apparent Diffusion Coefficients with Split-Echo Diffusion-weighted MR Imaging - Initial Results', Radiology, 221(3), 837.
6. Sumi, M., Takagi, Y., Uetani, M., Morikawa, M., Hayashi, K., Kabasawa, H., Aikawa, K. and Nakamura, T. (2002) 'Diffusion-Weighted Echoplanar MR Imaging of the Salivary Glands ', American Journal of Roentgenology, 178(4), 959:965.
7. Andersson, R., Skare, S. and Ashburner, J. (2003) 'How to correct susceptibility distortions in spin-echo echo-planar images: application to diffusion tensor imaging', NeuroImage, 20(2), 870:888.
8. Shinmoto, H., Tamura, C., Shigeyoshi, S., Shiomi, E., Yoshihara, N., Kaji, T. and Mulkern, R. (2012) 'An Intravoxel Incoherent Motion Diffusion-Weighted Imaging Study of Prostate Cancer', Genitourinary Imaging, 199, 496:500.
Figures