1673
Role of intravoxel incoherent motion diffusion-weighted imaging in the assessment of invasiveness for bladder cancerFang Wang1, Guangyu Wu1, and Weibo Chen2
1Ren Ji Hospital, School of Medicine, Shanghai Jiao Tong University, Shanghai, China, 2Philips Healthcare, Shanghai, China
Synopsis
The degree of bladder wall invasion by bladder cancer determines the clinical management, for muscle invasive bladder cancer (MIBC, Stage T2 or more) recommended neoadjuvant chemotherapy before radical cystectomy and non-muscle invasive bladder cancer (NMIBC, Stage T1 or lower) treated with transurethral resection (TUR). Thus, differentiating NMIBC from MIBC using preoperative imaging plays a crucial role in clinical practice.
Purpose
To evaluate the performance of intravoxel incoherent motion (IVIM) diffusion-weighted imaging (DWI) to assess the invasiveness of bladder cancer.Materials and Methods
In this retrospective study, 36 patients diagnosed with bladder urothelial carcinoma confirmed by pathological findings underwent magnetic resonance imaging with a protocol including T1WI, T2WI, and DWI using 8 b-values (0, 50, 100, 150, 200, 500, 800, and 1000s/mm2) before transurethral resection (TUR). Apparent diffusion coefficient (ADC) and molecular diffusion coefficient (D), perfusion fraction (f), perfusion-related diffusion coefficient (D*) were obtained form mono-exponential and bi-exponential model fits respectively. Comparisons were made between the non-muscle invasive bladder cancer (NMIBC, Stage T1 or lower) and muscle invasive bladder cancer (MIBC, Stage T2 or more) group and differences in these parameters were analyzed by comparing the areas under the receiver operating characteristic curves (AUC). The correlations between Ki-67 labeling index (LI) and these parameters were also analyzed.Results
ADC and D value were significantly lower in MIBC group than those with in NMIBC group (both p<0.01). No statistically significant difference was observed in other parameters (p>0.05). The diagnostic performance of D value was better than ADC value for differentiating NMIBC from MIBC, with sensitivities and specificities of ADC and D value were 80% and 68.7%, 95% and 87.5%, respectively. Additionally, there was a negative correlation between Ki-67 LI and D value (r=-0.785, p<0.01).Conclusions
The diagnostic performance of D value obtained from IVIM was better than ADC value for differentiating NMIBC from MIBC and it could be a potential imaging biomaker for bladder cancer invasiveness.Acknowledgements
No acknowledgement found.References
1. Griffiths TR. Current perspectives in bladder cancer management. Int J Clin Pract 2013;67:435-448.
2. Apolo AB, Vogelzang NJ,Theodorescu D. New and promising strategies in the management of bladder cancer. Am Soc Clin Oncol Educ Book 2015;35:105-112.
3. Stein JP, Skinner DG. Radical cystectomy for invasive bladder cancer: long-term results of a standard procedure. World J Urol 2006;24:296–304.
Figures
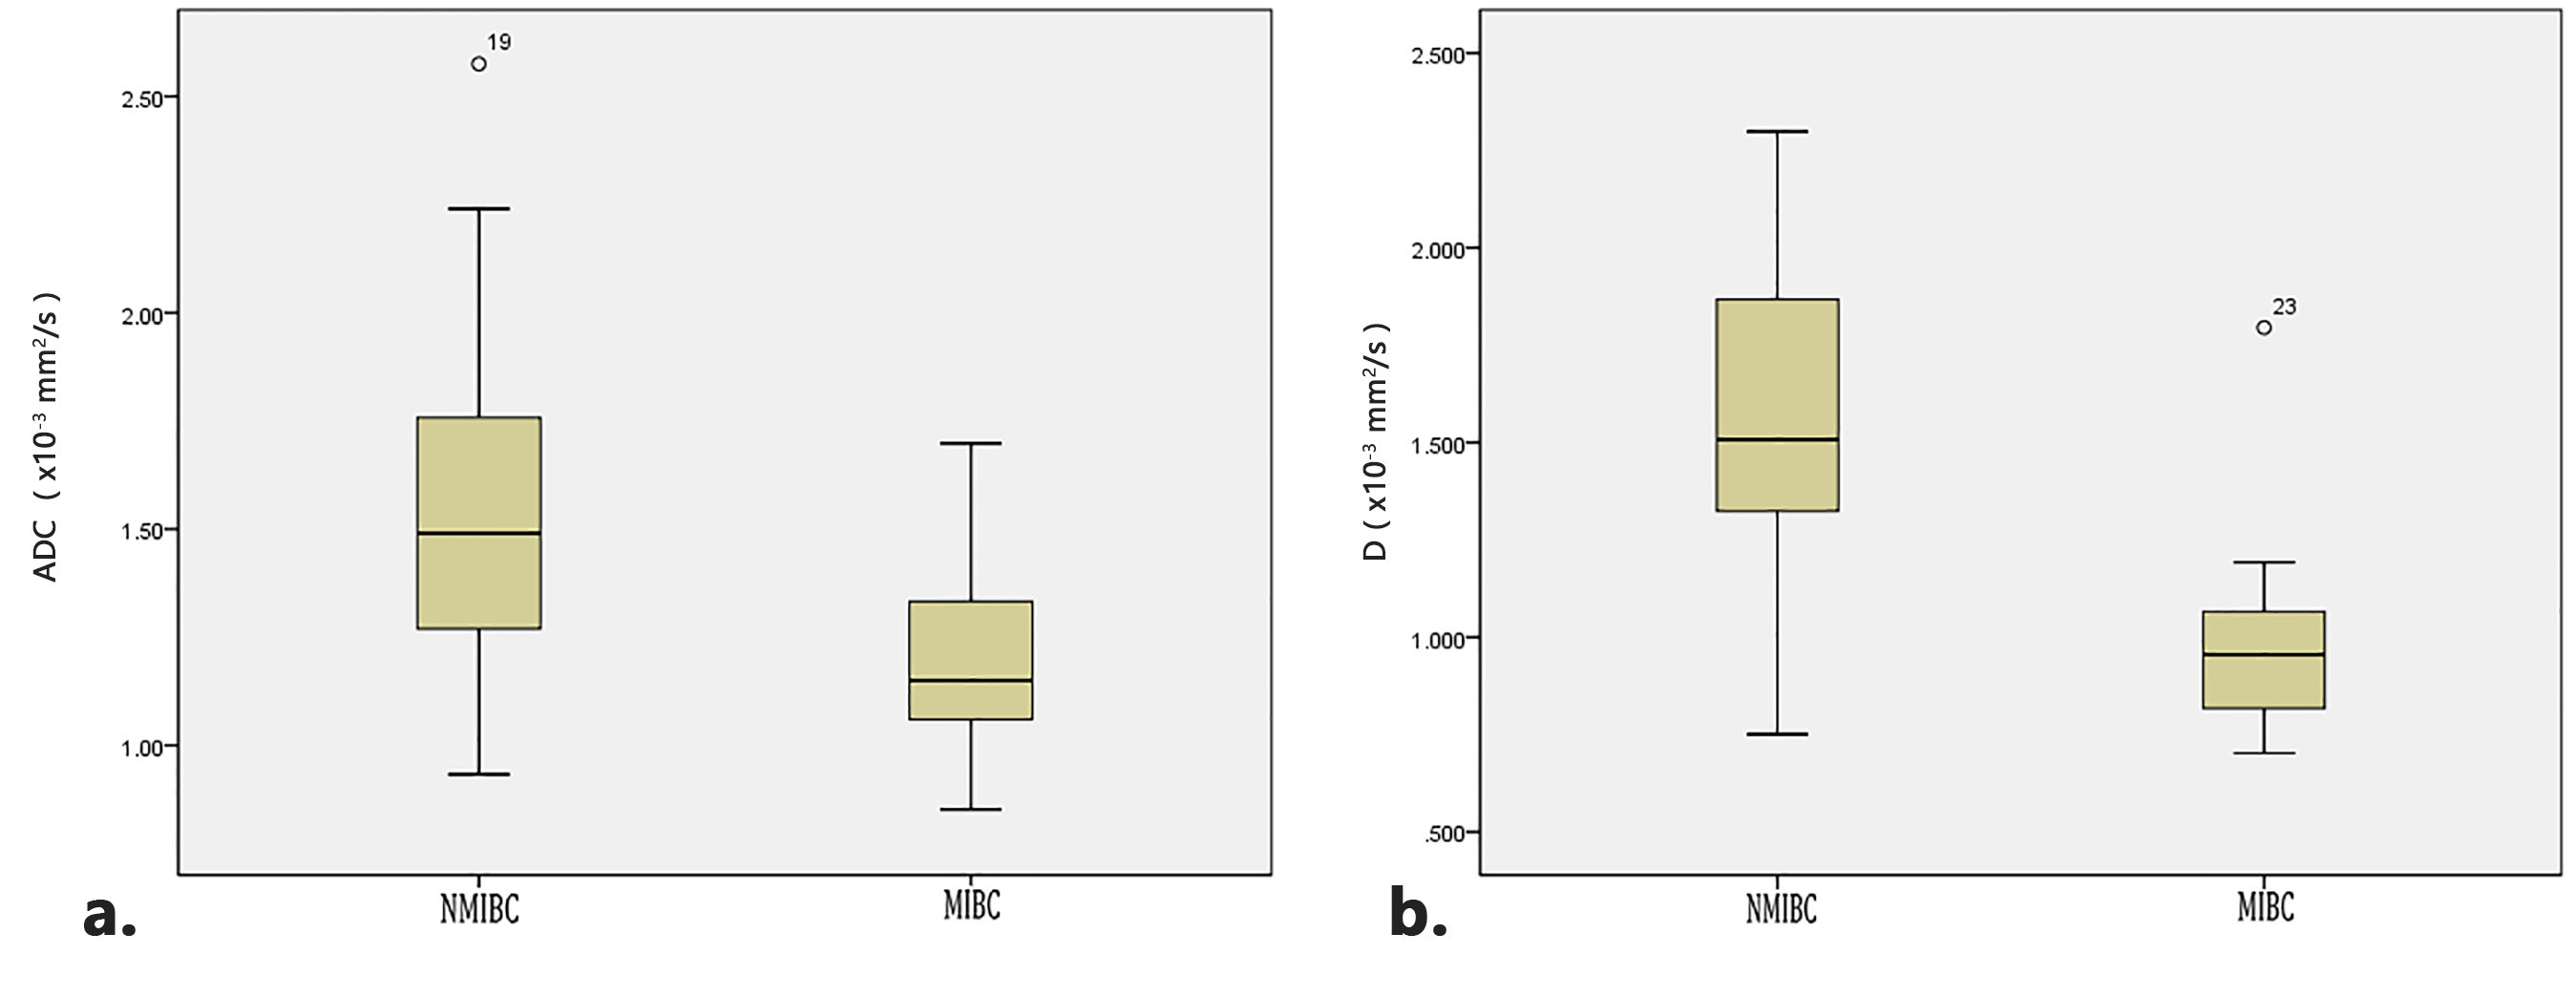
Fig 1. Box-and-whisker plots of ADC values (a) and D values (b) between the NMIBC group and the MIBC group.

Fig 2. Receiver operating characteristic analyses for discriminating NMIBC from MIBC.
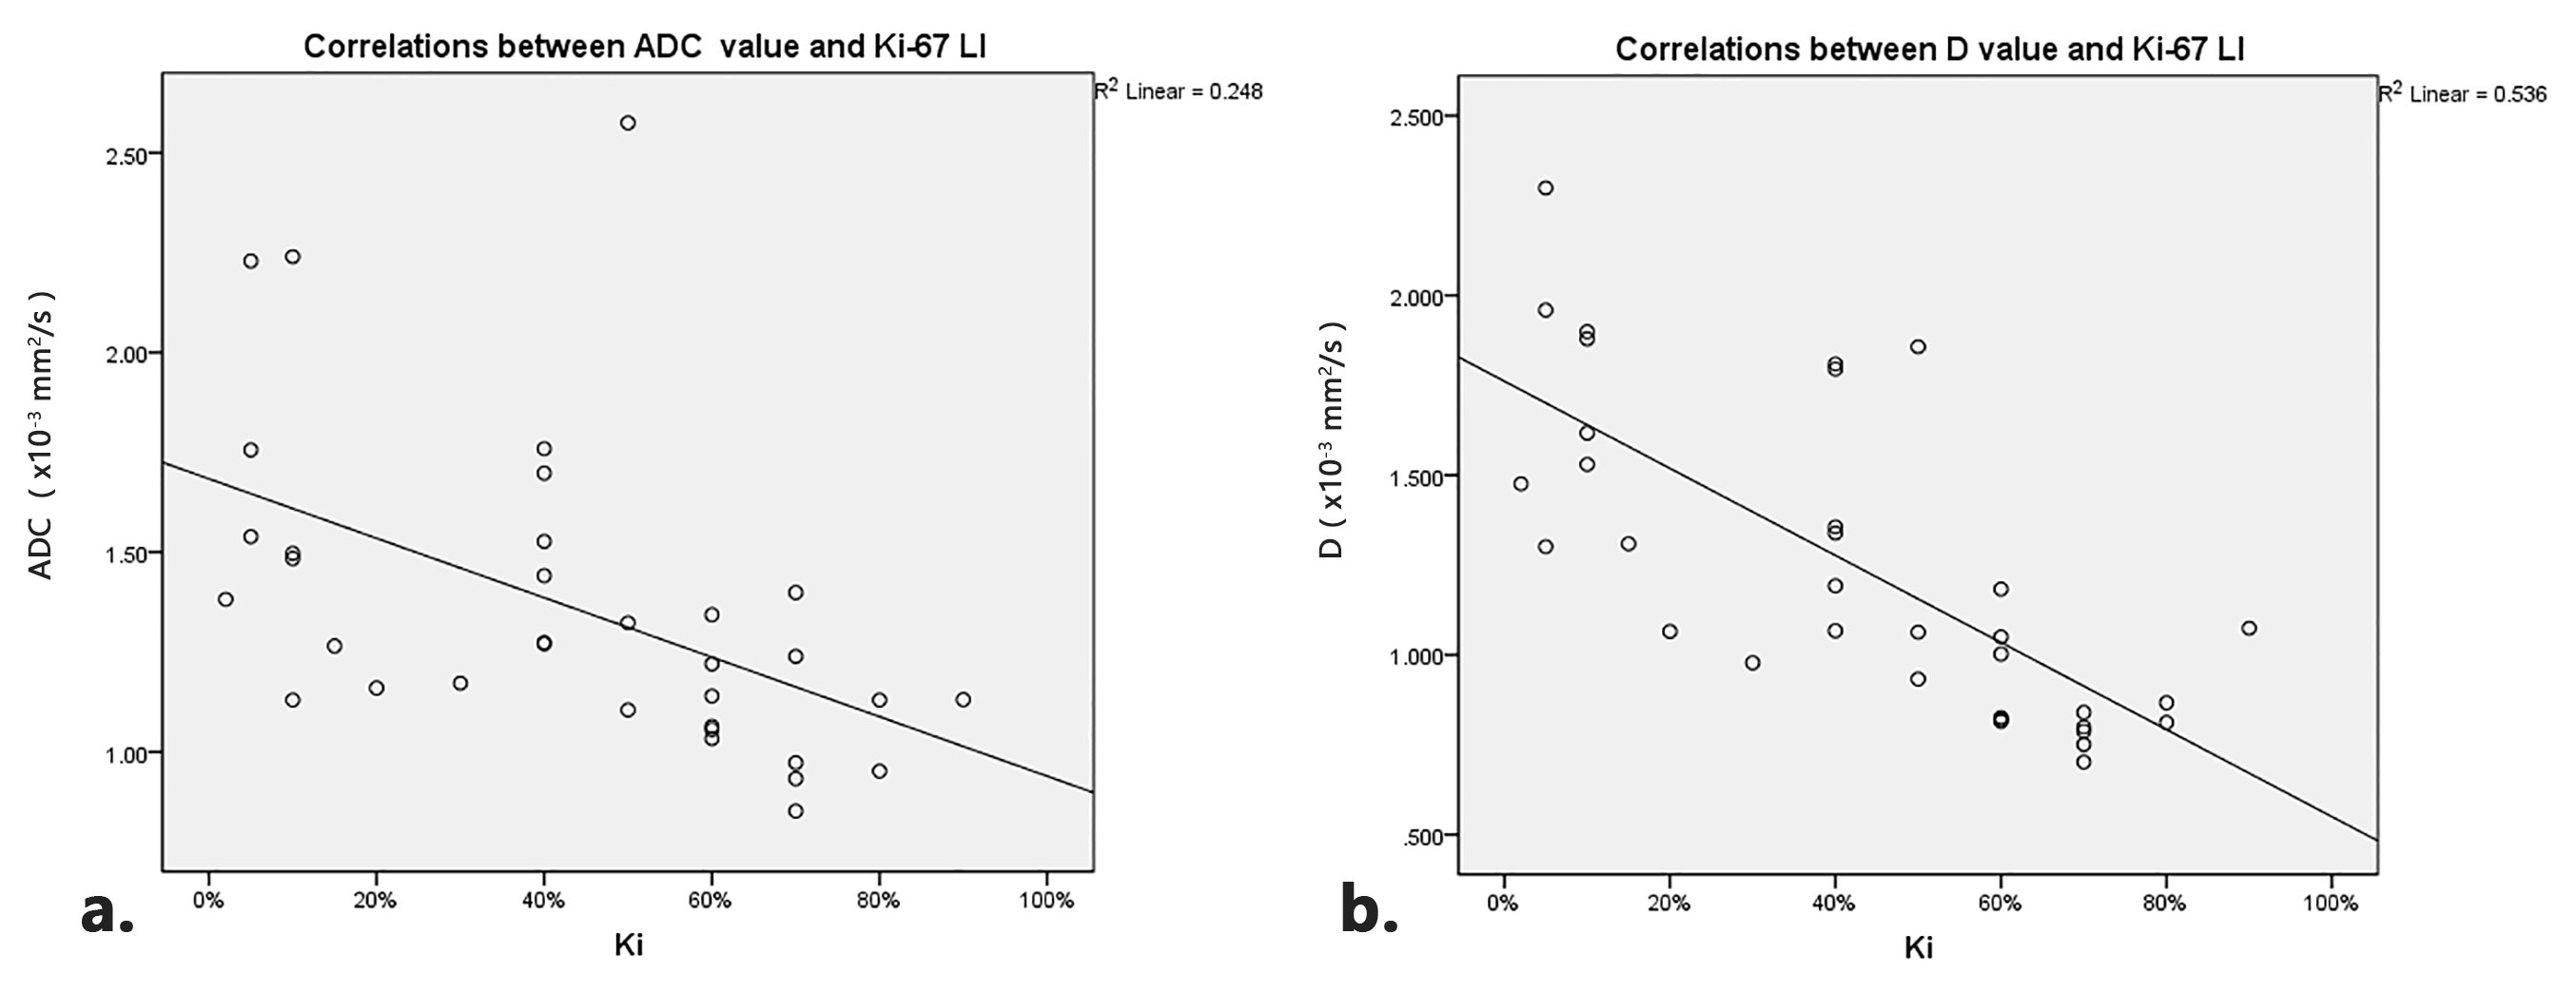
Fig 3. Scatterplots showing significant negative correlations between the ADC value (a), the D value (b) and Ki-67 LI.

Fig 4. Images acquired from a 63-year-old female diagnosed with non-muscle invasive bladder cancer confirmed by pathological findings. (a) Axial T2-weighted image shows an irregular margin on the left posterior bladder wall (arrow). (b-d) D map, D*map and f map of Fig 4a. The bladder wall is intact on the D map. The D value of the tumor is 1.476×10⁻³mm2/s. (e) Ki-67 immunohistochemical staining shows that the percentage of positive cells is 2%.
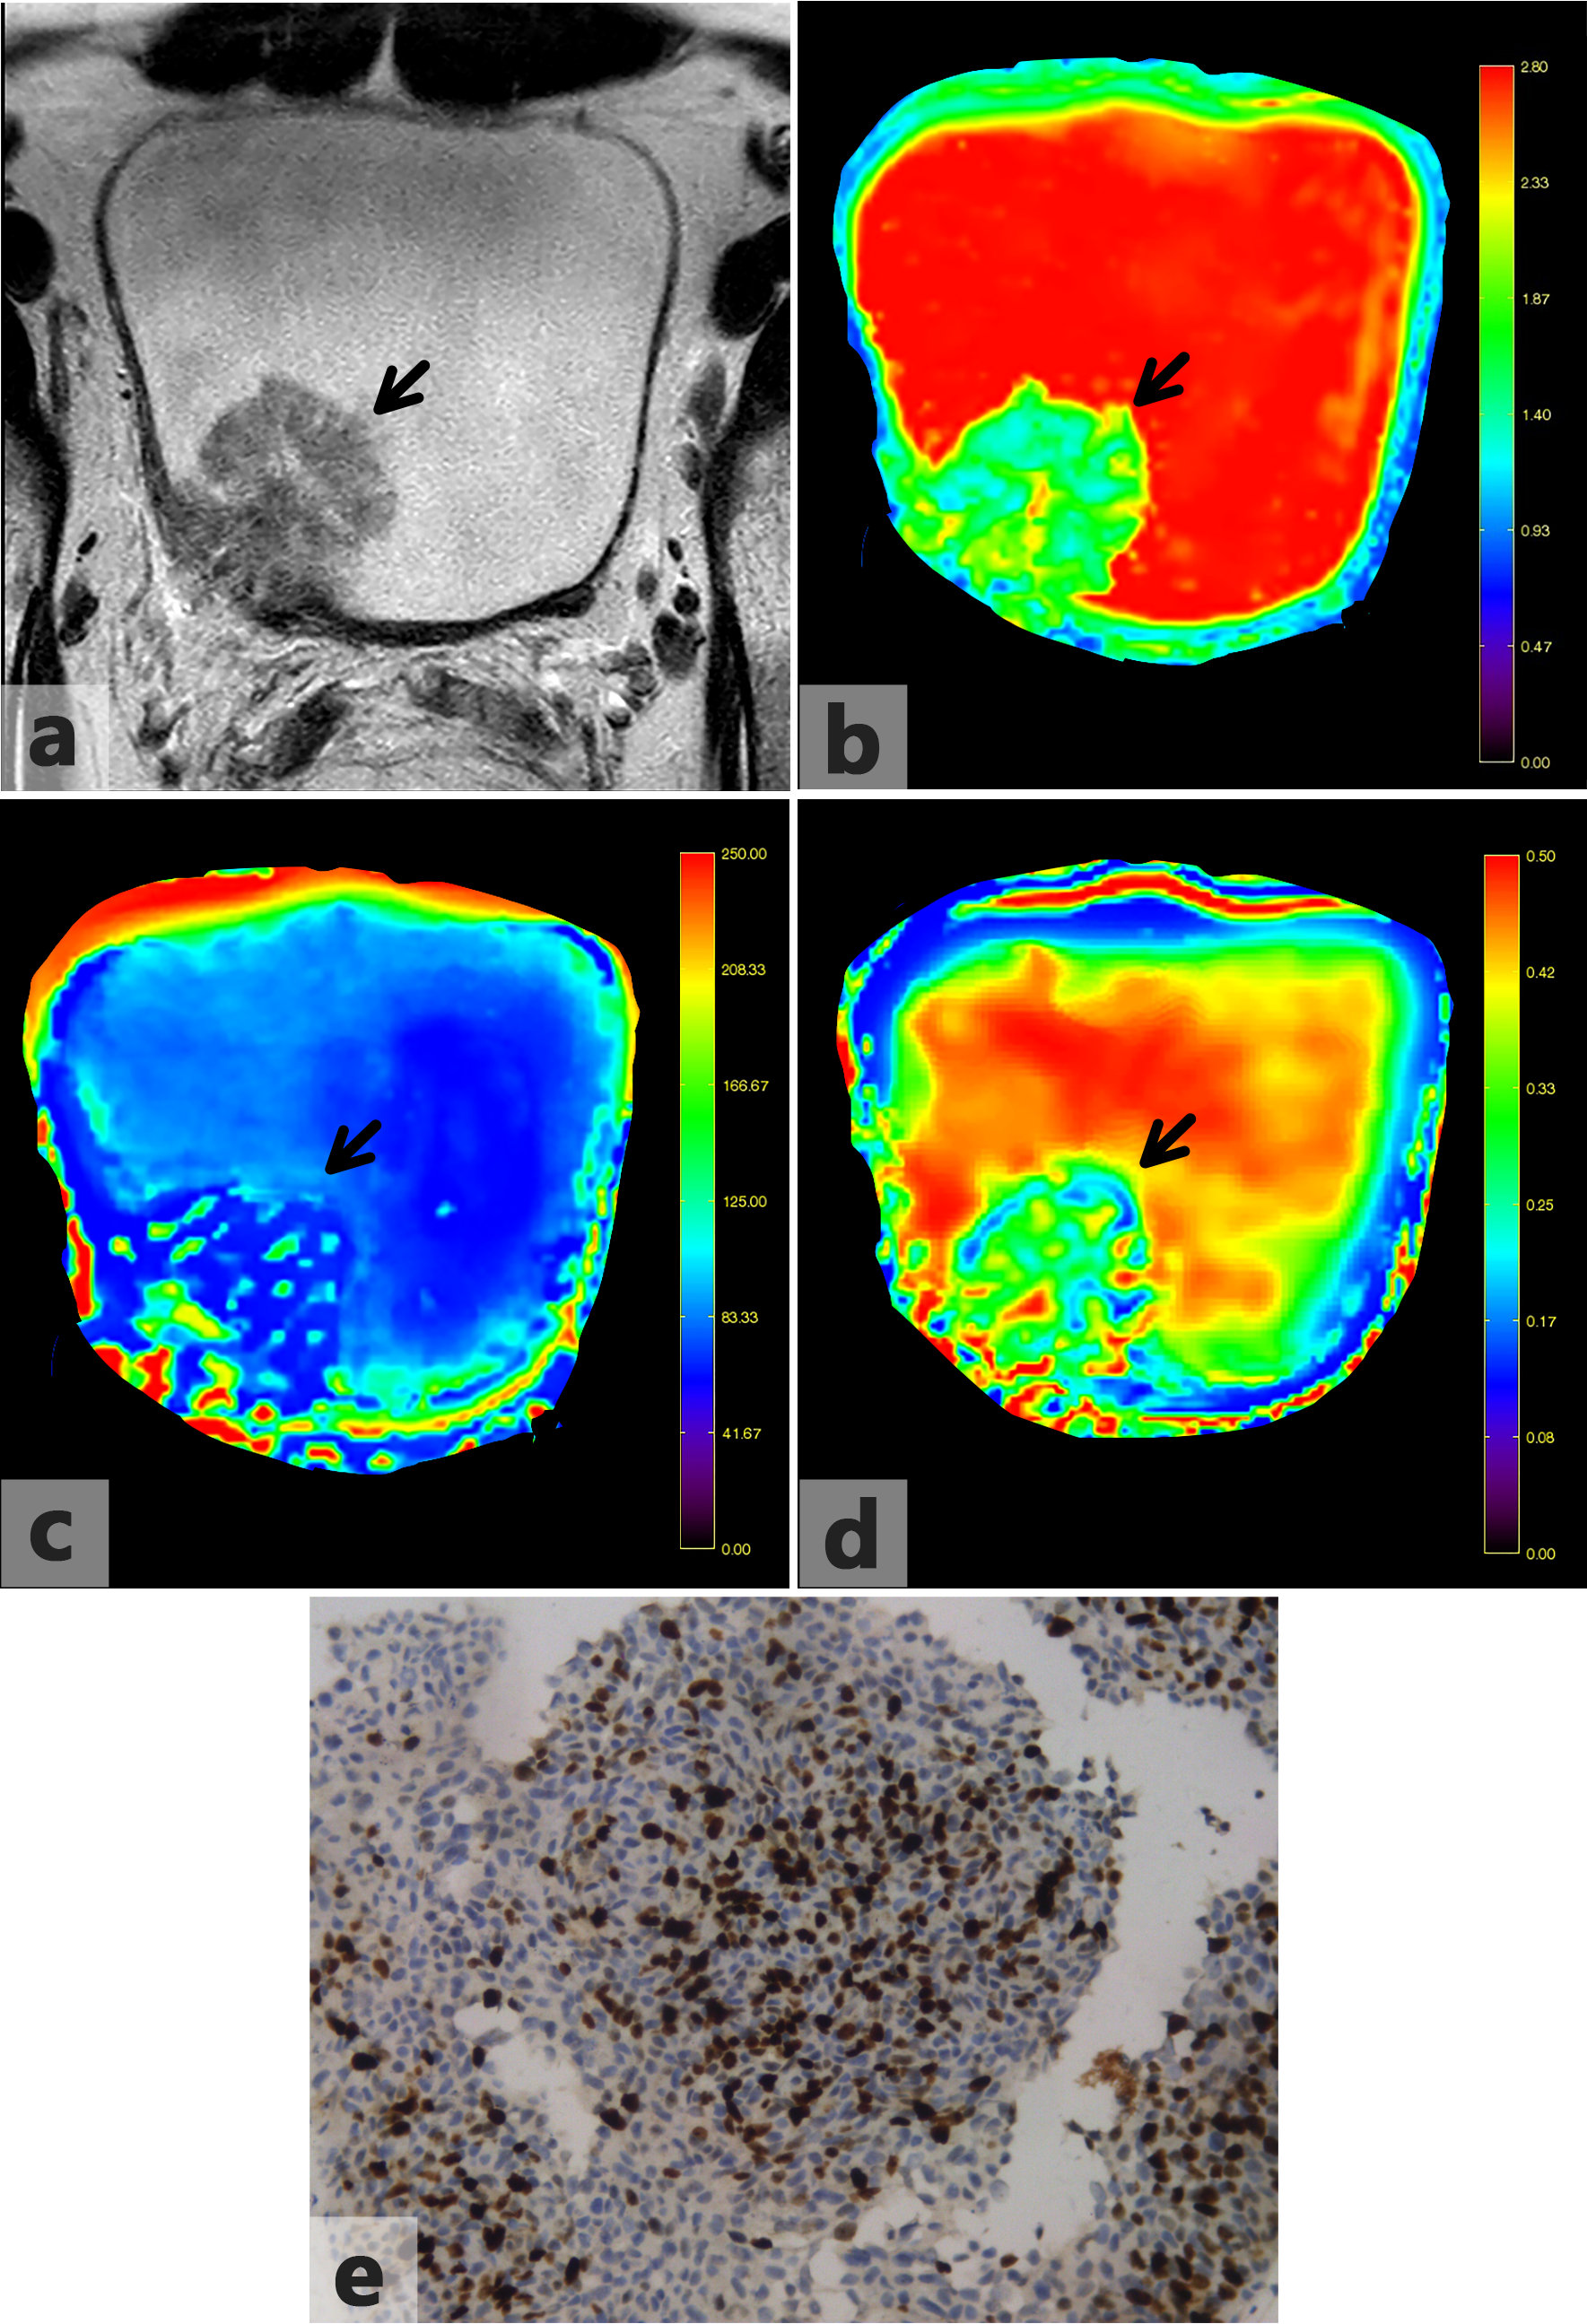
Fig 5. Images acquired from a 38-year-old male diagnosed with muscle invasive bladder cancer confirmed by pathological findings. (a) Axial T2-weighted image shows an irregular margin on the right posterior bladder wall (arrow). (b-d) D map, D*map and f map of Fig. 5a. The bladder wall is disrupted by the tumor on the D map. The D value of the tumor is 1.063×10⁻³mm2/s. (e) Ki-67 immunohistochemical staining shows that the percentage of positive cells is 50%.