1670
DW-MRI in assessment of 3D Cell Culture1Master's Program of Biomedical Informatics and Biomedical Engineering, Feng Chia University, Taichung, Taiwan, 2Department of Automatic Control Engineering, Feng Chia University, Taichung, Taiwan, 3Center for Molecular Medicine, China Medical University Hospital, Taichung, Taiwan, 4Department of Radiology, China Medical University Hospital, Taichung, Taiwan
Synopsis
In extracellular and intracellular space, the Brownian motion of water is restricted by organelles, cellmembranes, and extracellular fibers. DWI is sensitivity to microscopic motion, which is due to Brownian motion of water molecules. In this study, 3D cell culture with hydrogels ECM was used to investigate whether DWI may provide information on these microenvironmental parameters and the microenvironment-associated metastatic propensity of tumors. Our results demonstrated DW-MRI may provide the potential biomarkers on the change of microenvironment in the application of 3D cell culture experiment.
Introduction
Diffusion-weighted imaging (DWI) is sensitivity to microscopic motion, which is due to Brownian motion of water molecules and blood microcirculation1.In extracellular and intracellular space, the Brownian motion of water is restricted by organelles, cellmembranes, and extracellular fibers. Therefore, DWI can provide information on the microstructure and composition of tissues. DWI has been widely applied to the field of tumor diagnosis in clinic2,3. Malignant tumors usually have a higher cellularity and generally present with restricted water diffusion, the ADC values is lower when compared to benign lesions4. The cell culture of provides a powerful platform to monitoring physiology and pathophysiology of cell and tissue in vitro. Recently, 3D cell culture with synthetic extracellular matrix (ECM) has been more widely used instead of the 2D culture platform which been demonstrated that cells behave more natively when cultured in three-dimensional environments5.In this study, 3D cell culture with hydrogels ECM was used to investigate whether DWI may provide information on these microenvironmental parameters and the microenvironment-associated metastatic propensity of tumors.Materials and Methods
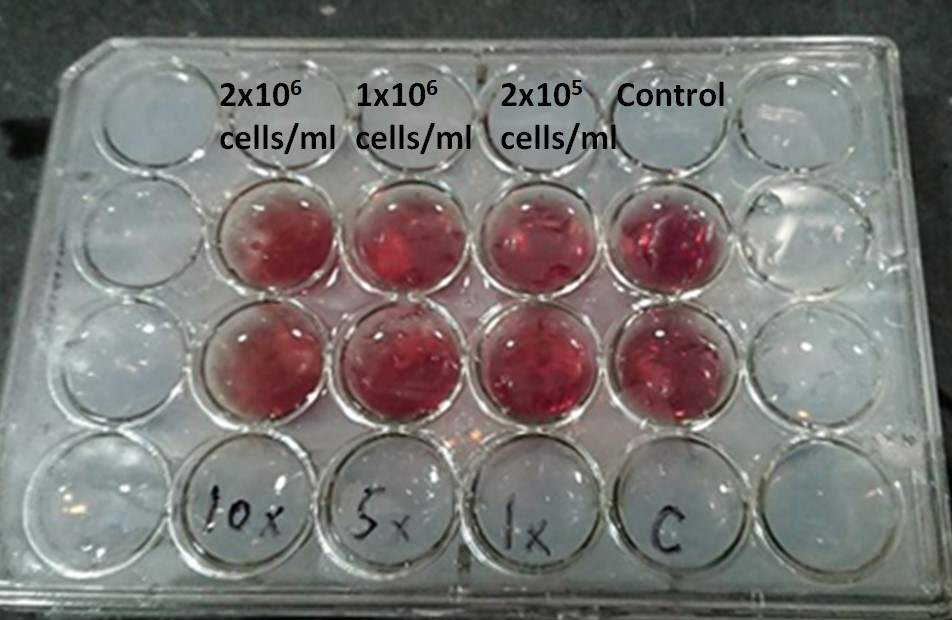
MR scan: All images were performed by a 3 Tesla MR scanner (GE Signa HDx, GE Healthcare, Milwaukee,Wis) using an 8 channels head array coil. DWI images were obtained with motion-probing diffusion gradients (b factors, 0, 500, and 1000 sec/mm2) applied in each of three orthogonal directions. EP-DWI acquisitions (TR/TE/NEX=6000/73.3/4) were performed with 2 acceleration. We used the breast cancer cell line BT474 in our experiments, which cultured in DMEM/F12 (10% fetal bovine serum, 1% P/S, 15mM HEPES Buffer, 2.5mM L-Glutomine, 1.2g/L Sodium Bicarbonate). Cells and culture medium were mixed with 0.3 % agar concentration. One control group (zero cell) and three different cell concentrations (2x10⁵ , 1x10⁶ and 2x10⁶ cells/ml) were filled into 8 wells (Figure 1). To avoid air bubbles influence during MRI scan, we used 2.4% agar to fill all holes in 24-well plate. Data analysis: All MR data were digitally transferred from the MR unit console to a personal computer and processed with software developed in house by using Matlab (MathWorks, Natick, MA). ADC maps were generated by using a pixel-by-pixel computation according to the following logarithmic equation: ADC = ln(SI0/SIx)/(bx - b0), where SI0 was signal intensities of the DWI obtained with b values of 0 sec/mm2 (b0) and SIx was b = 500 (b000), or 1000 sec/mm2 (b1000), respectively. Mean ADCs of all pixels within ROI were calculated for comparison among different cell density.Result
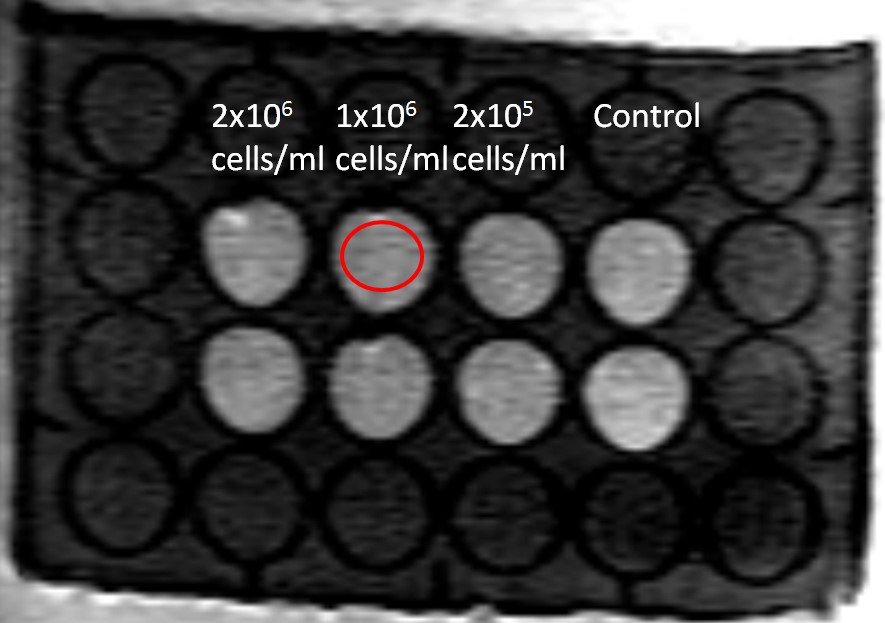
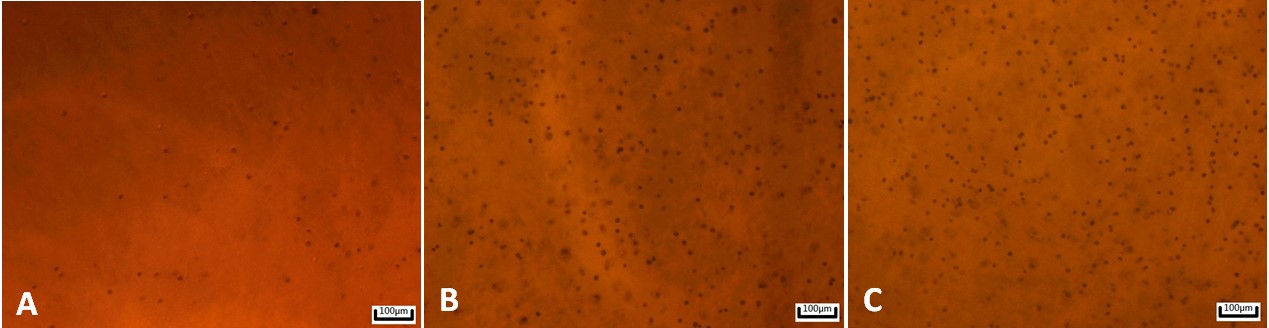
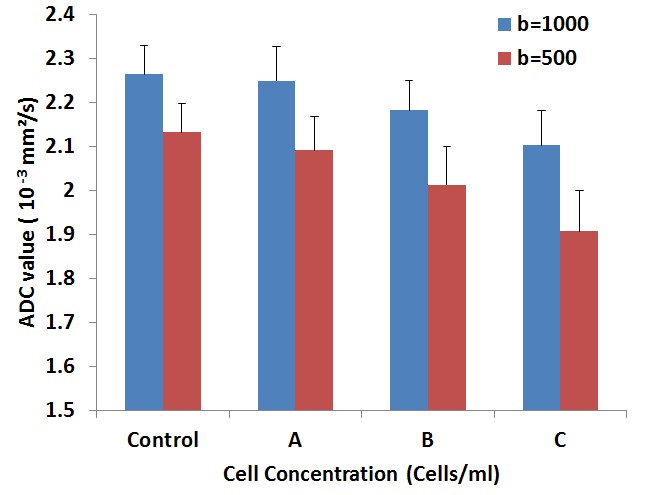
A 3D cell culture with control, 2x10⁵, 1x10⁶, and 2x10⁶ cells/ml in 24-well dish was shown on Figure 1. Figure 2 illustrated the DWI of 3D cell culture and the selected ROI on one well. The microscopic photos in the wells of 2x10⁵, 1x10⁶, and 2x10⁶ cells/ml were showed on Figure 3. ADC of different cell density measured mean and SD by b=500 and b=1000 were illustrated on Figure 4. The ADCs measured by b=1000 were 2.264 ± 0.065 (10-3 mm2/s), 2.250 ± 0.078 (10-3 mm2/s), 2.182 ± 0.069 (10-3 mm2/s), and 2.103 ± 0.078 (10-3 mm2/s), for control, 2x10⁵, 1x10⁶, and 2x10⁶ cells/ml, respectively. The ADCs measured by b=500 were 2.132 ± 0.065 (10-3 mm2/s), 2.091 ± 0.078 (10-3 mm2/s), 2.013 ± 0.086 (10-3 mm2/s), 1.907 ± 0.092 (10-3 mm2/s), for control, 2x10⁵, 1x10⁶, and 2x10⁶ cells/ml, respectively.Discussion
In this study, 3D cell cultures with different cell density were created to evaluate the capability of DWI in the application of 3D cell culture experiment. Due to the thick layer, it is difficult to monitor the cell growth layer by layer using microscopy in the 3D cell culture experiment. Our results showed that ADC was a negative correlation with cell concentration and the differences between b=500 and b=1000 were increased with high cell density. The reason might be the water diffusion is reduced because of smaller extracellular space.Conclusion
DW-MRI may provide the potential biomarkers on the change of microenvironment in the application of 3D cell culture experiment.Acknowledgements
The study was supported partly from the Ministry of Science and Technology, R. O. C. under the Grant No. MOST 105-2221-E-035 -049 -MY2.References
1. D. Le Bihan, E. Breton, D. Lallemand, M.L. Aubin, J. Vignaud, M. Laval-Jeantet Separation of diffusion and perfusion in intra-voxel incoherent motion MR imaging Radiology, 168 (1988), p. 497
2. Bonekamp S, Corona-Villalobos CP, Kamel IR: Oncologic applications ofdiffusion-weighted MRI in the body. J Magn Reson Imaging 2012, 35:257–279.
3. Li SP, Padhani AR: Tumor response assessments with diffusion andperfusion MRI. J Magn Reson Imaging 2012, 35:745–763
4. Donati OF, Afaq A, Vargas HA, Mazaheri Y, Zheng J, Moskowitz CS, Hricak H, Akin O. Prostate MRI: evaluating tumor volume and apparent diffusion coefficient as surrogate biomarkers for predicting tumor Gleason score. Clin Cancer Res. 2014 Jul 15;20(14):3705-11.
5. Horibata S, Vo TV, Subramanian V, Thompson PR, Coonrod SA. Utilization of the Soft Agar Colony Formation Assay to Identify Inhibitors of Tumorigenicity in Breast Cancer Cells. J Vis Exp. 2015 May 20;(99):e52727.
Figures