1668
Automated fibre quantification predicts early Wallerian degeneration of the CST after acute ischemic stroke1Shaanxi provincial people`s hospital, Xi’an, China, 2Department of neurology, Shaanxi provincial people`s hospital, Xi’an, China, 3Philips Healthcare, Beijing, China
Synopsis
This study aimed to observe the microstructural alterations in corticospinal tract (CST) after motor pathway infarction and predict early Wallerian degeneration based on automated fiber quantification (AFQ). 53 patients with first-onset stroke in motor pathway and 29 health age-matched controls were enrolled. FA, MD, AD and RD values were significantly reduced on lesions of the affected side, while DKI values (MK, AK and RK) exhibited significant increase. AFQ was performed to identify differences on the whole CST pathway in the affected side between control and patient group. AD and MD values in CST of the affect side were significantly higher than them in healthy control. The findings of AD and MD have the same pathological changes on the affected CST pathway no matter the primary stroke lesions located in any regions (brainstem, posterior limb of internal capsule or above centrum semiovale). Our findings suggest that AFQ has the potential to detect the early Wallerian degeneration in the central nervous system in vivo after the first 24 hours in stroke.
Introduction
Degeneration of the distal parts of nerves after injury to the proximal axon or cell body is referred to as Wallerian degeneration (WD), which occurs in both peripheral and central nervous systems. WD is classically divided into retrograde and anterograde degeneration. Evidence of early WD of corticospinal tract (CST) after stroke would be of great value to assess the prognosis and rehabilitational potential of stroke patients. Unfortunately, Conventional magnetic resonance imaging is generally not detected signal intensity until 1 month after stroke. However, AFQ is a tractography technique that permits the reconstruction of the whole white matter tract bundles, which are obtained structural integrity degree of tissue characteristics along the length of white matter tract bundles. The purpose of this study is to evaluate whether AFQ can sensitively detect changes in diffusion properties that are reflective of early WD in the CST within the first 24 hours after stroke, and to test whether different location lesions may also have different manifestations depending upon white matter architecture and direction in the affected side.Methods
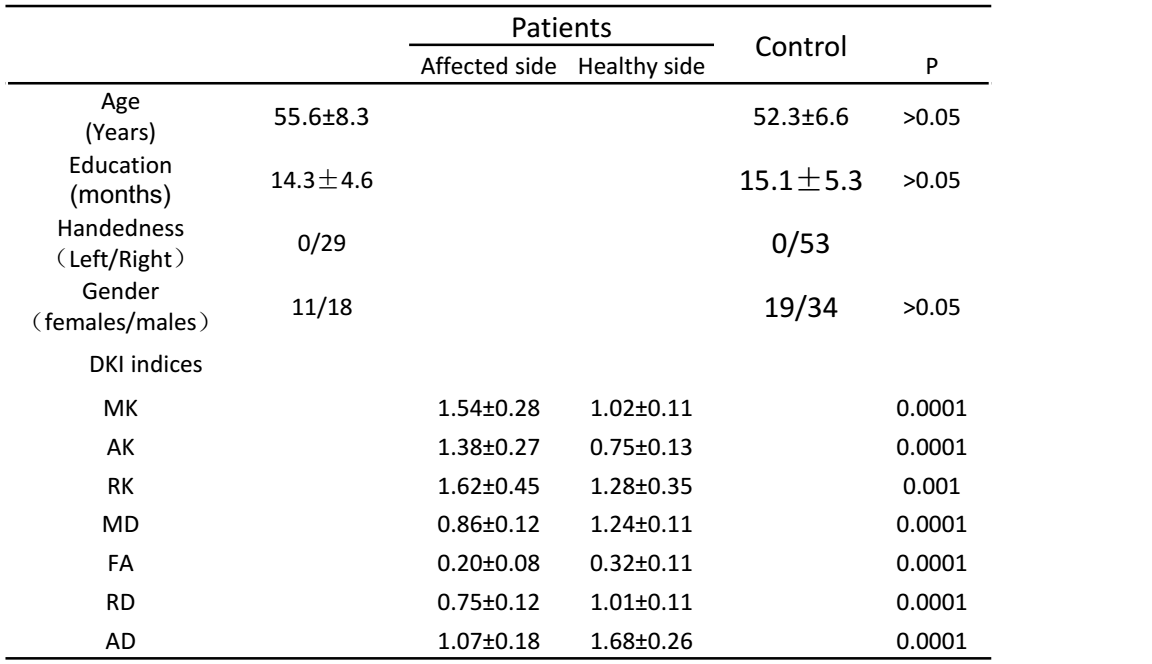
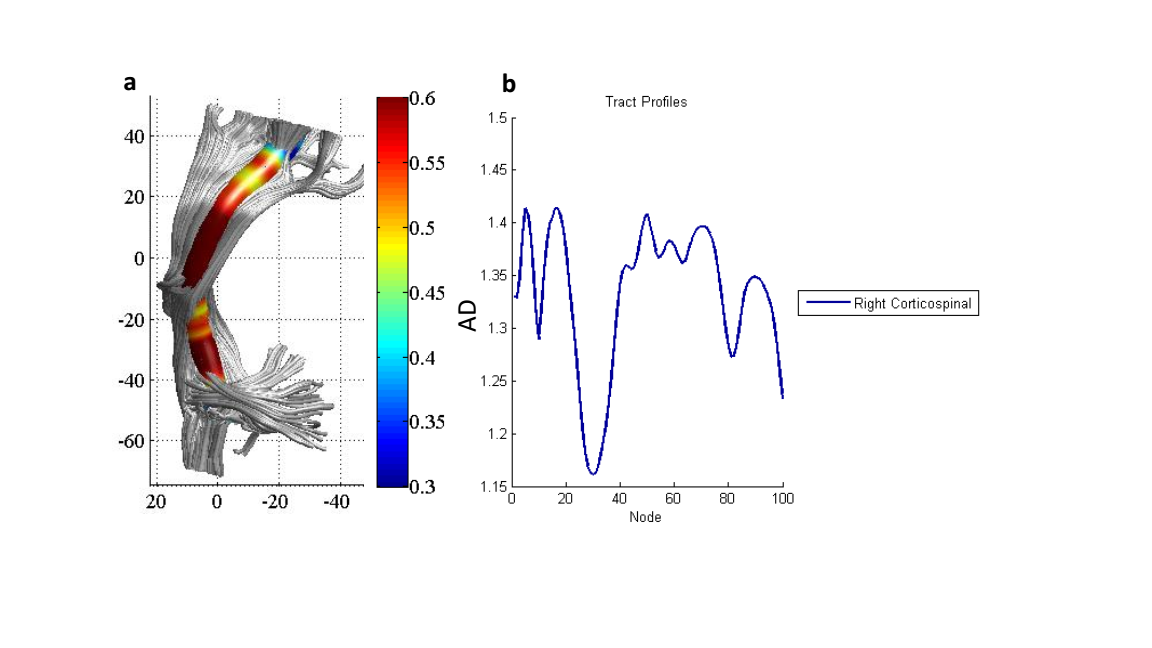
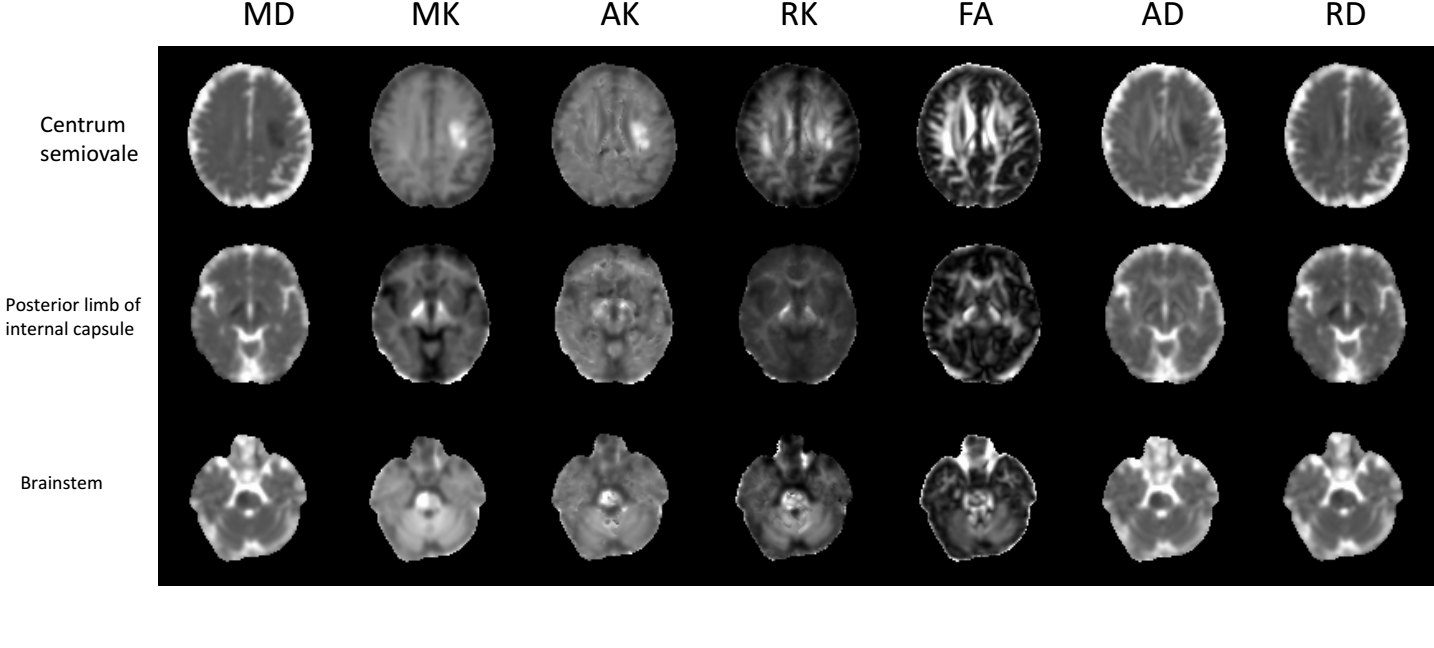
Twenty-nine health age-matched control (age 52.3±6.6 years) and Fifty-three patients (age 55.6±8.3 years) with motor pathway infarction were recruited from the inpatient and outpatient services,8, 18, 30 lesions were included in brainstem lesions, posterior limb of internal capsule and above centrum semiovale,respectively. Clinical details of all subjects were given in Table 1.All patients were first-onset stroke and manifested motor deficits. Patients with a history of any other neurological or psychiatric disorders were excluded. All subjects underwent MRI on 3.0T scanner (Ingenia, Philips Healthcare,The Netherlands),including routine sequences and DKI. DKI sequences were acquired with 3 b-values (0,1000 and 2000s/mm2) along 30 diffusion encoding directions with following parameters: TR/TE:2440/83ms, FOV=224x224mm2, acquisition matrix=112×112,image resolution=2.5×2.5x2.5mm3, acceleration factor=3, slice thickness=5 mm (no gap), acquisition time approximately 15 minutes. Image analysis: For the DKI data ,motion and eddy current correction were processed with FMRIB Software Library (FSL, Oxford, United Kingdom). The post process was performed on DKI Toolbox software in MATLAB, Lesions of the DKI were calculated on ROIs basis. Parametric maps for DKI were subsequently obtained. DKI images was processed with the AFQ image analysis pipeline (https://github.com/jyeatman/AFQ).AFQ performed a series of automated steps, including additional motion correction for each of the individual diffusion weighted images and voxel-wise estimation of the diffusion tensor.We computed the eigenvalue decomposition of the diffusion tensor and the resulting eigenvalues were used to compute the FA, MD,RD and AD. The tract FA,MD,RD and AD profiles fed into voxel-wise cross-subject statistics to identify differences on CST between normal group and WD group in affected side (Fig. 1). we used a paired samples t test to compare the DKI indices of the CSTs between the affected and unaffected sides in patients .All tests were taken to be significant at p<0.05.Results
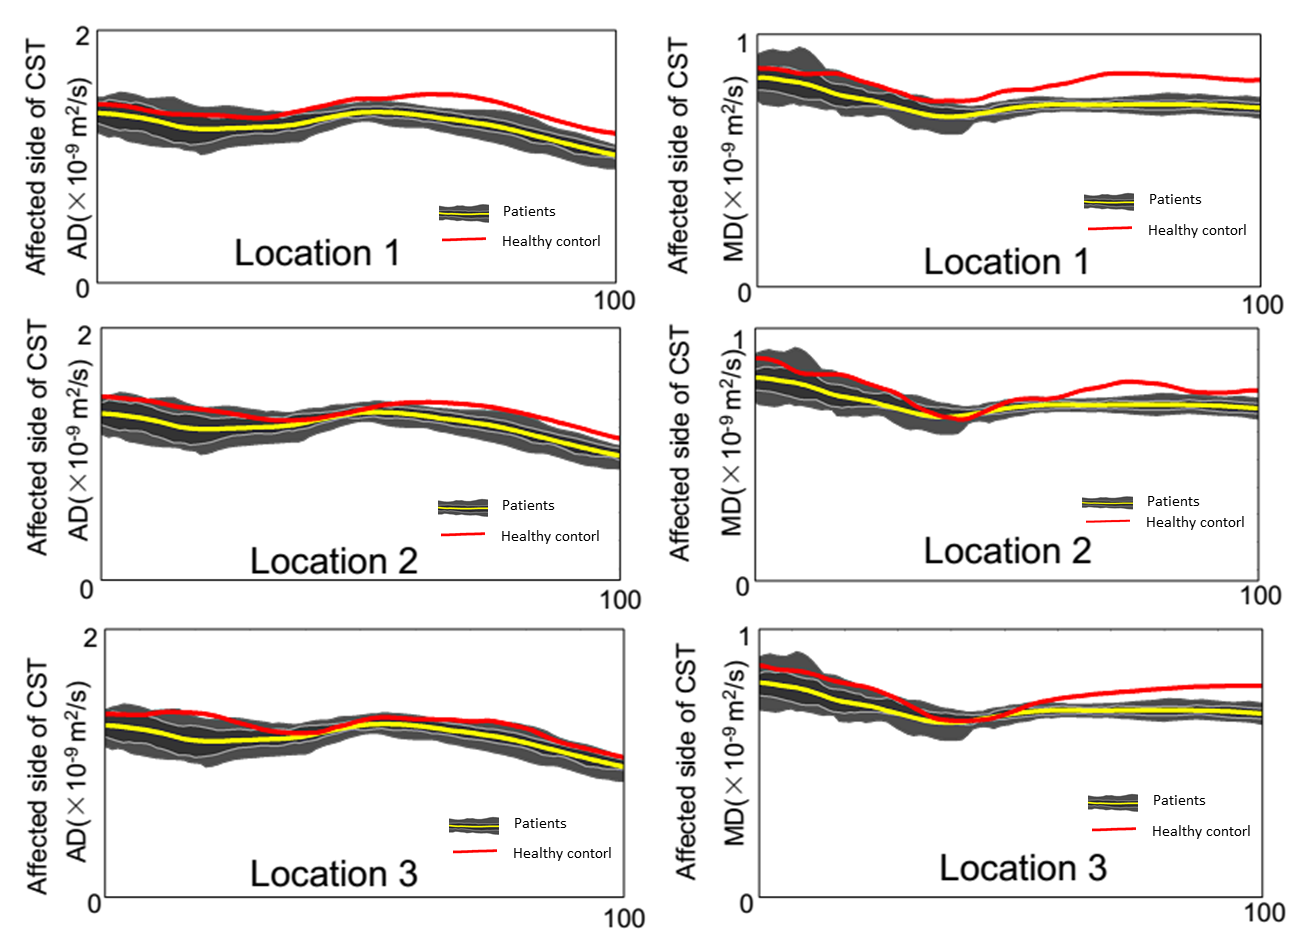
Table 1 shows the DKI indices in the affected side in stroke lesion and the healthy side at the onset of patients,MD,FA,RD and AD were markedly reduced on lesions in the affected side, DKI values revealed significant increase in lesion compared with those healthy side (Fig. 2). At MR imaging, the AFQ metrics (FA,MD,AD,RD) with healthy control were not significantly different between left and right CST. AD and MD values of affect side in CST tract characteristics were significantly higher than healthy control (P<0.05). The findings of AD and MD have the same pathological changes on the affected CST pathway in different lesions (Fig.3). At the same time,FA and RD values did not reveal obvious changes on the affected CST pathway in different lesions.Disussion
This study demonstrated that descending motor pathway on different location lesions exist retrograde and anterograde degeneration. The whole Tract AD and MD Profiles of CST were increased with motor pathway subcortical different location infarction. The finding suggest that axonal degeneration was characterized by a swollen and vacuolar axons at first 24 hours after stroke. Then,the myelin sheaths that surround the axons become less tightly wrapped and eventually break apart forming voids. This study confirms that AFQ indices are sensitively revealed to pathological early changes on affected side CST degeneration. Our results confirmed that DKI indices are sensitive to pathological changes and microstructural complexity in stroke. We have demonstrated the sensitivity of AFQ in detecting individual diffusion abnormalities and the potential relevance of these specific structural alterations, which may represent a significant step forward in the clinical translation of advanced neuroimaging techniques for predicting early WD after stroke.Conclusion
AFQ has the potential to find the early WD in the central nervous system in vivo after acute stroke. The assessment of fiber degeneration with AFQ appears to be a promising tool for studying human neuroanatomy noninvasively in vivo.Acknowledgements
The authors would like to thank Philips Healthcare for their technical assistanceReferences
1.Waller, A.Experiments on the section of the glossopharyngeal and hypoglossal nerves of the frog and observations of the alternatives produced thereby in the structure of their primitive fibres. Philos. Trans. R Soc. Lond. 1850;140, 423-429. 2.Yeatman JD, Dougherty RF, Myall NJ, et al.Tract profiles of white matter properties: automating fibre-tract quantification. PLoS One 2012; 7: e49790. 3.Conforti L, Gilley J, Coleman M P. Wallerian degeneration: an emerging axon death pathway linking injury and disease[J]. Nature Reviews Neuroscience, 2014;15(6):394.Figures