1666
Tractography based parcellation of the frontal lobe: reproducibility & functional significance.1BCBlab, Institut du Cerveau et de la Moelle, Paris, France
Synopsis
Dividing the brain based on structural connectivity is a challenge that we circumvented using the principal component analysis framework. By doing so, we reliably divided the frontal lobe into 12 areas across datasets and participants. Additionally, these areas showed neat functional specificity as defined by functional magnetic resonance imaging.
Introduction.
Examining the nature of the local input and output using diffusion weighted imaging tractography (i.e. tractography-based parcellation) has emerged as one of the best solutions to segregate functional areas 1-3. However, the application of this method on large brain areas has proven to be problematic due to difficulties in estimating the number of subregions to be identified prior to their division. Additionally, tractography-based parcellation reproducibility remains to be assessed across datasets and individuals. Finally, functional specificity of the identified areas has to be formally tested. Here, we combined diffusion weighted imaging tractography based on Qball imaging 4 with the principal component analysis (PCA) statistical framework to segregate functional areas of the whole left frontal lobe in two independent datasets. Further, we used a database of meta-analysis of functional MRI studies using the method described by 5 (http://neurosynth.org) to confirm the functional segregation across the regions identified.Material and methods.
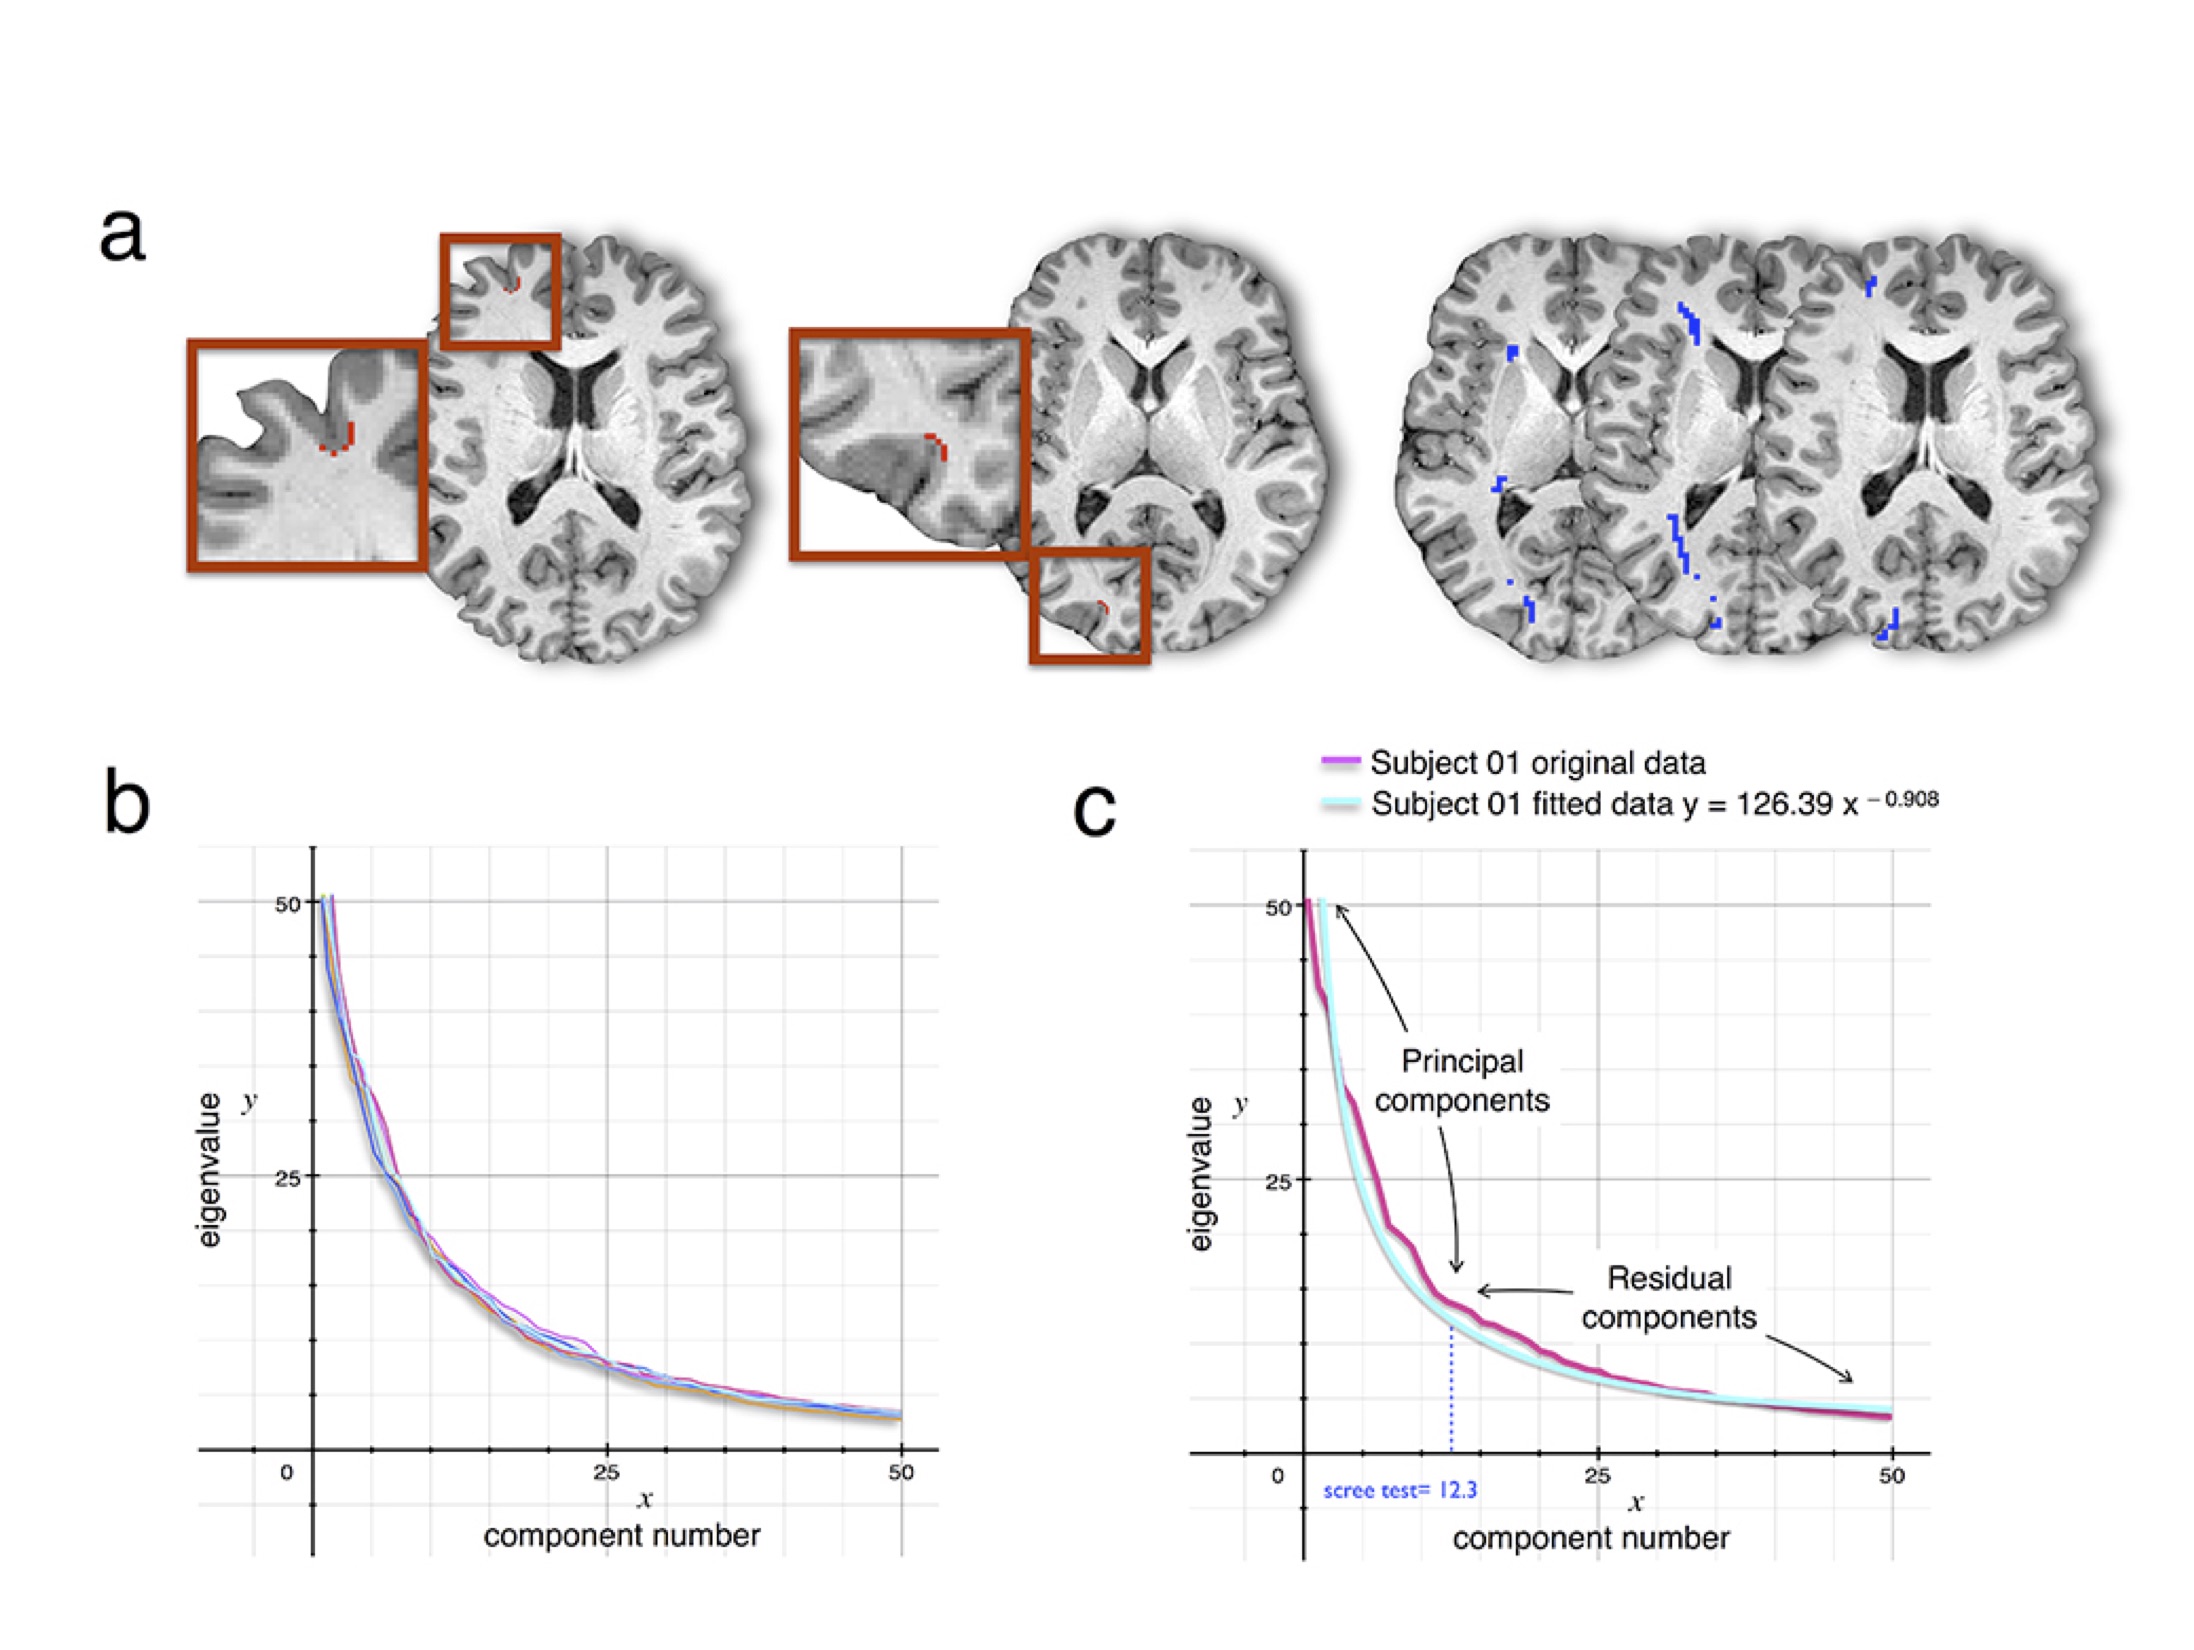
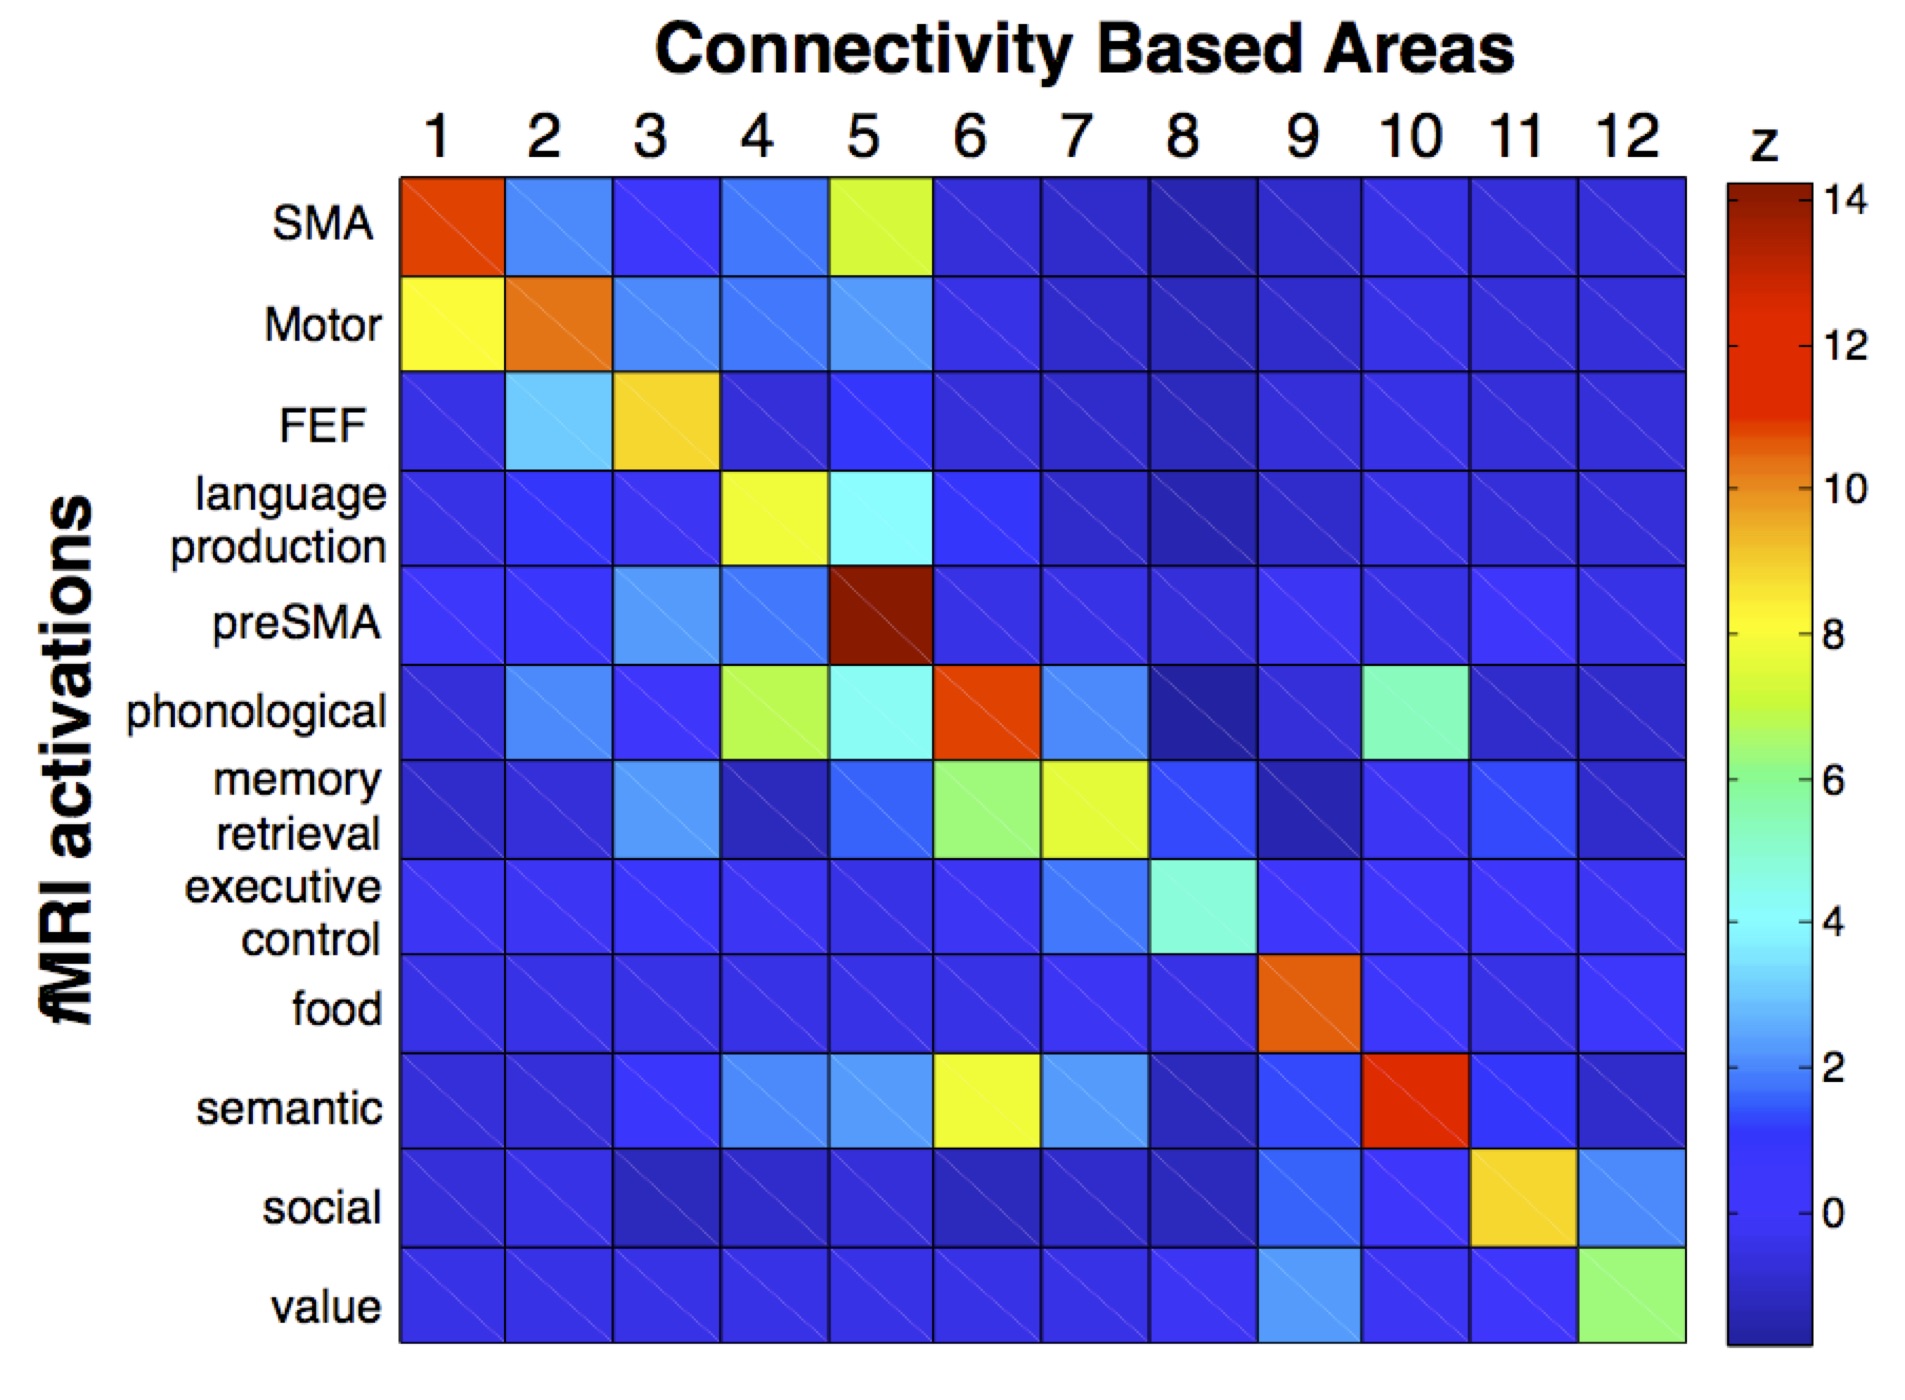
T1w imaging (0.7×0.7×0.7mm) and Diffusion weighted imaging (DWI, 18 B0, 90x3 dir.; bval=1000, 2000, 3000mm−2; 1.25mm3) were obtained from 12 healthy controls (2 males and 10 females; 26 to 35 year-old) from the Human Connectome Project (HCP) (www.humanconnectome.org). T1w imaging (1mm3) and DWI (6 B0, 60 dir., bvalue = 1500 mm−2; 2×2×2mm) were additionally gathered from 47 right-handed volunteers (24 males and 23 females ±14.79 years). Data was pre-processed using the default HCP pipeline (V.2). A tractography algorithm based on Qball imaging (20,000 samples, step length 0.5 mm, curvature threshold of 0.2) optimized for multishell 4 was used to propagate streamlines from ‘seed’ (in the frontal lobe) to ‘target’ (in the whole left hemisphere) regions of interest (ROIs) situated in the white matter that was the closest to the grey matter. For each participant, a ‘connectivity’ matrix between frontal ROIs (seeds) and each other ROI of the ipsilateral hemisphere (targets) was derived from the results of the probabilistic tractography 6. PCA was performed using SPSS software as previously described (Fig1) 7 Functional segregation across the connectivity based regions (CBR) identified was further investigated using the decode tool provided in Neurosynth (neurosynth.org). Each region was compared to functional activations related to 2912 different terms. The result was subsequently converted into Z-score in order to reveal the function most likely activated in the CBRs.Results.
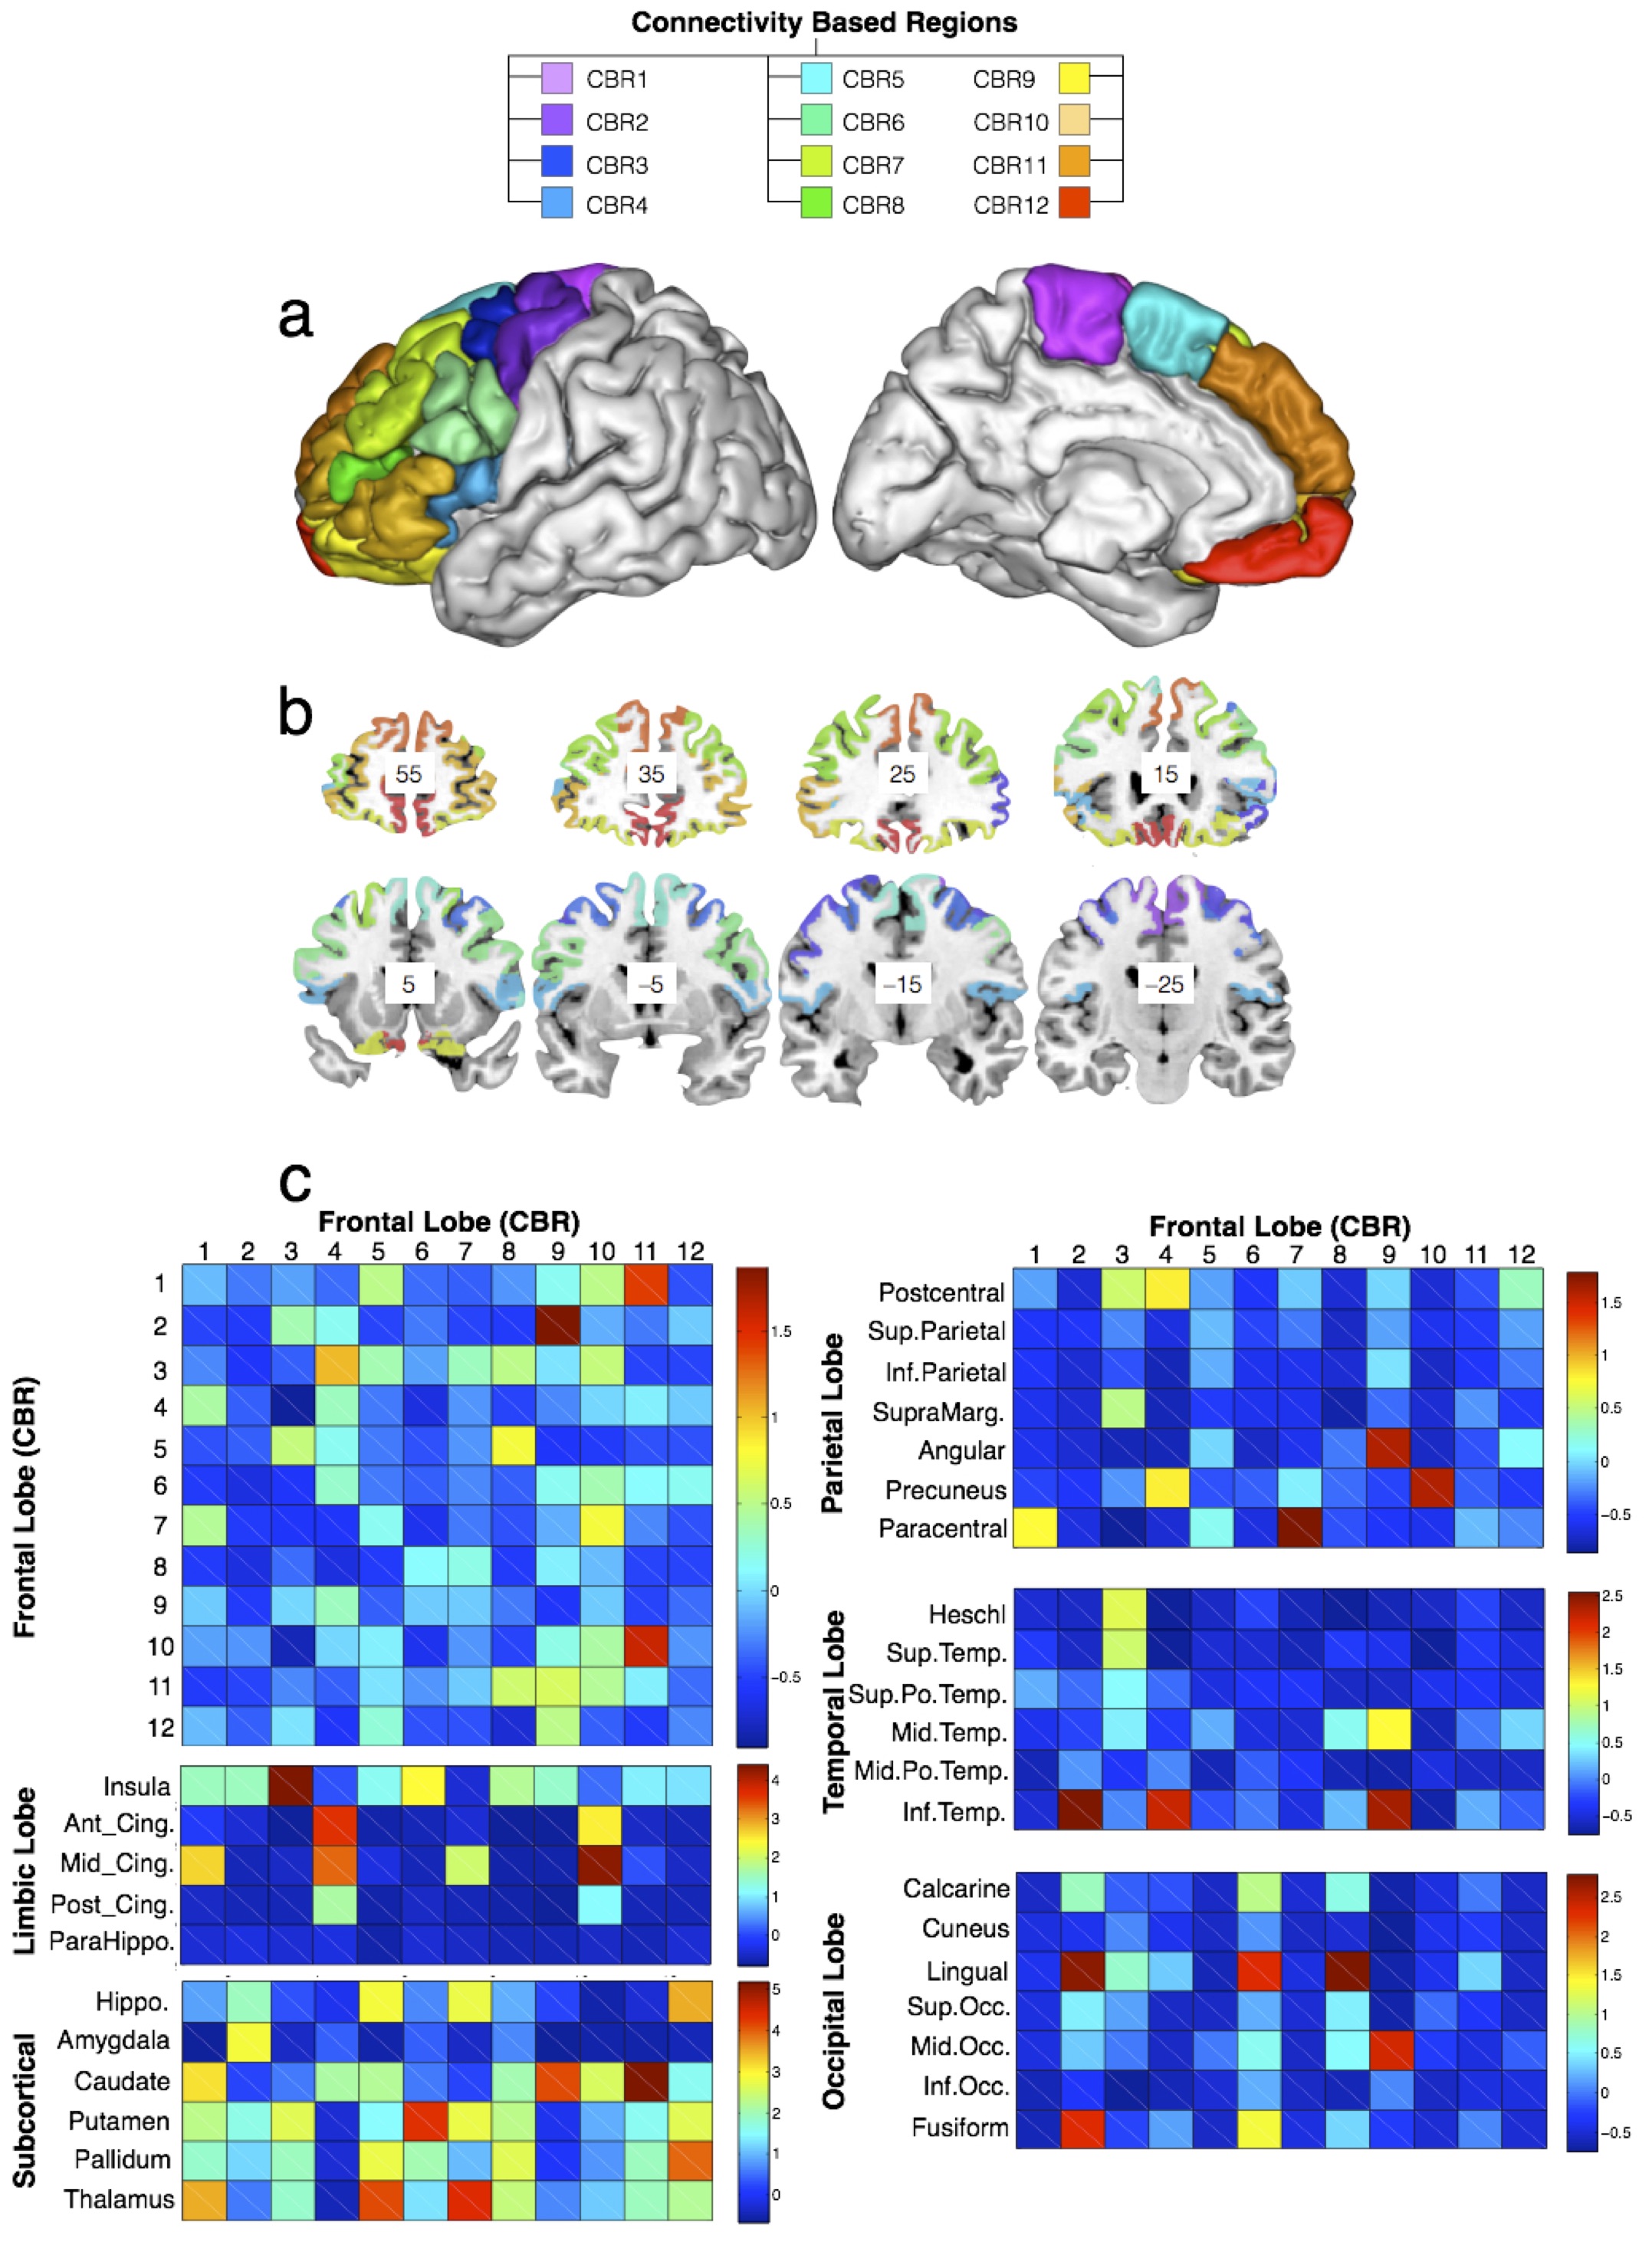
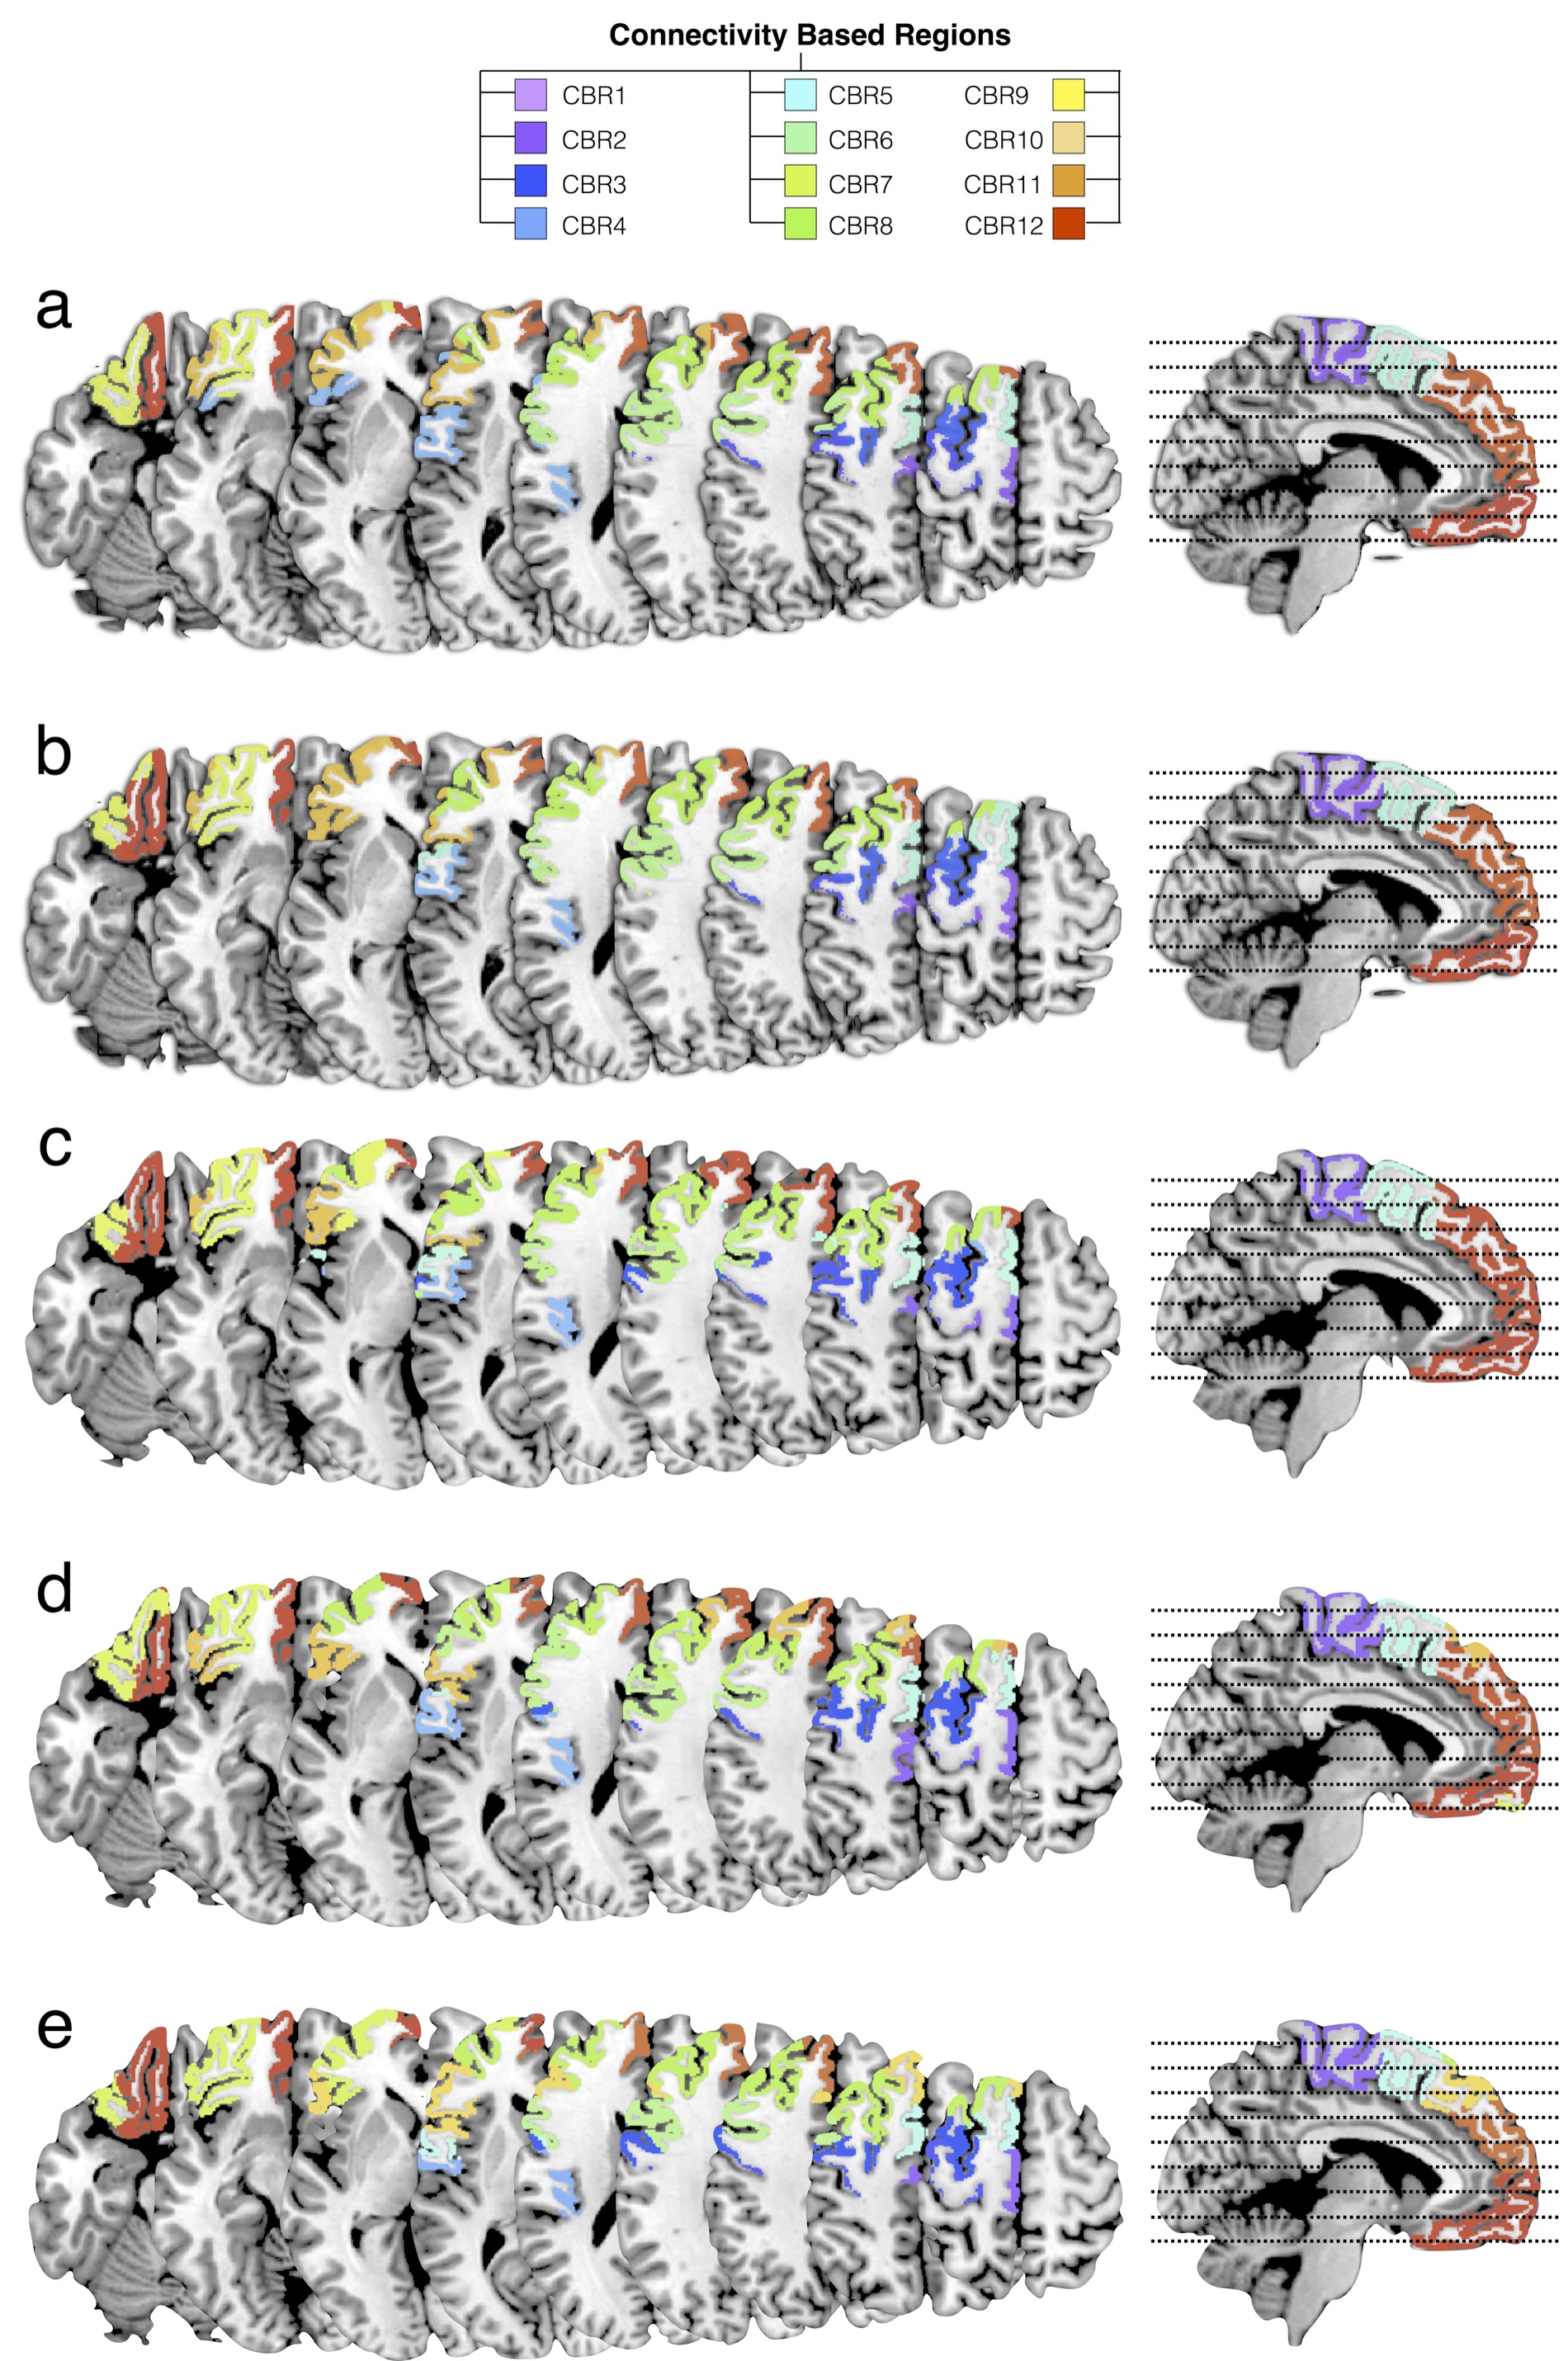
PCA identified 12 CBRs in the left frontal lobe of each participant (Fig2). This result was replicated in the second dataset producing a frontal division almost identical to the one obtained by the HCP dataset (R2=0.96, Fig3a,b). Note that the frontal division at the individual level also showed clear similarities with the group (R2=0.919, Fig3c-e), with some differences that may reflect individual specificity. The comparison with the meta-analysis revealed a functional specificity in activations for each CBR identified (Fig. 4). For instance CBR6 was most likely activated during phonological tasks (Z=10.81) whereas CBR11 was most likely activated during social tasks (Z=8.88).Discussion.
Tractography-based parcellation using the PCA statistical framework may be used to reliably divide the frontal lobe into 12 areas across datasets and participants. This suggests that the number of identifiable CBRs within the frontal lobes, including their boundaries, are reproducible across populations/individuals, and are driven by the structural connectivity of the brain rather than, to some extent, the resolution or the quality of the DWI data. These areas showed neat functional specificity as defined by functional magnetic resonance imaging. This finding corroborates the concept that the function of an area can be defined by the nature of its structural connections 1 and delivers further evidence to support the use of diffusion imaging tractography to subdivide the brain.Conclusion.
Further research should investigate whether these measures could help to account for the large inter-individual variability by providing a personalized quantification of functionally characterized areas in the frontal lobe. This approach may strengthen the prediction or diagnosis of neurodevelopmental and neuro- degenerative disorders (Le Ber et al. 2006; Ecker et al. 2015).Acknowledgements
Data was provided in part by the Human Connectome Project, WU-Minn Consortium (Principal Investigators: David Van Essen and Kamil Ugurbil; 1U54MH091657) funded by the 16 NIH Institutes and Centers that support the NIH Blueprint for Neuroscience Research; and by the McDonnell Center for Systems Neuroscience at Washington University. The BigBrain dataset is the result of a collaborative effort between the teams of Dr Katrin Amunts, Dr Karl Zilles (Forschungszentrum Jülich) and Dr Alan Evans (Montreal Neurological Institute). Additional support comes from the “Agence Nationale de la Recherche” [grants number ANR-09-RPDOC-004-01 and number ANR-13- JSV4-0001-01] and from the Fondation pour la Recherche Médicale (FRM). The research leading to these results received funding from the program “Investissements d’avenir” ANR-10- IAIHU-06.References
1. Van Essen, D. C.; Maunsell, J. H. R., Hierarchical organization and functional streams in the visual cortex. Trends in neurosciences 1983.
2. Jbabdi, S.; Behrens, T. E., Long-range connectomics. Ann N Y Acad Sci 2013, 1305, 83-93.
3. Caspers, S.; Eickhoff, S. B.; Zilles, K.; Amunts, K., Microstructural grey matter parcellation and its relevance for connectome analyses. Neuroimage 2013, 80, 18-26.
4. Aganj, I.; Lenglet, C.; Sapiro, G.; Yacoub, E.; Ugurbil, K.; Harel, N., Reconstruction of the orientation distribution function in single- and multiple-shell q-ball imaging within constant solid angle. Magn Reson Med 2010, 64 (2), 554-66.
5. Yarkoni, T.; Poldrack, R. A.; Nichols, T. E.; Van Essen, D. C.; Wager, T. D., Large-scale automated synthesis of human functional neuroimaging data. Nat Methods 2011, 8 (8), 665-70.
6. Johansen-Berg, H.; Behrens, T. E. J.; Robson, M. D.; Drobnjak, I.; Rushworth, M. F. S.; Brady, J. M.; Smith, S. M.; Higham, D. J.; Matthews, P. M., Changes in connectivity profiles define functionally distinct regions in human medial frontal cortex. Proc Natl Acad Sci USA 2004, 101 (36), 13335-40.
7. Thiebaut de Schotten, M.; Urbanski, M.; Valabregue, R.; Bayle, D. J.; Volle, E., Subdivision of the occipital lobes: an anatomical and functional MRI connectivity study. Cortex 2014, 56, 121-37.
Figures