1662
Impaired executive and visual network integrity in patients with Parkinson’s disease and psychosis: A structural connectome based study1Neurology, NIMHANS, Bengaluru, India, 2Department of Electronics, Symbiosis Institute of Technology, Symbiosis International University, Pune, India, 3Radiology, NIMHANS, Bengaluru, India
Synopsis
Psychosis manifested as formed visual hallucinations is one of the debilitating non-motor symptoms of Parkinson’s disease (PD), the patho-physiology of which remains unclear. To gain insights into the neural correlates of psychosis in PD this study analyzed the structural connectomic sub-networks of visual, executive and memory circuits between patients with PD and psychosis (PD-P), PD without psychosis (PD-NP) and controls (HC). When PD-P and HCs were compared, a global connectivity deficit was observed in the visual and executive circuits and multiple connections within the visual network demonstrated significantly lower connectivity in PD-P. Such changes were not observed in PD-NP vs. HCs.
Introduction
Psychosis is one of the debilitating non-motor symptoms of Parkinson’s disease (PD)1. It is associated with higher health care resource utilization and is an independent risk factor for higher mortality in PD2. Psychosis in PD usually manifests as formed visual hallucinations and minor hallucinations such as sense of presence and sense of passage. Although older age, greater disease severity and stage, cognitive impairment, and long-term use of dopaminergic agents have been regarded as risk factors for emergence of psychosis in PD, exact neural correlates of psychosis in PD are yet to be understood. Visuo-spatial, executive and memory dysfunction have been speculated in PD patients with psychosis3, however there is no direct evidence of alteration in the neural networks involved in these functions.This study therefore aims at analyzing the integrity of the visual, memory and executive network in PD patients with (PD-P) and without psychosis (PD-NP) and healthy controls (HC).Materials and methods
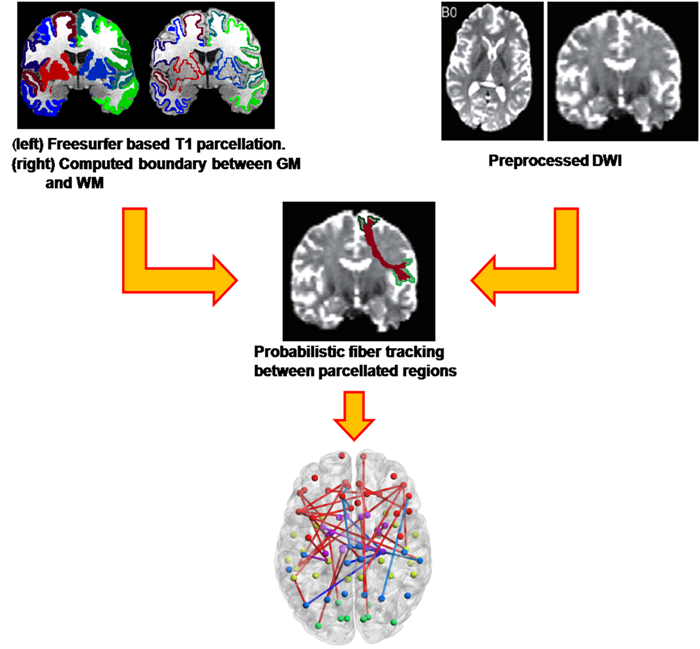
Diffusion MR images were obtained from 69 subjects (PD-P: 28, PD-NP:24, HC: 17, age and gender matched, MMSE > 24) using a Philips Achieva® 3T MRI scanner with a 32 channel head coil. The diffusion MRI data for each subject was acquired using a single-shot spin-echo, echo-planar sequence with 15 diffusion sensitive gradient directions with b-value = 1000 s/mm2and a b = 0 s/mm2 image, with a voxel size = 1.75 × 1.75 × 2 mm (without any intersection gap). High-resolution 3D T1 TFE images were acquired with repetition time (TR) = 8.1 ms, echo time (TE) = 3.7 ms, flip angle = 8°, sense factor = 3.5, field of view (FOV) = 256 × 256 × 155 mm, voxel size = 1 × 1 × 1 mm. For creating the structural connectome (figure 1), cortical parcellation and sub-cortical segmentation was obtained using Freesurfer4 on structural T1 images and a total of 86 regions were extracted to represent the nodes of the structural network (68 cortical regions and 18 subcortical structures). The quality of the parcellation was manually checked for each subject and then transferred to the Diffusion MRI space using an affine transform. To calculate the edges of the graph, probabilistic fiber tracking5 was performed by seeding each node and then computing the number of fibers that reached every other node. The edge strength therefore indicates the number of fibers traveling between the two nodes6. After performing tractography from each node we obtained an 86*86 connectome for each subject which is a symmetric matrix with zero diagonal (no self connections). Sub-networks associated with executive, visual and memory functioning were then extracted based on the functional associations of the brain regions in fMRI literature7. A topological and an edge-wise analysis were carried out for each of the sub-networks using a MANCOVA model with age and gender as co-variates. False discovery rates at p= 0.1 significance were employed to account for multiple comparisons.Results
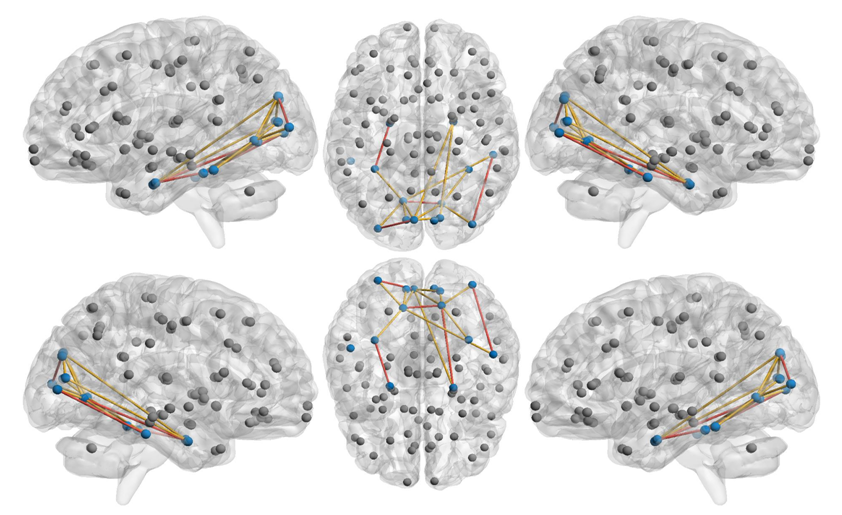
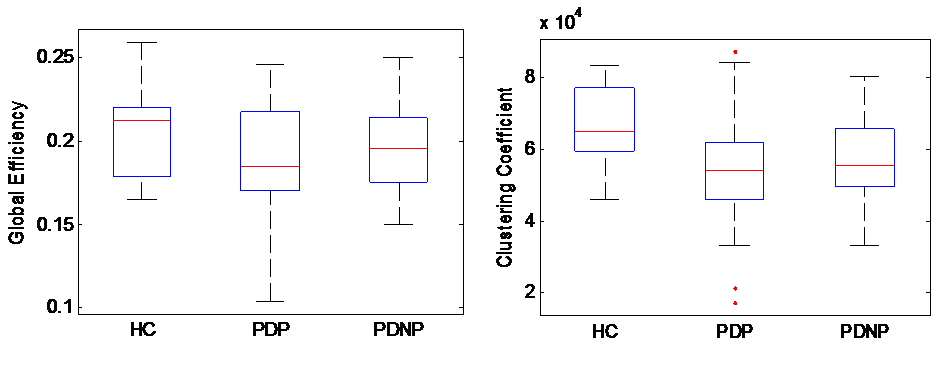
Significant network deficits were observed in the visual network connections (r-lingual to r-entorhinal, l-entorhinal to l-fusiform, l-lingual to r-lingual, l-cuneus to l-lateraloccipital, r-inferiortempral to r-lateraloccipital) (figure 2) and also at a visual network level with significantly lower global efficiency and clustering coefficient (p-value < 0.002) (figure 3), as well as in the executive network with lower modularity and higher characteristic path length (p-value< 0.005) when PD-P subjects were compared to HCs. This significance was not observed in any of the pathways when PD-NP subjects when compared to HCs other than significantly lower clustering coefficient in the visual network in PD-NP. Between PD-P and PD-NP, no significant difference was observed; however strong trends demonstrating lower connection strength (uncorrected) in PD-P subjects was apparent.Discussion
We studied the structural integrity of three networks i.e. visual, memory and executive network, alterations of which have been implicated in the pathogenesis of psychosis in PD. The results demonstrate loss of structural integrity in the visual circuit and global changes in the visual and executive network of PD-P subjects when compared to the controls. We did not observe any significant difference in the pattern of connectivity of the two PD-subgroups; however strong trends demonstrating lower connection strength in PD-P were noticeable. Future studies with larger sample size are warranted to gain better insights into the role of these networks in PD-P subjects. In summary, this study provided direct evidence of possible involvement of visual and executive networks in the genesis of psychotic symptoms in PD.Acknowledgements
We would like to thank CDAC BRAF for providing their parallel computing facility and DST-SERB for funding this project (ECR/2016/000808).References
1. Schapira et al. Non-motor features of Parkinson disease.Nat Rev Neurosci. (2017) Jul;18(7):435-450.
2. Frederick’s et al.; Parkinson’s disease and Parkinson’s disease psychosis: a perspective on the challenges, treatments, and economic burden. Am JManag Care (2017) Apr;23(5 Suppl):S83-S92
3. Lenka et al. : Psychosis in Parkinson's disease: From the soft signs to the hard science; J NeurolSci.(2017) Aug 15;379:169-176.
4. Fischl B, et al.: Automatically Parcellating the Human Cerebral Cortex, Cerebral Cortex. (2004)11(22).
5. Behrens, Timothy EJ, et al. "Probabilistic diffusion tractography with multiple fibre orientations: What can we gain?." Neuroimage 34.1 (2007): 144-155.
6. S.M. Smith, M. Jenkinson, et. al. Advances in functional and structural MR image analysis and implementation as FSL. NeuroImage, (2004) 23(S1):208-19,
7. Power JD et al. Functional network organization of the human brain. Neuron (2011)72, 665–678.
Figures