1661
Optic radiation tractography in pediatric brain tumor and epilepsy surgery: a test-retest reliability assessment of the tractography method1Developmental Imaging, Murdoch Children's Research Institute, Melbourne, Australia, 2Neuroscience Research, Murdoch Children's Research Institute, Melbourne, Australia, 3Neurosurgery, The Royal Children's Hospital, Melbourne, Australia, 4Medicine, Monash University, Melbourne, Australia, 5Medical Imaging, The Royal Children's Hospital, Melbourne, Australia, 6Paediatrics, University of Melbourne, Melbourne, Australia, 7Neurology, the Royal Children's Hospital, Melbourne, Australia, 8Melbourne School of Psychological Sciences, University of Melbourne, Melbourne, Australia, 9Clinical Sciences, Murdoch Children's Research Institute, Melbourne, Australia, 10Psychology, the Royal Children's Hospital, Melbourne, Australia
Synopsis
Existing optic radiation (OR) tractography methods lack pediatric and surgical focus. We proposed a clinically feasible tractography framework and examined its test-retest reliability using both the preoperative and intraoperative MRI from eight pediatric epilepsy and brain tumor patients. Good to excellent intra- and inter-rater reproducibility was demonstrated in the assessments of all diffusion and morphological track metrics. The reconstructions closely resembled classic anatomy. All OR images were used to assist surgical planning and resection. Postoperatively, no patient had new visual field deficits. Our tractography method generates reproducible OR images that can be safely implemented in routine, non-emergency pediatric neurosurgical settings.
Introduction
Neurosurgery involving the temporal, parietal and occipital regions risks optic radiation (OR) injuries, leading to permanent visual field deficits (VFDs).1 MRI tractography is used in neurosurgical planning to minimize white matter tract injuries.2 However there are inconsistencies between the OR tractography reconstructions and the cadaveric dissection anatomical ground-truth.3, 4 While numerous advances have been made in areas of fiber modeling5-7 and tracking algorithms8, 9, especially in high curvature regions10, much less emphasis is placed on systematic placement of regions of interest (ROIs).3 ROI placement methods are crucial for accurate tract reconstruction, especially in the presence of pathology. The existing literature also lacks pediatric and clinical focus.11, 12 There remains a need to develop and asses the reliability of an OR tractography method targeting clinical pediatric populations. We propose an OR tractography method using automated and manual ROIs to account for pathology and individual anatomy. We evaluate both the intra- and inter-rater test retest reliability using the preoperative and intraoperative MRI data acquired in pediatric brain tumor and epilepsy patients.Methods
Participants: The MRI data from two brain tumor and six focal refractory epilepsy pediatric patients were retrospectively selected (6M, 2y8m to 16y6m; one intraoperative scan). The cases include a variety of lesions along the OR pathway.
DWI data: 3T High angular resolution diffusion imaging (HARDI) data was acquired (2.3 mm3 isotropic, TR/TE 7600/110 ms, 60 directions, b = 3000 s/mm2, seven b0). All diffusion data was denoised, motion, eddy current and b1 bias field corrected. Constrained spherical deconvolution (CSD) implemented in MRtrix3 was used to estimate local fiber orientation distribution (FOD).6, 13 Probabilistic tractography was performed using the 2nd order integration over FOD10 with default tracking parameters.
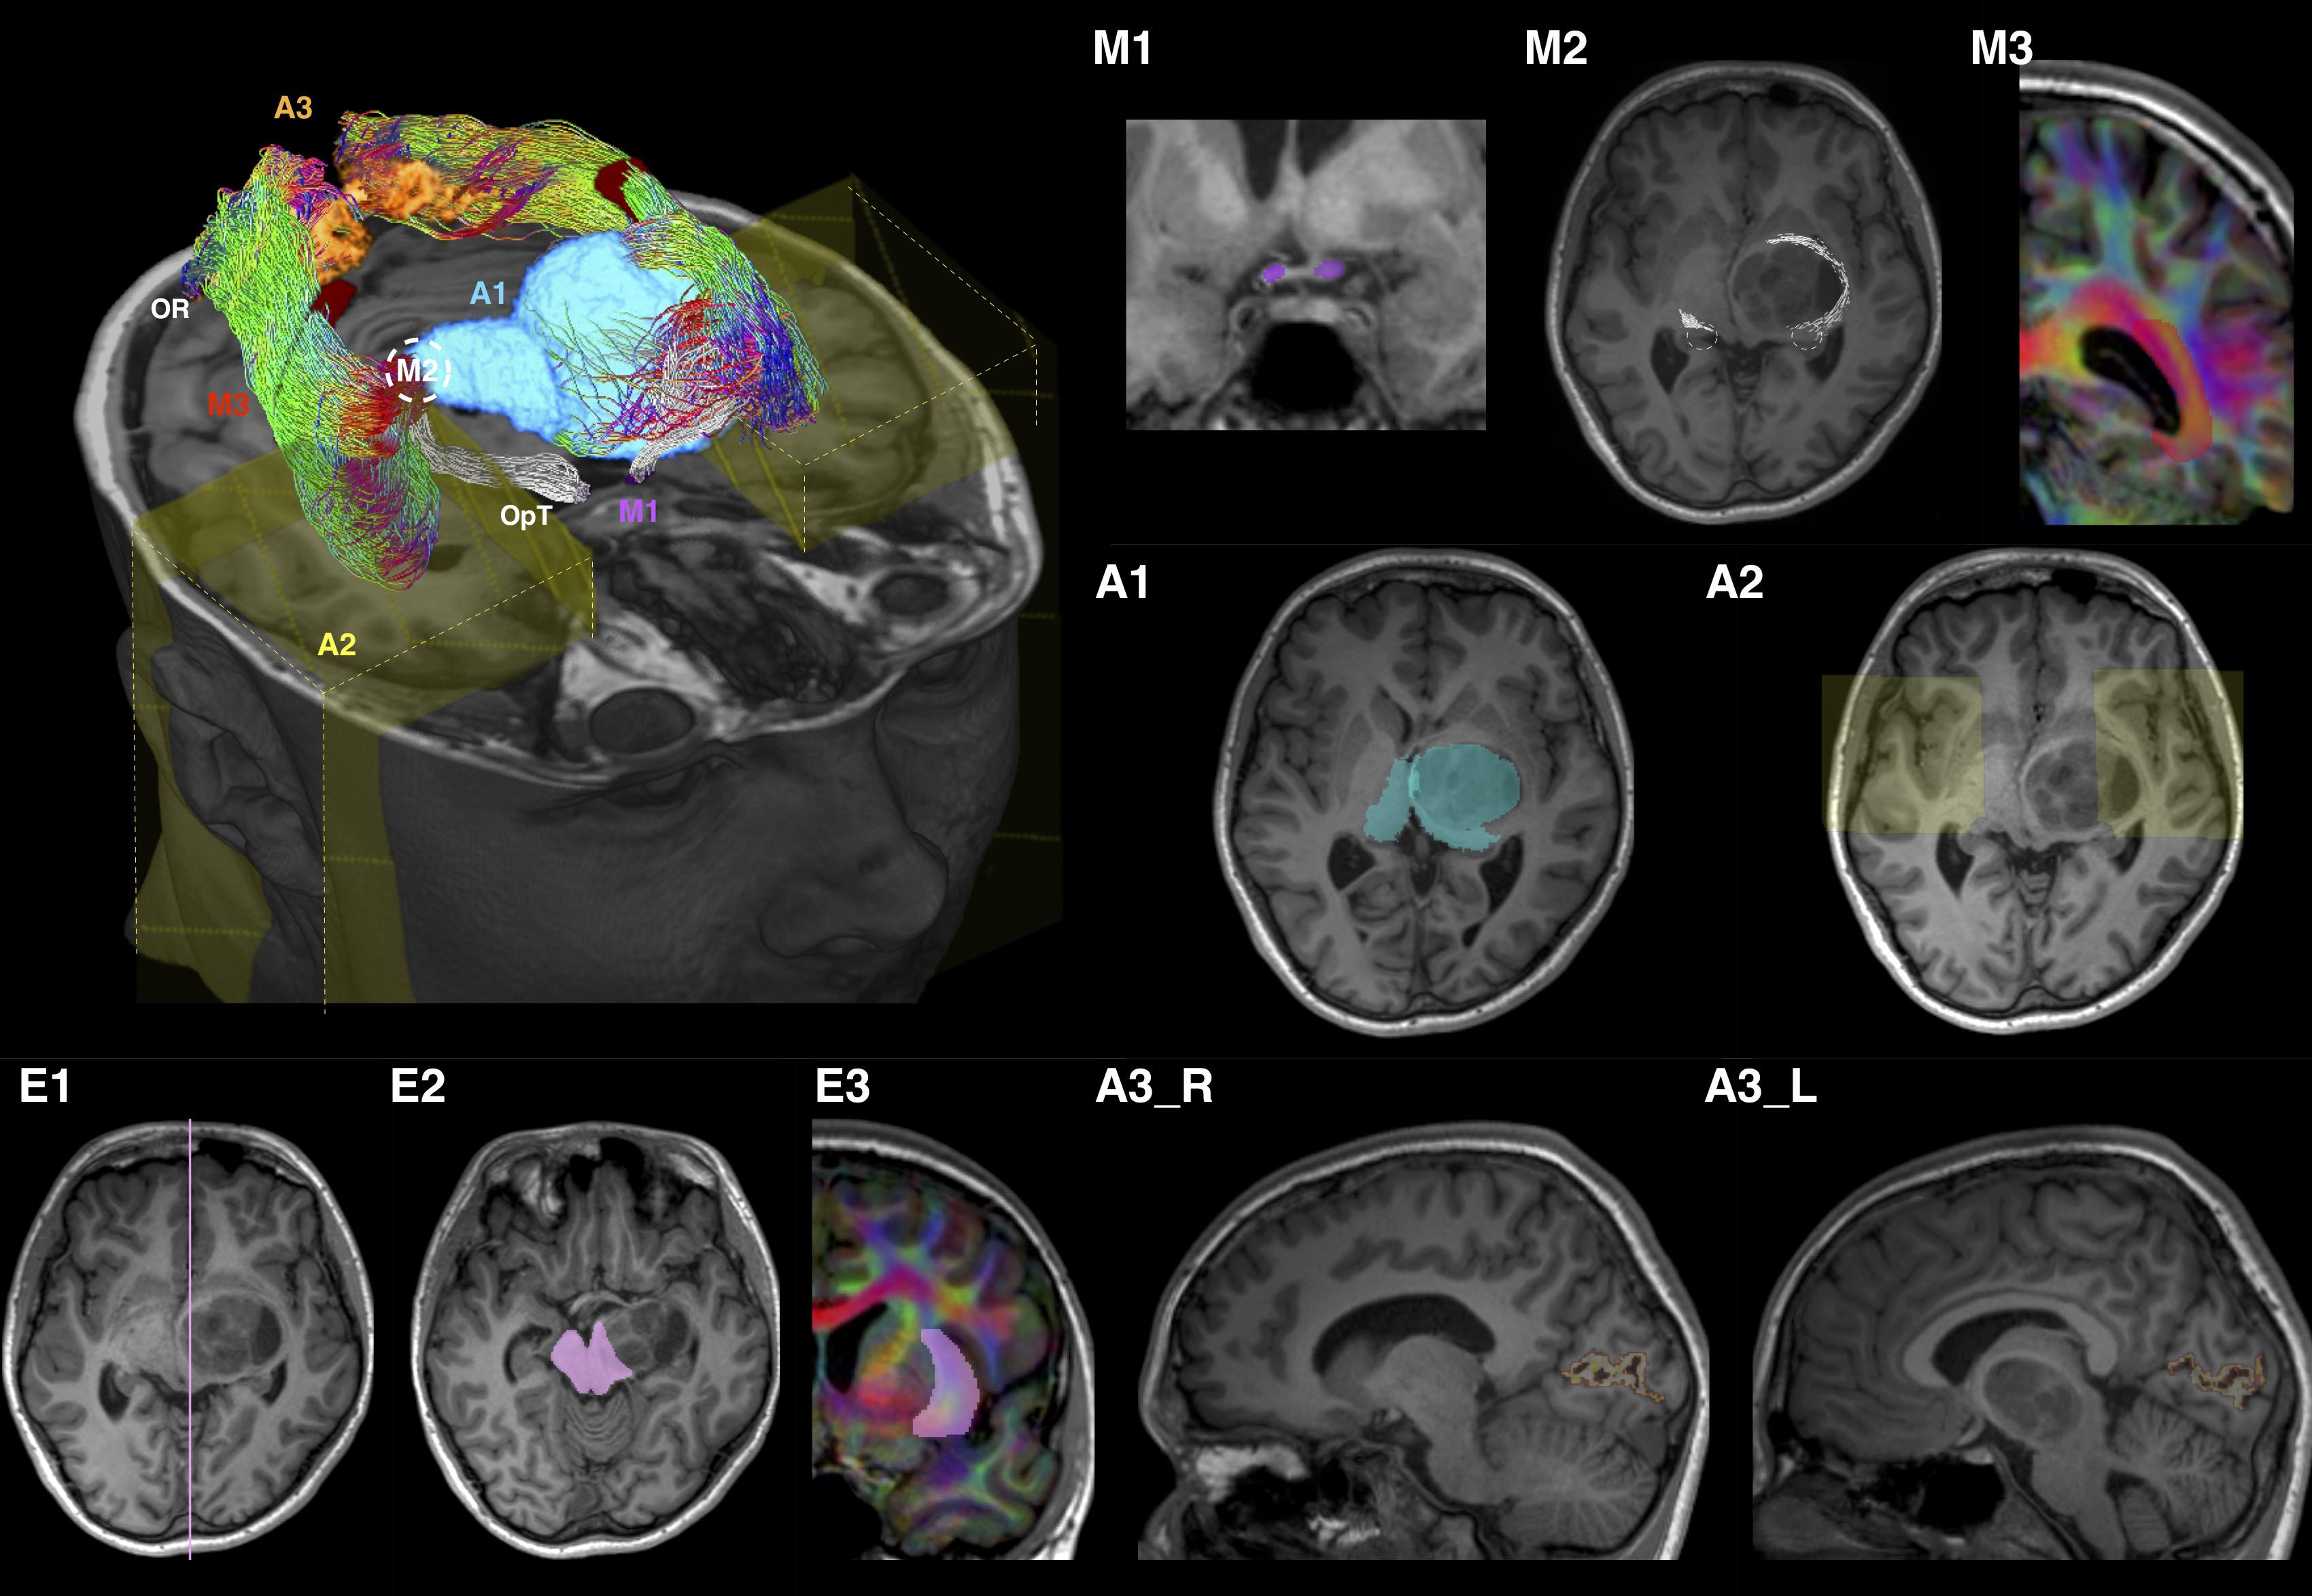
Tractography ROI procedure: is summarized in Figure 1. The technique employed multiple anatomical ROIs, which could be modified to account for pathology. Anatomical priors based on cadaveric dissection were used to delete spurious streamlines.14, 15
Test-retest assessments: Four raters with different clinical and research experiences performed the tractography. Two raters performed tracking twice. The assessments were based on the binarized track mask, derived diffusion scalar metrics, track volumes, lateral geniculate body (LGB) positions, and the temporal OR – Meyer’s loop (ML) position relative to anatomical landmarks.
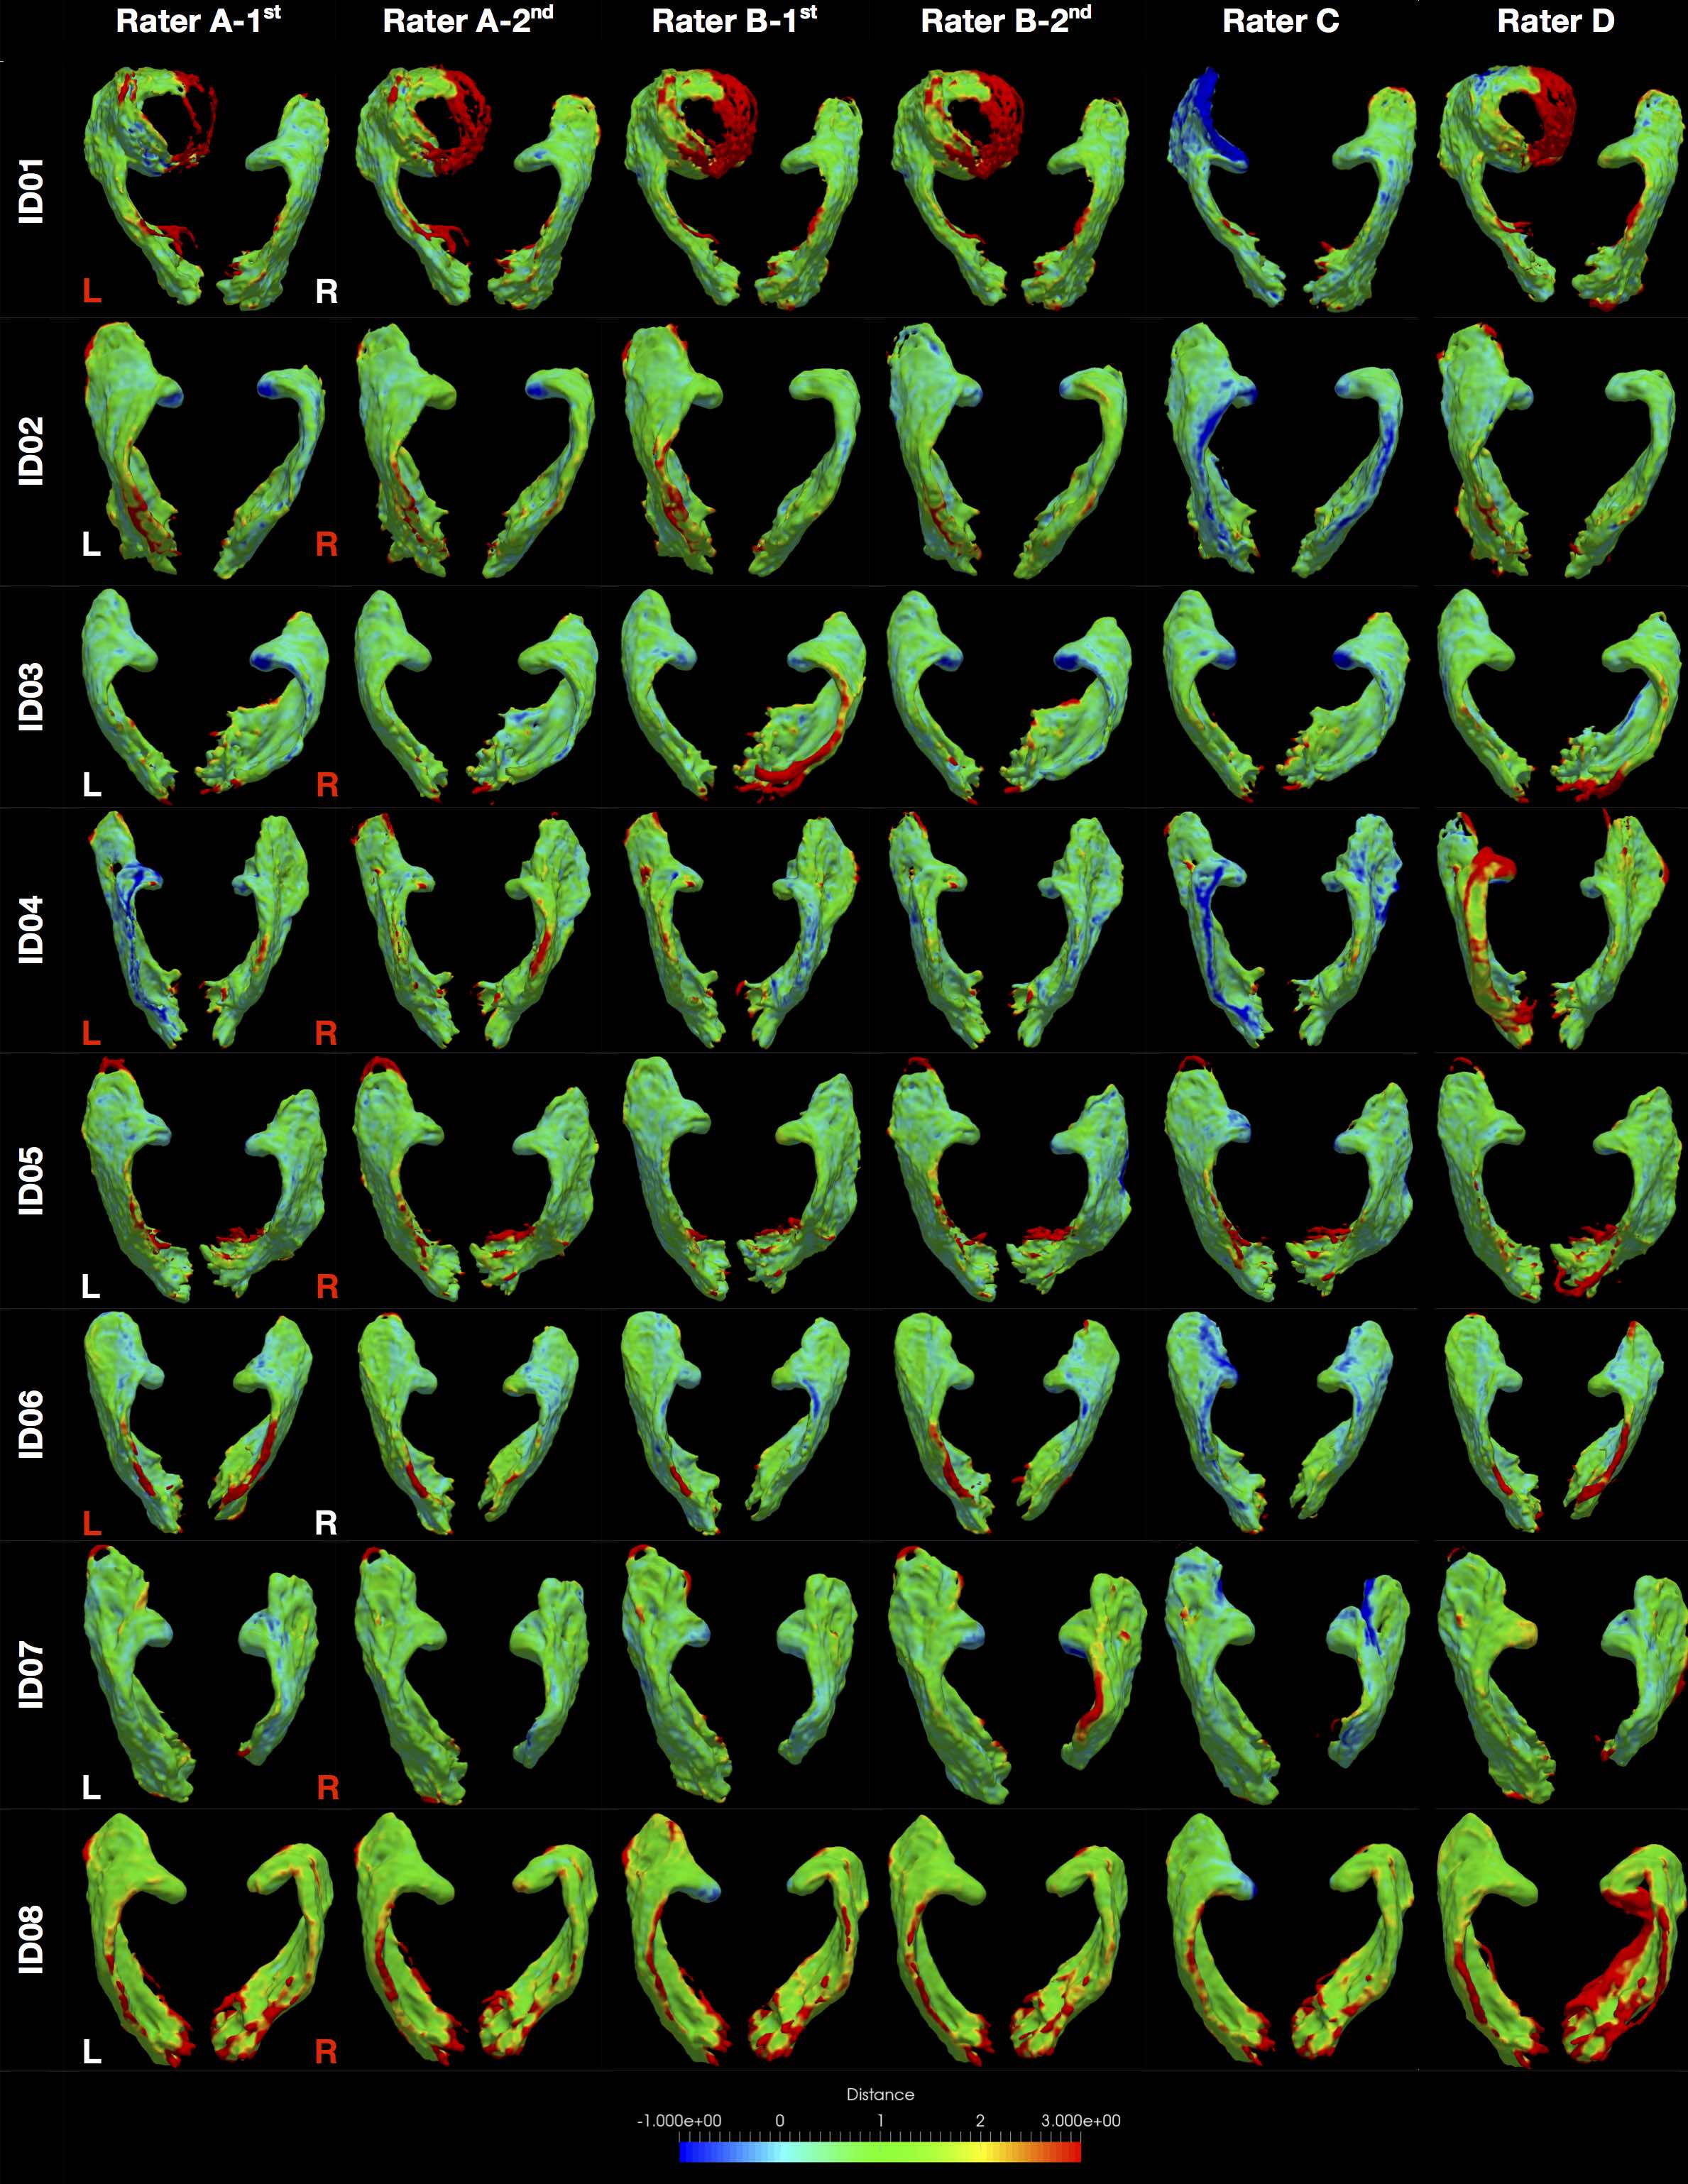
Analysis: Agreements within and between raters were assessed using the intra-class correlation (ICC).16 The degree of overlap in binary track masks was assessed using the dice similarity coefficient (DSC).17 The values were interpreted as poor (<0.4), fair (≥0.4, <0.6), good (≥0.6, <0.75) and excellent (≥0.75).16, 17 Distance maps between each track mask and a per patient consensus track mask generated using STAPLE were used to display disparities between different tracking attempts.18
Results
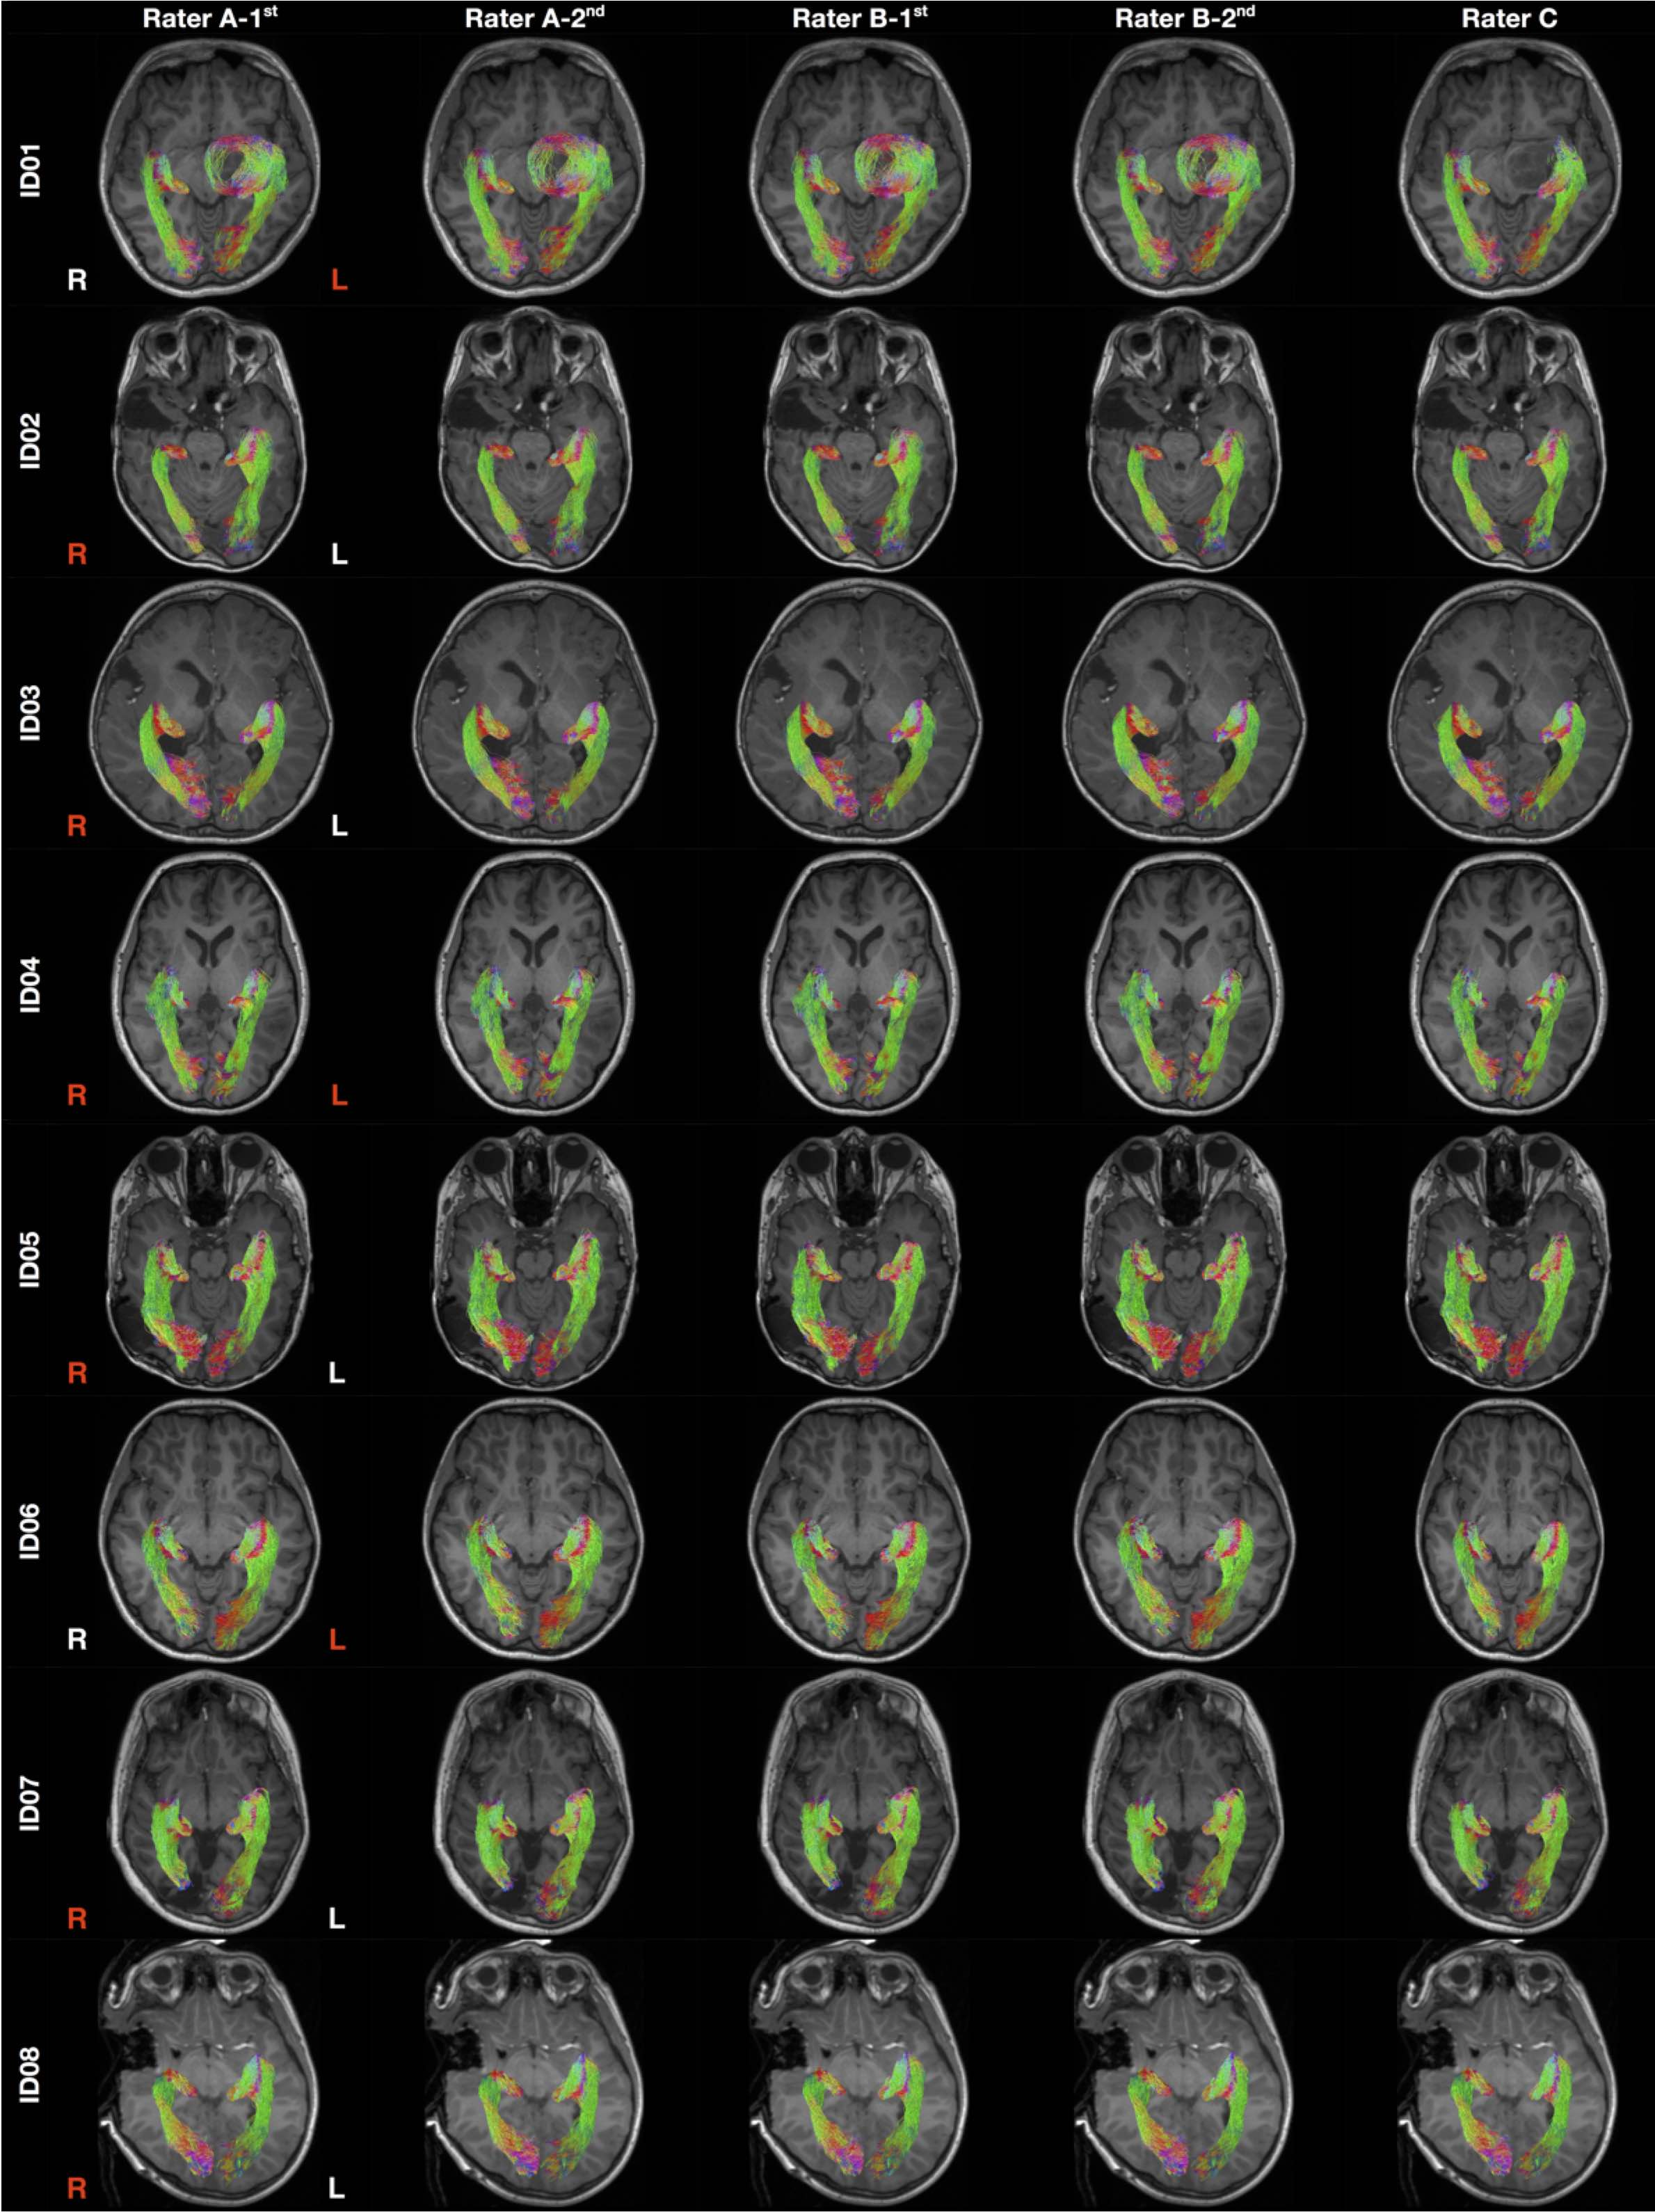
Figure 2 shows all tractography images. All except one attempt (Rater C, left OR, ID01) demonstrated highly reproducible OR images. The distance maps from the consensus track masks are displayed in Figure 3. The distance variations between different tracking attempts were mostly within ± 1 mm of the consensus masks, with only few exceptions.
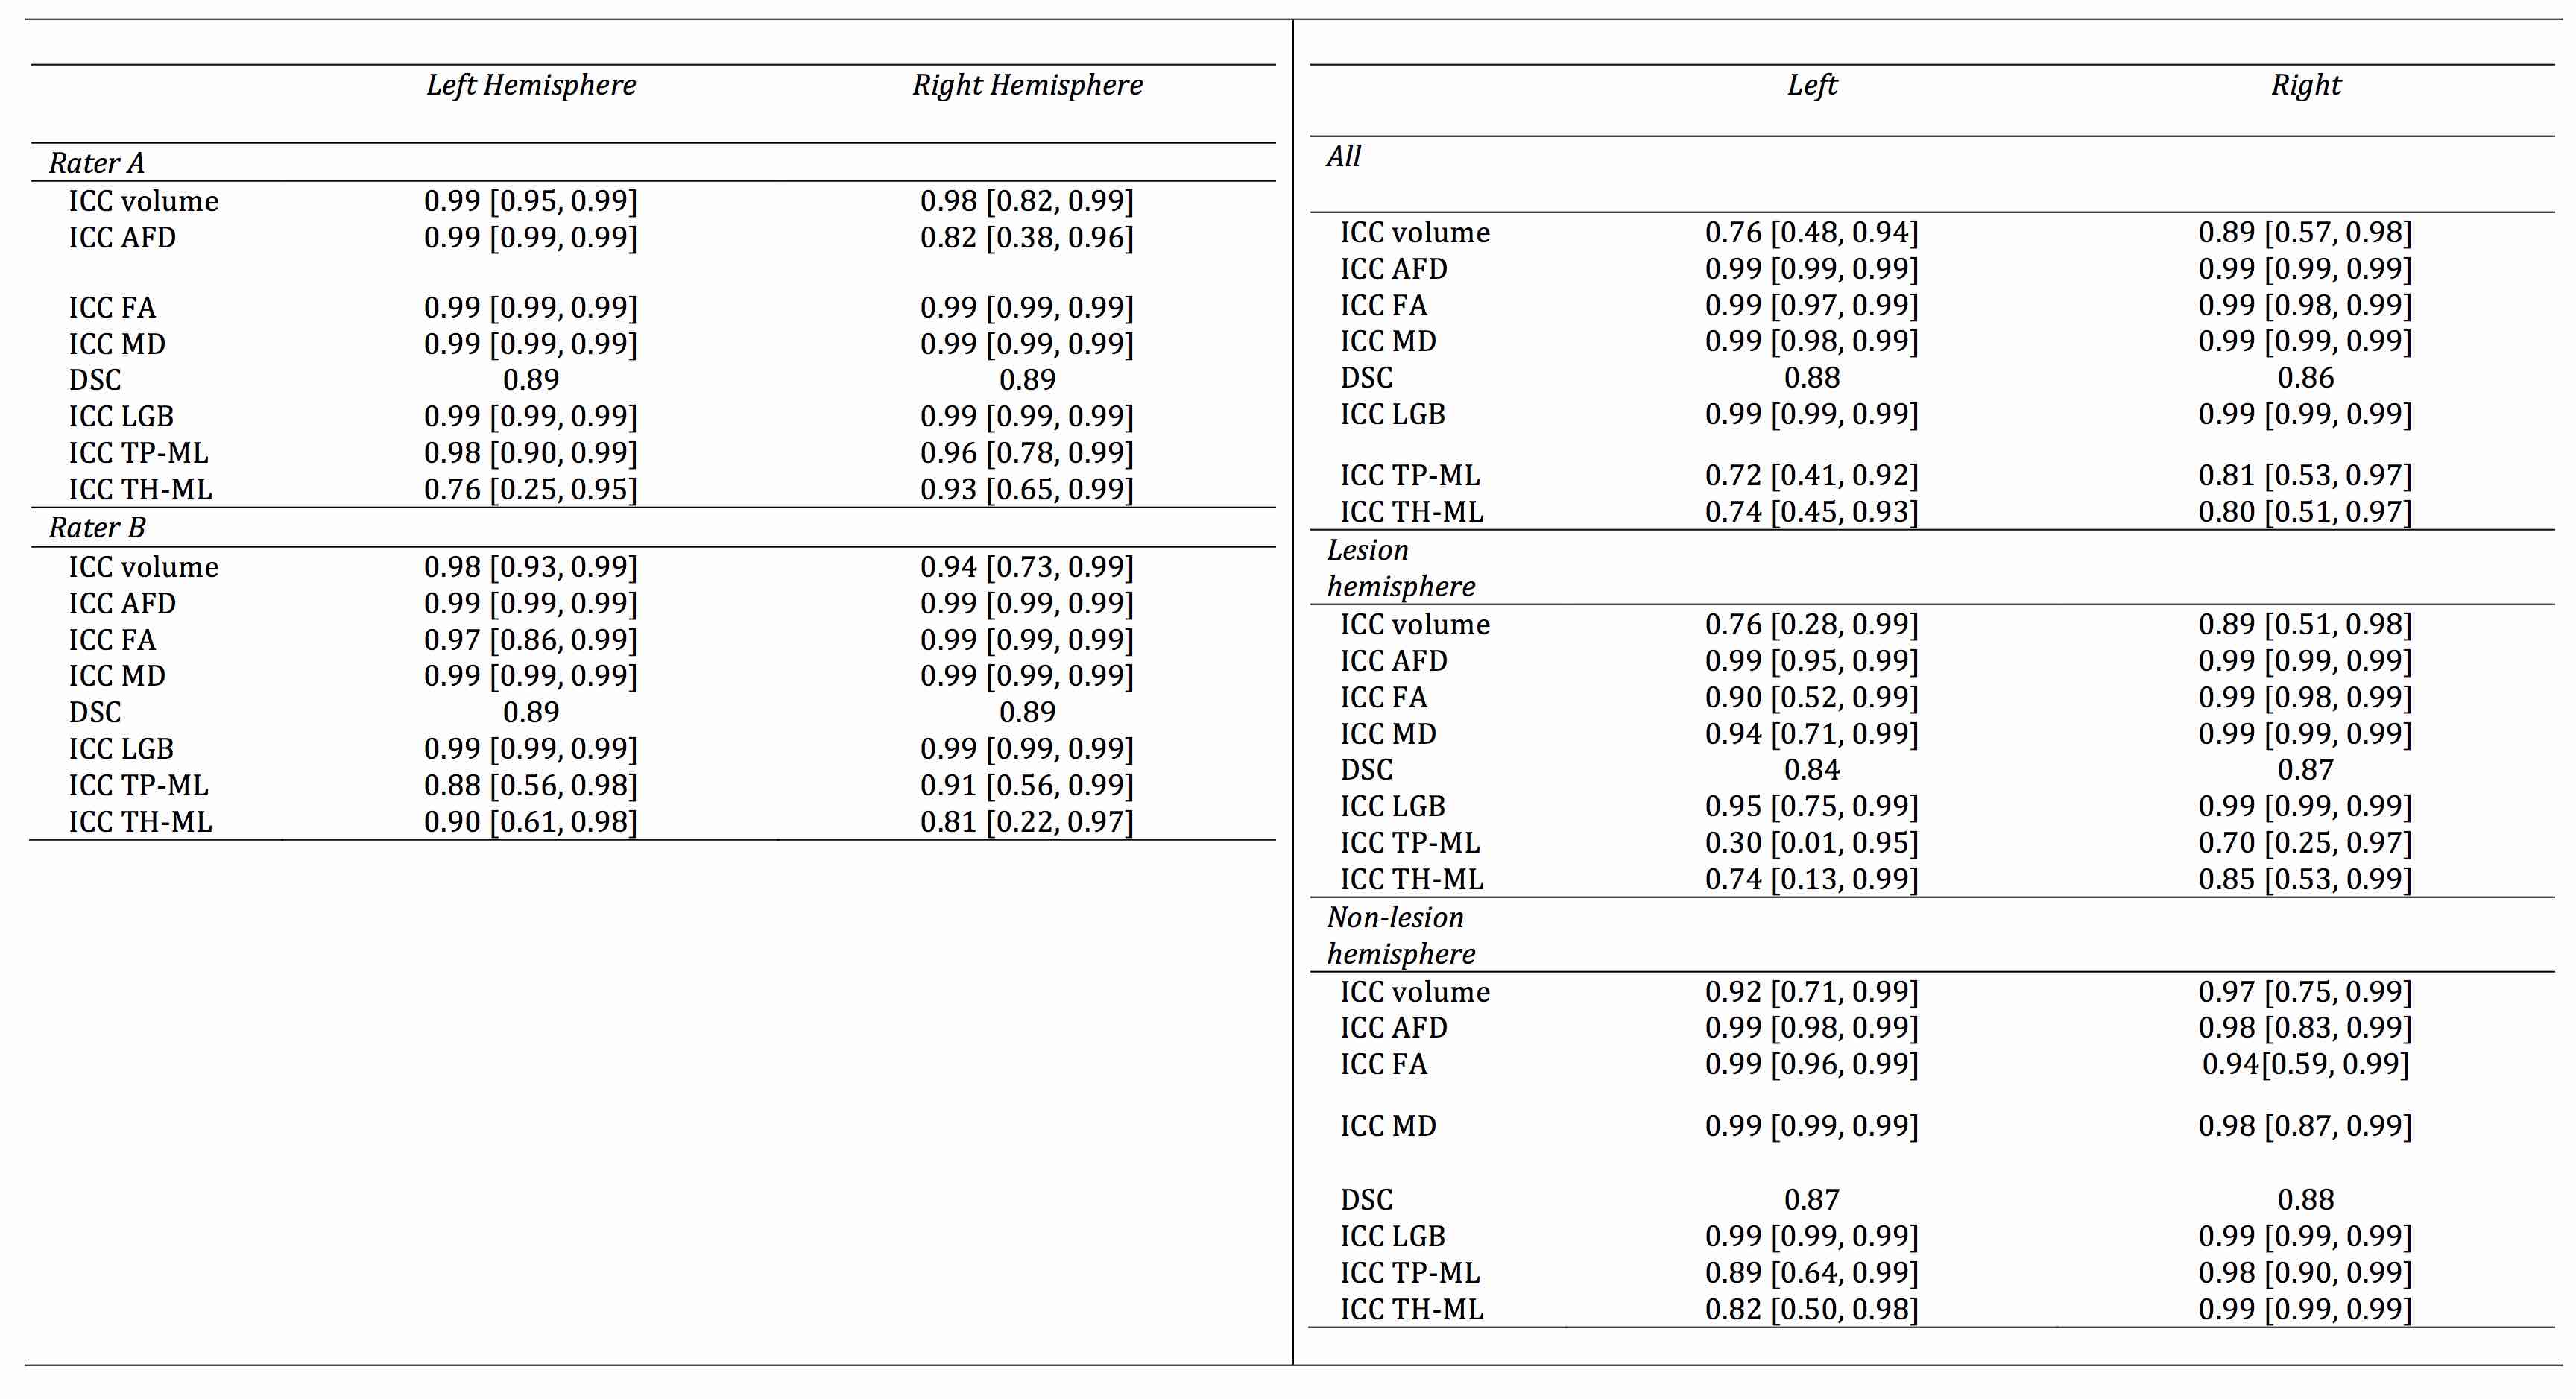
Figure 4 summarizes all ICC and DSC scores. All intra- and inter-rater median DSCs were in the excellent range. All intra-rater ICCs were in the excellent range. All inter-rater ICCs, except ones concerning the ML position distances were in the excellent range. The inter-rater ML position distances ICCs ranged from good to excellent. All scores were slightly higher for the non-lesional than the lesional ORs.
Discussion
Our test-retest results were comparable to existing OR tractography studies involving healthy adult participants19, 20, and adult epilepsy patients.21-23 The tracking variations observed in this study, compared to the consensus track masks remains small, and comfortably below the acceptable resection error margin when surgery is informed by preoperative tractography reconstructions. 24-26
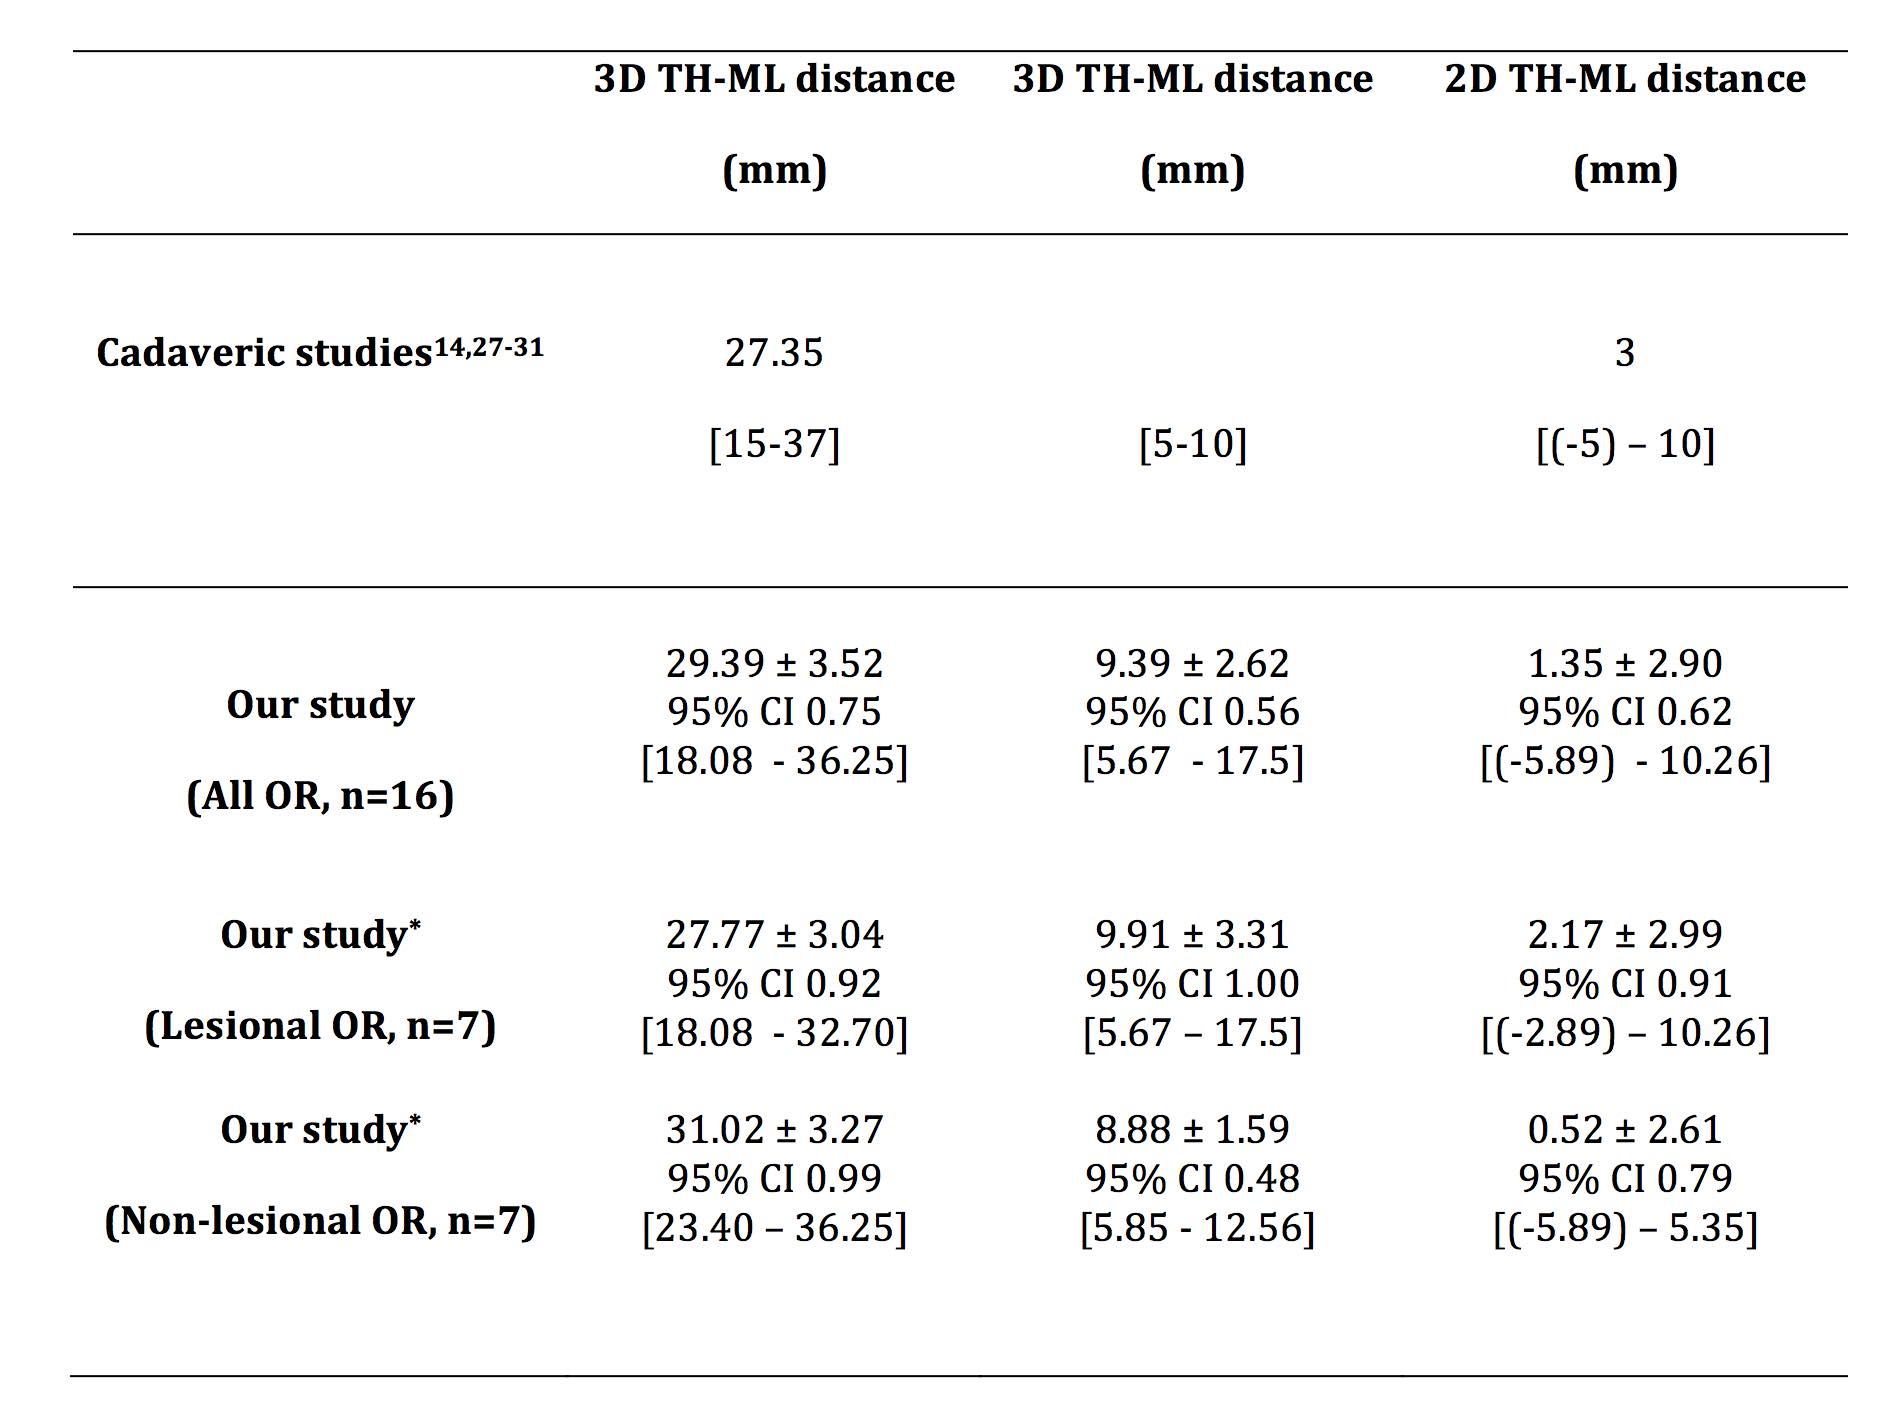
The anatomical validity of our tracking results is strongly supported by adult-based dissection studies14, 27-31, given lack of comparable pediatric evidence. Visually, our tracking results closely resemble dissection descriptions. The streamlines form a continuous “sheet-like” WM structure with minimal to no gaps – an important qualitative tractography assessment criterion.3 Our ML position results closely matched classic dissection findings (Figure 5).14, 27-31
While the processing time involved precludes the use of our tractography method in acute neurosurgical settings, clinical applicability of our method is evident in the care of these patients. The OR tractography results correlated well with preoperative findings in six patients with formal VF tests. The OR images were used to assist surgical planning and resection in all cases. No patient had new postoperative VFDs.
Conclusion
Our tractography method generates reproducible OR images that can be safely implemented in routine, non-emergency pediatric neurosurgical setting.Acknowledgements
We thank Dr. A. Simon Harvey, consult pediatric neurologist, for his clinical inputs. We thank Dr. Christopher Adamson, PhD, for technical support.
This research was conducted within, the Developmental Imaging and Neuroscience Research groups, Murdoch Children's Research Institute, the Department of Neurosurgery, Royal Children's Hospital, at the Melbourne Children's MRI centre, Melbourne, Victoria. It was supported by the Royal Children's Hospital Foundation (RCH 1000 to Dr. Yang), Australia's National Health and Medical Research Council (Postgraduate Scholarship 1039160 to Dr. Yang; Peter Doherty Biomedical Research Fellowship to Dr. Malpas), Murdoch Children's Research Institute, The University of Melbourne Department of Paediatrics, and the Victorian Government's Operational Infrastructure Support Program.
References
1. Hughes TS, Abou-Khalil B, Lavin PJ, Fakhoury T, Blumenkopf B, Donahue SP. Visual field defects after temporal lobe resection: A prospective quantitative analysis. Neurology. 1999;53:167-172
2. Piper RJ, Yoong MM, Kandasamy J, Chin RF. Application of diffusion tensor imaging and tractography of the optic radiation in anterior temporal lobe resection for epilepsy: A systematic review. Clin Neurol Neurosurg. 2014;124:59-65
3. Benjamin CF, Singh JM, Prabhu SP, Warfield SK. Optimization of tractography of the optic radiations. Hum Brain Mapp. 2014;35:683-697
4. Mandelstam SA. Challenges of the anatomy and diffusion tensor tractography of the meyer loop. AJNR Am J Neuroradiol. 2012;33:1204-1210
5. Lazar M, Weinstein DM, Tsuruda JS, Hasan KM, Arfanakis K, Meyerand ME, et al. White matter tractography using diffusion tensor deflection. Hum Brain Mapp. 2003;18:306-321
6. Tournier JD, Calamante F, Connelly A. Robust determination of the fibre orientation distribution in diffusion mri: Non-negativity constrained super-resolved spherical deconvolution. Neuroimage. 2007;35:1459-1472
7. Tuch DS. Q-ball imaging. Magn Reson Med. 2004;52:1358-1372
8. Jones DK. Tractography gone wild: Probabilistic fibre tracking using the wild bootstrap with diffusion tensor mri. IEEE Trans Med Imaging. 2008;27:1268-1274
9. Parker GJ, Haroon HA, Wheeler-Kingshott CA. A framework for a streamline-based probabilistic index of connectivity (pico) using a structural interpretation of mri diffusion measurements. J Magn Reson Imaging. 2003;18:242-254
10. Tournier JD, Calamante F, Connelly A. Improved probabilistic streamlines tractography by 2nd order integration over fibre orientation distributions Proc. Intl. Soc. Mag. Reson. Med. 18 2010:1670
11. Chamberland M, Scherrer B, Prabhu SP, Madsen J, Fortin D, Whittingstall K, et al. Active delineation of meyer's loop using oriented priors through magnetic tractography (magnet). Hum Brain Mapp. 2017;38:509-527
12. Dayan M, Munoz M, Jentschke S, Chadwick MJ, Cooper JM, Riney K, et al. Optic radiation structure and anatomy in the normally developing brain determined using diffusion mri and tractography. Brain Struct Funct. 2015;220:291-306
13. Tournier JD, Yeh CH, Calamante F, Cho KH, Connelly A, Lin CP. Resolving crossing fibres using constrained spherical deconvolution: Validation using diffusion-weighted imaging phantom data. Neuroimage. 2008;42:617-625
14. Ebeling U, Reulen HJ. Neurosurgical topography of the optic radiation in the temporal lobe. Acta Neurochir (Wien). 1988;92:29-36
15. Ludwig E, Klingler J. Atlas cerebri humani. The inner structure of the brain demonstrated on the basis of macroscopical preparations. Basel, Switzerland: Little, Brown and Company; 1956.
16. Cicchetti DV. The precision of reliability and validity estimates re-visited: Distinguishing between clinical and statistical significance of sample size requirements. J Clin Exp Neuropsychol. 2001;23:695-700
17. Sorenson T. A method of establishing groups of equal amplitudes in plant sociology based on similarity of species content and its application to analyses of the vegetation on danish commons. Biologiske Skrifter. 1948;5:1-34
18. Warfield SK, Zou KH, Wells WM. Simultaneous truth and performance level estimation (staple): An algorithm for the validation of image segmentation. IEEE Trans Med Imaging. 2004;23:903-921
19. Dayan M, Kreutzer S, Clark CA. Tractography of the optic radiation: A repeatability and reproducibility study. NMR Biomed. 2015;28:423-431
20. Martinez-Heras E, Varriano F, Prckovska V, Laredo C, Andorra M, Martinez-Lapiscina EH, et al. Improved framework for tractography reconstruction of the optic radiation. PLoS One. 2015;10:e0137064
21. Lilja Y, Ljungberg M, Starck G, Malmgren K, Rydenhag B, Nilsson DT. Visualizing meyer's loop: A comparison of deterministic and probabilistic tractography. Epilepsy Res. 2014;108:481-490
22. Nowell M, Vos SB, Sidhu M, Wilcoxen K, Sargsyan N, Ourselin S, et al. Meyer's loop asymmetry and language lateralisation in epilepsy. J Neurol Neurosurg Psychiatry. 2015
23. Yogarajah M, Focke NK, Bonelli S, Cercignani M, Acheson J, Parker GJ, et al. Defining meyer's loop-temporal lobe resections, visual field deficits and diffusion tensor tractography. Brain. 2009;132:1656-1668
24. Mikuni N, Okada T, Enatsu R, Miki Y, Hanakawa T, Urayama S, et al. Clinical impact of integrated functional neuronavigation and subcortical electrical stimulation to preserve motor function during resection of brain tumors. J Neurosurg. 2007;106:593-598
25. Kamada K, Todo T, Masutani Y, Aoki S, Ino K, Takano T, et al. Combined use of tractography-integrated functional neuronavigation and direct fiber stimulation. J Neurosurg. 2005;102:664-672
26. Berman JI, Berger MS, Chung SW, Nagarajan SS, Henry RG. Accuracy of diffusion tensor magnetic resonance imaging tractography assessed using intraoperative subcortical stimulation mapping and magnetic source imaging. J Neurosurg. 2007;107:488-494
27. Choi C, Rubino PA, Fernandez-Miranda JC, Abe H, Rhoton AL, Jr. Meyer's loop and the optic radiations in the transsylvian approach to the mediobasal temporal lobe. Neurosurgery. 2006;59:ONS228-235; discussion ONS235-226
28. Chowdhury FH, Khan AH. Anterior & lateral extension of optic radiation & safety of amygdalohippocampectomy through middle temporal gyrus: A cadaveric study of 11 cerebral hemispheres. Asian J Neurosurg. 2010;5:78-82
29. Peuskens D, van Loon J, Van Calenbergh F, van den Bergh R, Goffin J, Plets C. Anatomy of the anterior temporal lobe and the frontotemporal region demonstrated by fiber dissection. Neurosurgery. 2004;55:1174-1184
30. Rubino PA, Rhoton AL, Jr., Tong X, Oliveira E. Three-dimensional relationships of the optic radiation. Neurosurgery. 2005;57:219-227; discussion 219-227
31. Probst M. Uber die zentralen sinnesbahnen und die sinneszentren des menschlichen gehirnes. Sitzungs math natl KI Akad Wissench Wien. 1906;115
Figures