1660
Utility of Advanced Diffusion Models in Assessing Abscess Structure1Radiology, Medical College of Wisconsin, Milwaukee, WI, United States, 2Pediatrics, Medical College of Wisconsin, Milwaukee, WI, United States
Synopsis
MR imaging is commonly used in the diagnosis and monitoring of cerebral abscess, especially diffusion weighted imaging. However, the use of advanced diffusion models has yet to be seen with respect to this type of brain mass. The stretched-exponential, intra-voxel incoherent, and kurtosis diffusion models not only generate diffusivity coefficients, but also other parameters that may prove valuable in properly understanding the structure and progression of such lesions.
Introduction
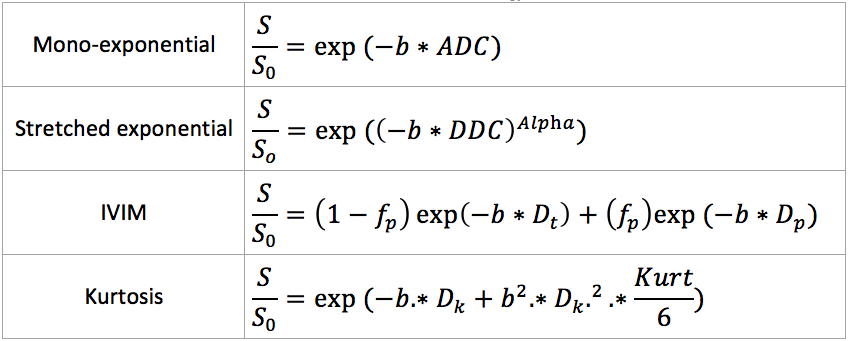
MR imaging has often been used to distinguish cerebral abscesses from similar ring enhancing brain masses1,2. Specifically, diffusion weighted (DW) imaging has been a valuable tool in monitoring treatment effect as the diffusivity in with the core of an abscess increases. However, there is infrequent use of advanced diffusion models beyond the standard mono-exponential model (ME). Application of the stretched exponential (SE), intra-voxel incoherent (IVIM), and Kurtosis models can generate parameters that are reflective of tissue inhomogeneity(Alpha)3, perfusion(fp)4, and the degree of structure(Kurt)5, respectively (models shown in Figure 1). Additionally, the advanced models can yield more sophisticated measures of diffusivity than ADC (DDC, Dp, Dt, Dk)3,4,5. Incorporating these biomarkers into standard abscess imaging analyses could offer insight to abscess formation and progression in ways not permitted by standard modeling alone.Methods
Animal Model: This analysis was performed retrospectively on imaging acquired during the development of a preclinical abscess model. 40 athymic rats were inoculated with S. anginosus group (SAG) bacteria, and then scanned on dates ranging from 4 to 28 days post-inoculation. MRI: In vivo MR imaging was acquired on a 9.4T Bruker scanner (BioSpin) fitted with a multi-channel volume coil. T1 and T2 weighted imaging was collected using RARE pulse sequences with the following parameters: TR/TE=800/12.5ms, ETL=4, Averages=2, MAT=256x256x5 and TR/TE=4500/20ms, ETL=8, Averages=1, MAT=256x256x5, respectively. Diffusion weighted scans were collected using a 4-shot EPI sequence with TR/TE=1500/35ms, Averages=4, and MAT=128x128. A single A0 map was collected with Bvalues=[50,100,150,200,400,600,800,1000,2000,3000] in 3 directions. Post-contrast T1 weighted images were collected following the injection of Omniscan contrast agent using the same sequence as the pre-contrast. Analysis: Pre- and post-contrast T1 imaging was processed using IB Delta Suite to generate standardized Delta T1 maps for true contrast-based enhancement. The DW imaging was processed using the 4 models outlined in Figure 1. ADC, DDC, Alpha, Dt, Dp, fp, Dk, and Kurt maps were generated using AFNI and FSL software. Delta T1, pre-contrast T2, and standard ADC maps were used to identify subjects with abscesses and to select ROIs for further analysis. ROIs were generated within the core (T2 hyperintensity, ADC hypointensity), the capsule (Delta T1 hyperintensity, T2 hypointensity), and the surrounding edema (T2 and ADC hyperintensity). An additional ROI was drawn within normal appearing grey mater (NAGM). One-way ANOVA tests were performed to identify differences in the diffusion parameters between the 3 abscess ROIs and the NAGM (a=.05). One-way ANOVA tests were also used to determine differences between diffusion coefficients from the advanced models and ADC from the standard model within the 3 abscess ROIs (a=.05).Results
Of the 40 rats inoculated with pathogens, imaging for 11 indicated abscess formation. Sample diffusion parameter maps are shown in Figure 2, in addition to the standard imaging. Results from the statistical analyses are shown in Figures 4 and 5.Discussion
Qualitatively, there appears to be a high degree of spatial correlation between the different parameter maps. Several of the advanced diffusion parameters seemed to provide improved contrast between the different abscess regions and the NAGM. DDC and Dk seemed to perform well compared to the standard ADC, as can be seen in Figure 2. Beyond diffusivity, the Alpha, fp, and Kurt properties presented statistically significant changes between the ROIs, which suggests that these properties may also be used in the assessing different properties of cerebral abscesses.Conclusion
This analysis validates the use of advanced diffusion modeling with respect to abscess imaging in two ways. First, these parameter maps frequently provided greater contrast than previously seen with standard imaging. Second, these models generate additional feature maps that can provide a more sophisticated understanding of the underlying abscess structure. Monitoring these parameters over the course of treatment, for example, could improve patient outcome.Acknowledgements
Funding was provided by NIH/NCI R01CA082500, the Daniel M. Soref Charitable Trust, and the Musella Foundation.References
1. Muzumdar D, Jhawar S, Goel A. Brain abscess: An overview. Int J Surg. 2011;9:136–44
2. Bakan, Selim et al. “Perianal Fistula With and Without Abscess: Assessment of Fistula Activity Using Diffusion-Weighted Magnetic Resonance Imaging.” Iranian Journal of Radiology 12.4 (2015): e29084. PMC. Web. 9 Nov. 2017.
3. Bennett, K. M., Schmainda, K. M., Bennett (Tong), R., Rowe, D. B., Lu, H. and Hyde, J. S. (2003), Characterization of continuously distributed cortical water diffusion rates with a stretched-exponential model. Magn. Reson. Med., 50: 727–734. doi:10.1002/mrm.10581
4. Separation of diffusion and perfusion in intravoxel incoherent motion MR imaging.D Le Bihan, E Breton, D Lallemand, M L Aubin, J Vignaud, and M Laval-JeantetRadiology 1988 168:2, 497-505
5. Jensen, J. H., Helpern, J. A., Ramani, A., Lu, H. and Kaczynski, K. (2005), Diffusional kurtosis imaging: The quantification of non-gaussian water diffusion by means of magnetic resonance imaging. Magn. Reson. Med., 53: 1432–1440. doi:10.1002/mrm.20508
Figures