1654
Principal component analysis for model-free denoising of multi b-value diffusion-weighted images1Joint department of physics, Institute of Cancer Research and The Royal Marsden NHS Foundation Trust, London, United Kingdom, 2CRUK Cancer Imaging Centre, Institute of Cancer Research and The Royal Marsden NHS Foundation Trust, London, United Kingdom, 3Division of Radiotherapy & Imaging, Institute of Cancer Research and The Royal Marsden NHS Foundation Trust, London, United Kingdom
Synopsis
We introduce principal component analyses (PCA) as a denoising technique for diffusion-weighted MRI (DWI) that is independent of the diffusion attenuation model. PCA denoises DWI data using only informative components while removing noisy ones. We show that it outperforms model-based denoising in simulations as well as in vivo. In simulations, PCA-denoising resulted in smaller systematic errors, while random errors were similar. In vivo, PCA-denoising rendered less noisy images and when
Introduction
Despite the utility of tumour characterisation using quantitative maps from intravoxel incoherent motion (IVIM) modelled diffusion-weighted MRI (DWI), clinicians often prefer defining regions of interest on high b-value DW-images. To improve signal-to-noise ratio (SNR), these images are often denoised using model-based synthetic MRI, where a diffusion model is fitted to the dataset and a denoised image is obtained directly from the model. However, as this approach is model dependent, systematic errors occur when the model is incorrect. Here, we present principal component analysis (PCA) as a tool for denoising DWI data model-free. We hypothesize that the developed PCA-denoising toolkit outperforms synthetic MRI.Methods
PCA splits up potentially correlated observations into linearly uncorrelated orthogonal directions, called principal components (PCs). The first PC contains the largest variation, and each subsequent PC contains the largest remaining variation. In DWI, noise is random, whereas the signal decay is similar between voxels. Therefore, when PCA is applied, the informative signal decay tends to occur in the first PCs, whereas higher PCs contain noise.
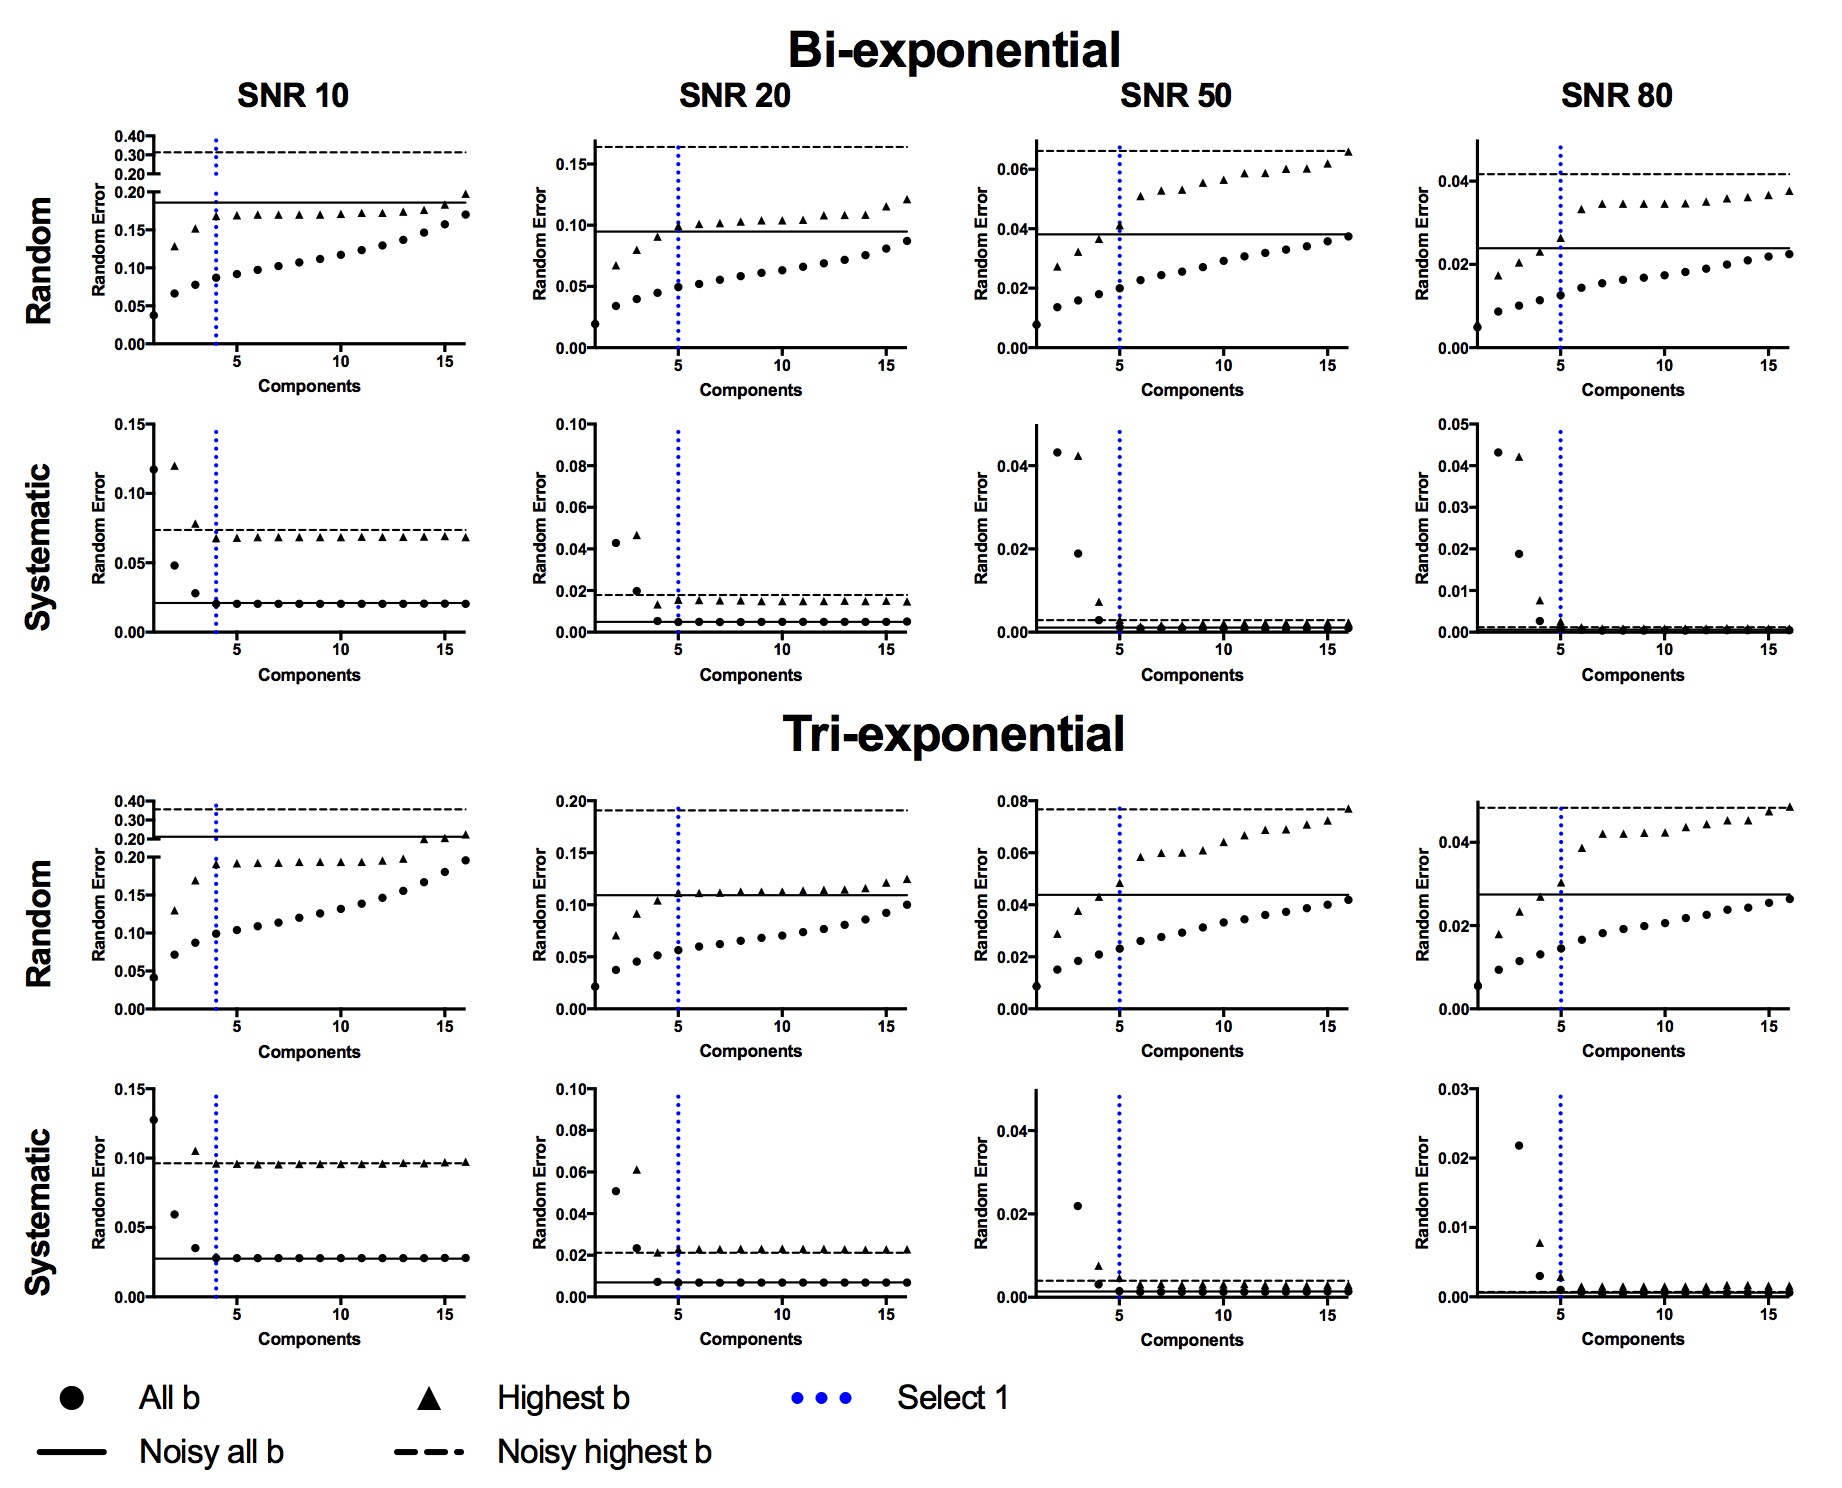
To denoise DWI datasets, we reconstructed the DWI dataset taking only the first PCs into account (and their associated weights per voxel). The following algorithm automatically selected the informative PCs. The autocorrelation of the PC with itself was calculated for each PC. The informative part of the autocorrelation of delay 0 was estimated by fitting a 2nd order polynomial to the autocorrelation with delays of 1–15 b-values.1 All PCs up to the first with negative informative part were used to compute the denoised images.
Simulations
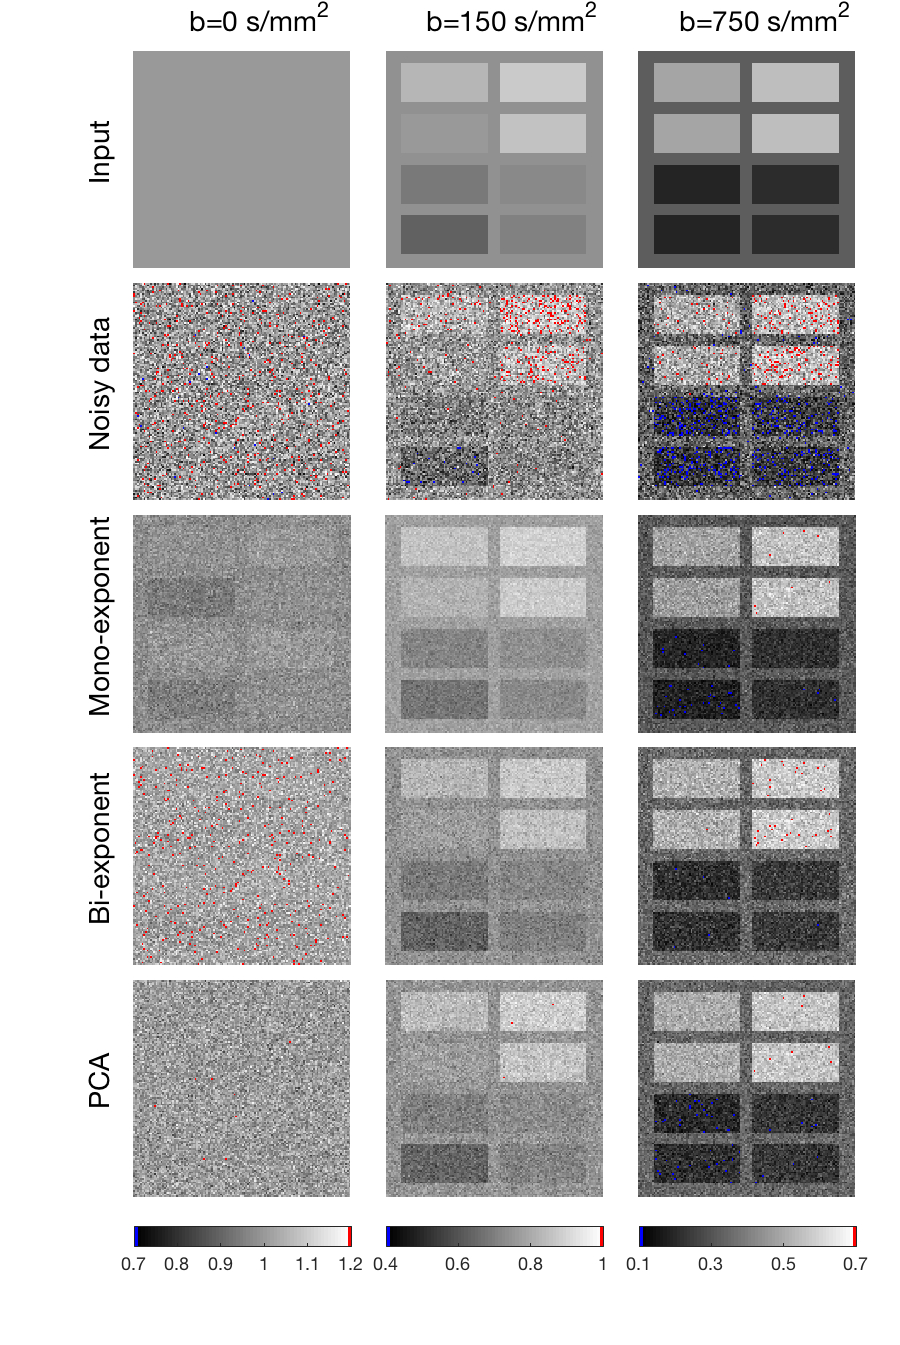
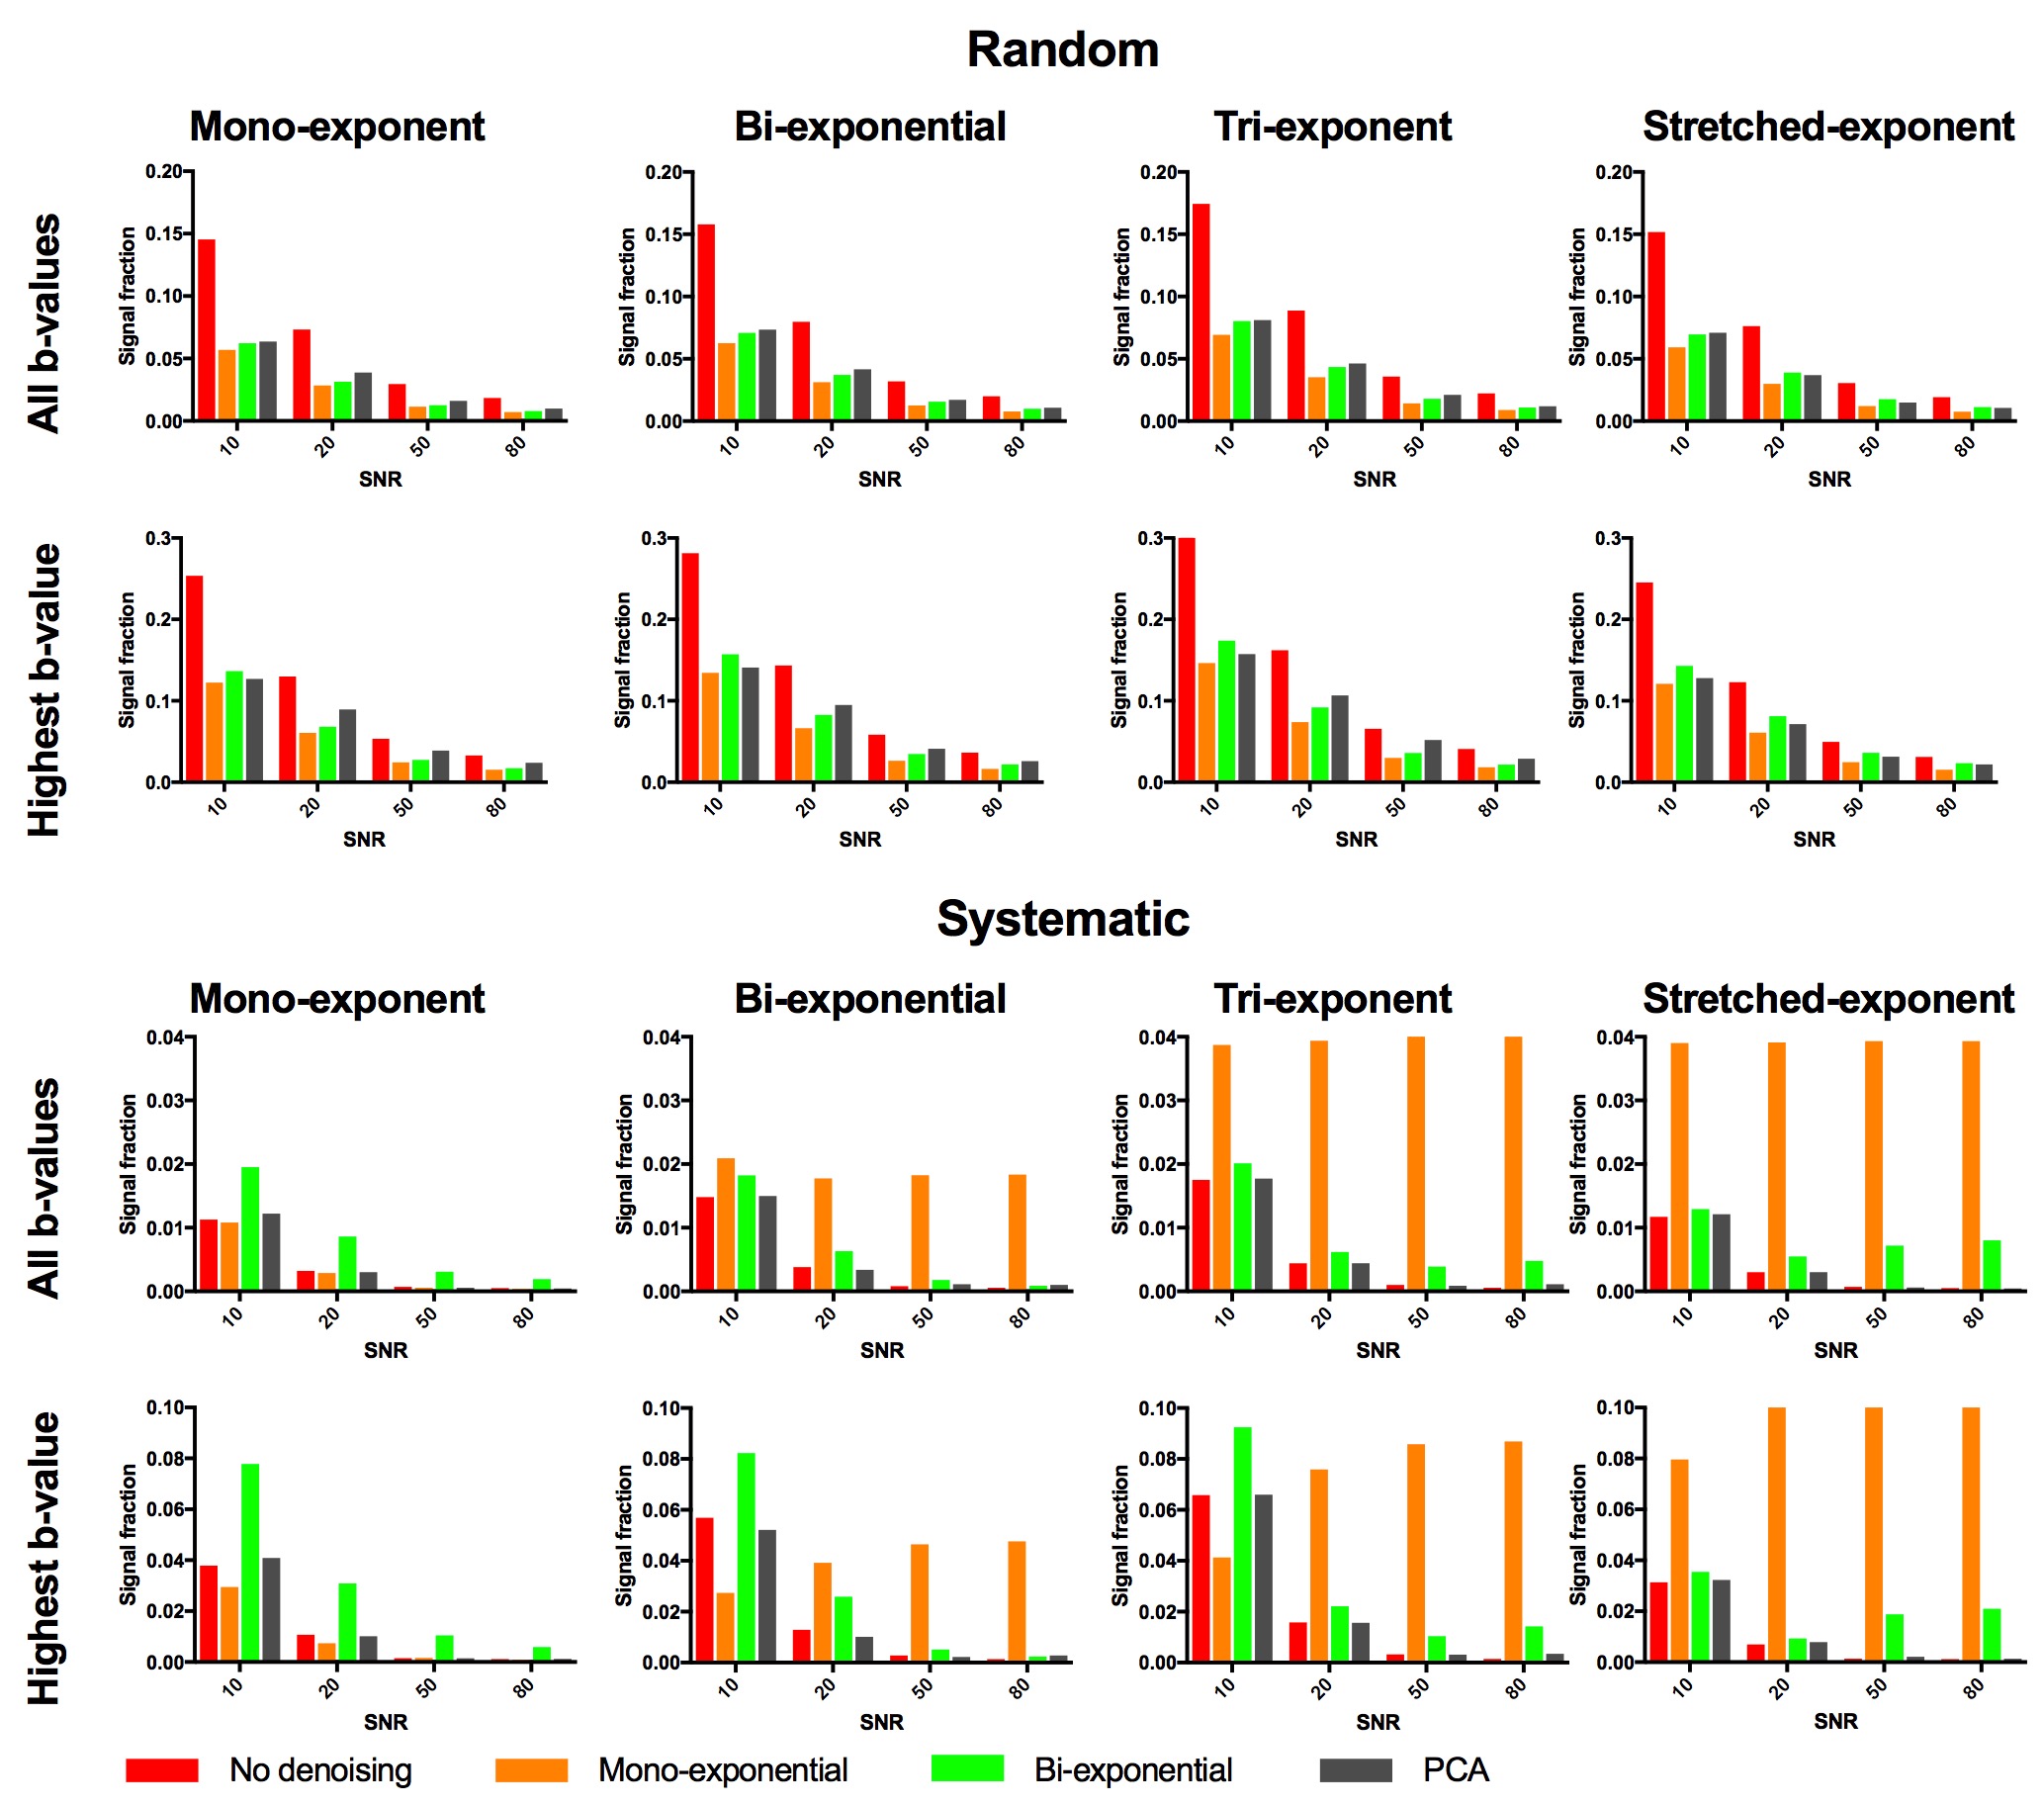
We compared PCA-denoising with synthetic MRI using mono-exponential and bi-exponential (IVIM-based) models. We simulated four datasets (17 b-values; 0–750 s/mm2) consisting of signal decay using a mono-exponential, bi-exponential2, tri-exponential3 and stretched-exponential4 model with different parameter value combinations in each image sub-panel (i.e. Fig. 1).5 Rician noise with SNR at b=0 s/mm2 of 10, 20, 50 and 80 was added. The three denoising approaches were applied. The random error was defined as the standard deviation of the signal within each sub-panel, whereas systematic error was defined as the difference between the mean signal per panel and the noise-free simulated signal.
In vivo
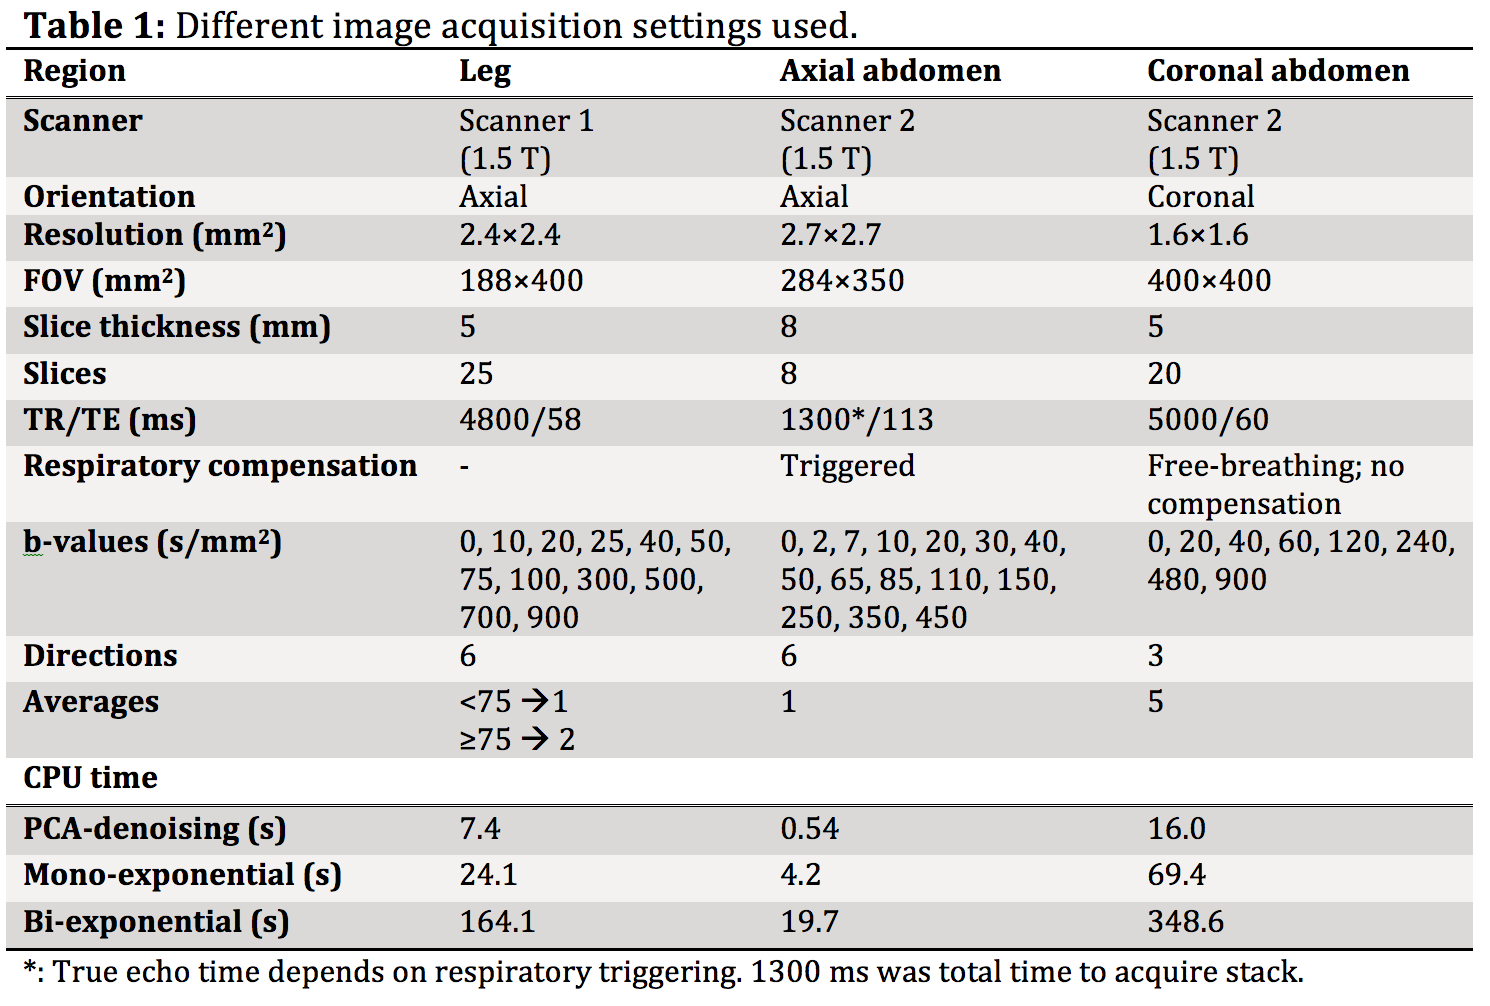
Several datasets from healthy volunteers, obtained with different acquisition protocols, scanners and of different anatomical regions (Table 1) were denoised using PCA-denoising and synthetic MRI (bi-exponential) and were visually compared.
Results
Simulations
Random errors increased with increasing number of PCs (Fig 2), whereas systematic errors decreased down to a stable value. The autocorrelation-based algorithm selected the lowest number of PCs at which the systematic error was minimal in six out of eight simulations and selected one additional component in two simulations (Fig 2). PCA-denoising resulted in images with similar random noise and decreased systematic noise compared to both synthetic MRI approaches (Figs 1 and 3).
In vivo
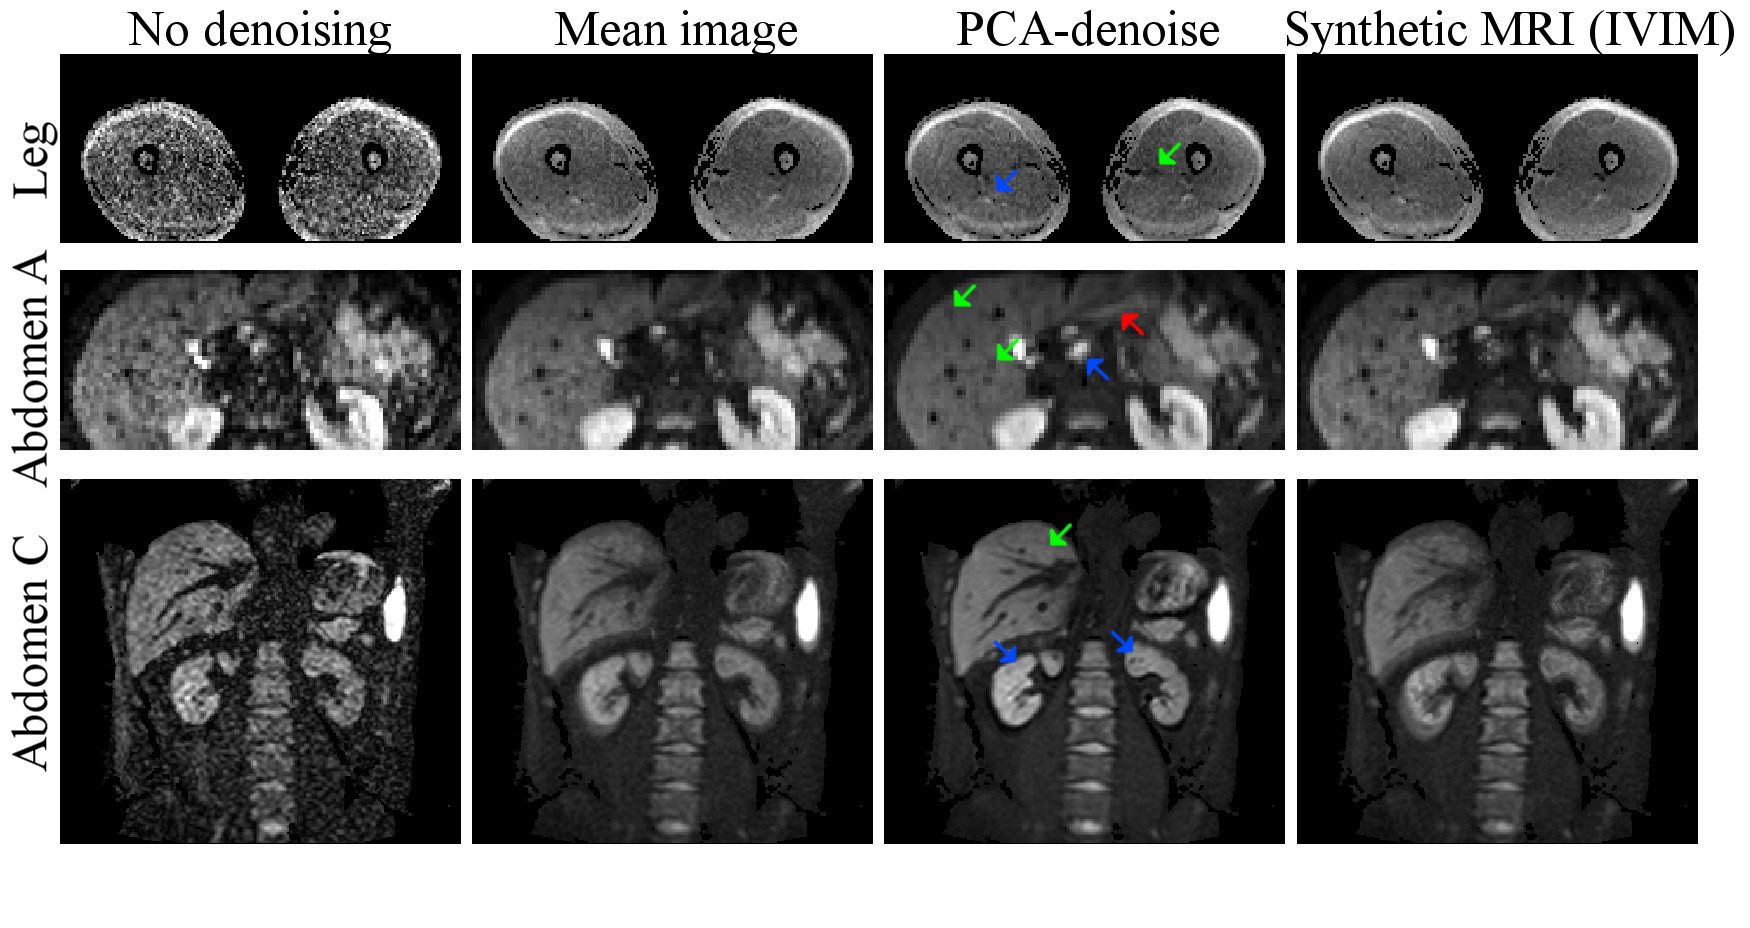
In vivo (Fig 4) PCA-denoising yielded images of at least similar (leg) or better (abdomen) SNR than synthetic MRI. In vivo we could not quantify systematic errors. It appears that PCA-denoising preserved more details than synthetic MRI. PCA-denoising was 26.8 (21.8–36.5) times faster than bi-exponential synthetic MRI (Table 1).
Discussion
PCA-denoising allows for model-free denoising of DWI images. In simulations it performs as well as synthetic MRI regarding random errors, but outperforms synthetic MRI considering systematic errors. In two very different anatomical locations, PCA-denoising resulted in sharp denoised images.
Many denoising algorithms rely on a spatial kernel that can introduce blurring.6–9 Contrary to these models, PCA-denoising and synthetic MRI do not use spatial information. However, motion in the original data may result in blurring. For PCA-denoising, the PCs are able to account for motion effects and, as the technique generates one denoised image per input the denoised images, it suffers less from motion blur (Fig 4). This effect was previously utilized to register repeated MRI.10,11 Synthetic MRI generates one blurred image per b-value (Fig 4). We found that PCA-denoising worked better when images were not averaged per b-value before denoising, potentially as a result of this effect.
Since the bias effect of Rician noise was not taken into account, the systematic error due to Rician noise will remain in the denoised data. Since PCA-denoising resulted in similar systematic error as non-denoised images, PCA-denoising allows for decreasing the random noise without introducing additional systematic errors. Synthetic MRI did introduce additional systematic errors when the model is incomplete, i.e. the mono-exponential model had large systematic errors in the non-mono-exponential simulations. In vivo, this could lead to certain pathologies being obscured/misinterpreted.
Conclusion
Multiple b-value DWI images can benefit from being denoised fast and model-free using PCA-denoising.Acknowledgements
This work was supported by Cancer Research UK Programme Grants C33589/A19727 and C7224/A23275. CRUK and EPSRC support to the Cancer Imaging Centre at ICR and RMH in association with MRC and Department of Health C1060/A10334, C1060/A16464 and NHS funding to the NIHR Biomedical Research Centre and the Clinical Research Facility in Imaging. This report is independent research funded partially by the National Institute for Health Research. The views expressed in this publication are those of the author(s) and not necessarily those of the NHS, the National Institute for Health Research or the Department of Health.References
1. Balvay D, Kachenoura N, Espinoza S, et al. Signal-to-Noise Ratio Improvement in Dynamic Contrast-enhanced CT and Purpose. Radiology. 2011;258(24):435–445.
2. Le Bihan D. Intravoxel incoherent motion imaging using steady-state free precession. Magn. Reson. Med. 1988;7(3):346–351.
3. van der Bel R, Gurney-Champion OJ, Froeling M, et al. A tri-exponential model for intravoxel incoherent motion analysis of the human kidney: in silico and during pharmacological renal perfusion modulation. Eur. J. Radiol. 2017;91(12):168–174.
4. Bennett KM, Schmainda KM, Bennett RT, et al. Characterization of continuously distributed cortical water diffusion rates with a stretched-exponential model. Magn. Reson. Med. 2003;50(4):727–734
5. While PT. A comparative simulation study of bayesian fitting approaches to intravoxel incoherent motion modeling in diffusion-weighted MRI. Magn. Reson. Med. 2017;0:1–15.
6. Bustin A, Ferry P, Codreanu A, et al. Impact of denoising on precision and accuracy of saturation-recovery-based myocardial T1 mapping. J. Magn. Reson. Imaging. 2017.
7. Manjón J V, Coupé P, Martí-Bonmatí L, et al. Adaptive non-local means denoising of MR images with spatially varying noise levels. J. Magn. Reson. Imaging. 2010;31(1):192–203.
8. Manjón J V., Coupé P, Concha L, et al. Diffusion Weighted Image Denoising Using Overcomplete Local PCA. PLoS One. 2013;8(9):1–12.
9. Manjón J V., Coupé P, Buades A. MRI noise estimation and denoising using non-local PCA. Med. Image Anal. 2015;22(1):35–47.
10. Melbourne a, Atkinson D, White MJ, et al. Registration of dynamic contrast-enhanced MRI using a progressive principal component registration (PPCR). Phys. Med. Biol. 2007;52(17):5147–5156.
11. Melbourne A, Hawkes D, Atkinson D. Non-Rigid Registration of Diffusion Weighted MRI using Progressive Principal Component Registration (PPCR). In: ISMRM.Vol Toronto.; 2008:3097
Figures