1647
Investigating the effect of gradient nonlinearities on Diffusional Kurtosis Imaging parameters: Results from the Human Connectome Project1Image Sciences Institute, University Medical Center Utrecht and Utrecht University, Utrecht, Netherlands
Synopsis
Gradient field nonlinearities in diffusion-weighted MRI may lead to systematic errors in the diffusion metrics. Despite previous works highlighting the adverse impact of gradient field nonuniformities on diffusion-weighted MRI, these effects are usually neglected and left uncorrected. In this work we use simulations and real data from the Human Connectome Project to investigate the effect of gradient field nonlinearities on the measures from Diffusional Kurtosis Imaging. Our results demonstrated that in general, the effect for the diffusion tensor metrics is larger than the effect for diffusional kurtosis metrics. However, the effect of the gradient nonlinearities on the kurtosis metrics should not be neglected.
Background and Purpose
The effect of magnetic field gradient nonlinearities has been shown as a confounding factor in diffusion-weighted MRI (DWI)1–4. However, these effects are usually neglected during DWI data processing leading to potential errors in quantification of the microstructural parameters3–6. In this work, we utilize the data and the correction technique from the Human Connectome Project (HCP)7, 8 to investigate the effect of gradient nonlinearity correction (GNC) on Diffusional Kurtosis Imaging (DKI)9–12 and Diffusion Tensor Imaging (DTI)13 parameters. To this end, we used simulations along with the experimental data and statistical analyses to highlight the adverse effects.Methods
We use the methodology presented in [2] to model the nonlinearities in the magnetic field gradients:$$g_{act}(r)=L(r)g_{nom}(r)$$,in which $$$\bf{g}_{act}(\bf{r})$$$ and $$$\bf{g}_{nom}(\bf{r})$$$ represent the actual and nominal gradients at position $$$r$$$ and $$$L(\bf{r})$$$ denotes the gradient coil tensor at position $$$\bf{r}$$$, which can be used to calculate the actual gradient vector for each voxel.
Synthetic data: The diffusion MRI data were simulated using a numerical phantom consistent with the HCP data with 60 gradient directions (b = 1000 and 2000 s/mm2), 6 b=0 images and various SNR levels (10, 20, 30 and 50). To simulate the gradient nonlinearities, a gradient coil tensor was downloaded from the HCP dataset which was used to obtain the actual gradients at each voxel. For each SNR level, 50 noise realizations were simulated using the actual gradient vectors. Estimation of DTI and DKI parameters from DKI model for both corrected and uncorrected data were performed using Weighted-Linear Least Square (WLLS)14 approach in ExploreDTI15 with constraints on kurtosis tensor16 and the diffusion metrics were extracted. The ground truth (GT) parameters were calculated from the noise-less dataset with corrected gradients.
Real data: We used the preprocessed8 multi-shell DWI data (b=1000, 2000 and 3000 s/mm2) collected from 410 subjects with 90 distinctive diffusion weighting gradient directions and 6 b=0 acquisitions per shell (288 volumes in total). Estimation of DKI parameters for each subject was performed in a similar way as for the synthetic data.
Statistical comparison: The effect of GNC on DKI and DTI scalars was evaluated with paired t-tests in PALM (Permutation Analysis of Linear Models)17 version alpha104. Every metrics in every subject was compared with and without GNC to highlight if GNC has led to higher or smaller values after the correction. Multiple comparisons using family-wise error rate (FWER) adjustment was applied and the pcorr-values smaller than 0.05 indicated significance. The tail approximation was used to speed up the calculation of the p-values18. Effect sizes were provided for the significant voxels. TFCE (Threshold-Free Cluster Enhancement)19 based improvement of the p-values was further applied.
Results
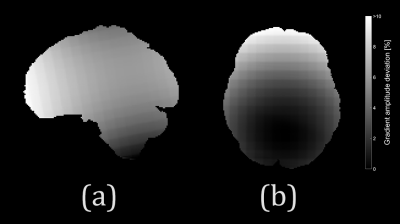
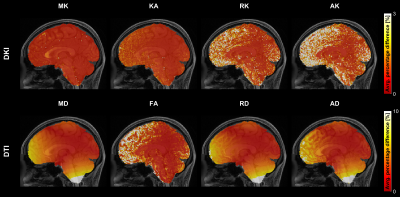
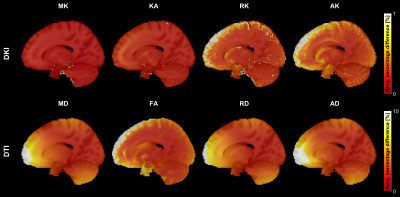
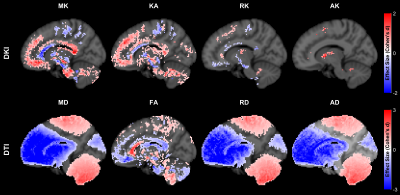
Fig.1 shows the spatial pattern of the actual gradient amplitudes extracted from a sample HCP subject, which has been used for simulations.The spatial pattern indicates that the voxels closer to the isocenter of the coil are less affected. Fig.2 shows average percentage difference for all the DKI and DTI metrics from simulations with SNR = 30, which indicate that (i) the spatial pattern of the gradient inhomogeneities translates into errors in the metrics and (ii) the average percentage differences for DTI metrics are larger in comparison to the DKI metrics. Fig.3 shows the average percentage difference for all the DKI and DTI metrics from real datasets transformed to MNI152 space, which confirms that the percentage difference for DTI metrics is larger than DKI ones. Fig.4 shows the results from the paired t-tests for all the DKI and DTI metrics, indicating that (i) the patterns of the significant voxels for diffusivity metrics (MD, RD, AD) follow the pattern of gradient inhomogeneities, (ii) effect sizes are larger for DTI metrics compared to DKI metrics and (iii) the number of significant voxels for DTI is more, which implies that the effect of gradient nonlinearities are more pronounced in DTI metrics.Discussion and Conclusion
In this work, we explored the effect of gradient nonlinearities on DTI and DKI metrics using the simulations and real data from HCP. We utilized the percentage difference in metrics as a tool to evaluate and compare the effect of gradient nonlinearities among diffusion metrics. Our results demonstrated that in general, the percentage differences for DTI metrics were larger in comparison to DKI metrics. We also used voxel-wise paired t-tests to evaluate the significance of the effect for real data. The results from the t-tests confirm that the extent of the effect is larger for DTI metrics compared to DKI ones. The results from this study indicated that the effect of gradient nonlinearities can result in errors in the diffusion measures from DKI model.Acknowledgements
This research is supported by VIDI Grant 639.072.411 from the Netherlands Organisation for Scientific Research (NWO).References
1. Conturo, T.E., McKinstry, R.C., Aronovitz, J.A., Neil, J.J.: ‘Diffusion MRI: Precision, accuracy and flow effects’NMR Biomed., 1995, 8, (7), pp. 307–332.
2. Bammer, R., Markl, M., Barnett, A., et al.: ‘Analysis and generalized correction of the effect of spatial gradient field distortions in diffusion-weighted imaging’Magn. Reson. Med., 2003, 50, (3), pp. 560–569.
3. Sotiropoulos, S.N., Jbabdi, S., Xu, J., et al.: ‘Advances in diffusion MRI acquisition and processing in the Human Connectome Project’Neuroimage, 2013, 80, pp. 125–143.
4. Borkowski, K., Kłodowski, K., Figiel, H., Krzyżak, A.T.: ‘A theoretical validation of the B-matrix spatial distribution approach to diffusion tensor imaging’Magn. Reson. Imaging, 2017, 36, pp. 01–06.
5. Janke, A., Zhao, H., Cowin, G.J., Galloway, G.J., Doddrell, D.M.: ‘Use of spherical harmonic deconvolution methods to compensate for nonlinear gradient effects on MRI images’Magn. Reson. Med., 2004, 52, (1), pp. 115–122.
6. Malyarenko, D.I., Ross, B.D., Chenevert, T.L.: ‘Analysis and correction of gradient nonlinearity bias in apparent diffusion coefficient measurements’Magn. Reson. Med., 2014, 71, (3), pp. 1312–1323.
7. Van Essen, D.C., Ugurbil, K., Auerbach, E., et al.: ‘The Human Connectome Project: A data acquisition perspective’Neuroimage, 2012, 62, (4), pp. 2222–2231.
8. Glasser, M.F., Sotiropoulos, S.N., Wilson, J.A., et al.: ‘The minimal preprocessing pipelines for the Human Connectome Project’Neuroimage, 2013, 80, pp. 105–124.
9. Jensen, J.H., Helpern, J.A., Ramani, A., Lu, H., Kaczynski, K.: ‘Diffusional kurtosis imaging: The quantification of non-gaussian water diffusion by means of magnetic resonance imaging’Magn. Reson. Med., 2005, 53, (6), pp. 1432–1440.
10. Jensen, J.H., Helpern, J.A.: ‘MRI quantification of non-Gaussian water diffusion by kurtosis analysis’NMR Biomed., 2010, 23, (7), pp. 698–710.
11. Fieremans, E., Jensen, J.H., Helpern, J.A.: ‘White matter characterization with diffusional kurtosis imaging.’Neuroimage, 2011, 58, (1), pp. 177–88.
12. Lu, H., Jensen, J.H., Ramani, A., Helpern, J.A.: ‘Three-dimensional characterization of non-gaussian water diffusion in humans using diffusion kurtosis imaging.’NMR Biomed., 2006, 19, (2), pp. 236–47.
13. Basser, P.J., Mattiello, J., LeBihan, D.: ‘MR diffusion tensor spectroscopy and imaging.’Biophys J, 1994, 66, (1), pp. 259–267.
14. Veraart, J., Sijbers, J., Sunaert, S., Leemans, A., Jeurissen, B.: ‘Weighted linear least squares estimation of diffusion MRI parameters: Strengths, limitations, and pitfalls’Neuroimage, 2013, 81, pp. 335–346.
15. Leemans, A., Jeurissen, B., Sijbers, J., Jones, D.: ‘ExploreDTI: a graphical toolbox for processing, analyzing, and visualizing diffusion MR data’Proc. 17th Sci. Meet. Int. Soc. Magn. Reson. Med., 2009, 17, (2), p. 3537.
16. Tabesh, A., Jensen, J.H., Ardekani, B.A., Helpern, J.A.: ‘Estimation of tensors and tensor-derived measures in diffusional kurtosis imaging’Magn. Reson. Med., 2011, 65, (3), pp. 823–836.
17. Winkler, A.M., Webster, M.A., Brooks, J.C., Tracey, I., Smith, S.M., Nichols, T.E.: ‘Non-parametric combination and related permutation tests for neuroimaging’Hum. Brain Mapp., 2016, 37, (4), pp. 1486–1511.
18. Winkler, A.M., Ridgway, G.R., Douaud, G., Nichols, T.E., Smith, S.M.: ‘Faster permutation inference in brain imaging’Neuroimage, 2016, 141, pp. 502–516.
19. Smith, S.M., Nichols, T.E.: ‘Threshold-free cluster enhancement: Addressing problems of smoothing, threshold dependence and localization in cluster inference’Neuroimage, 2009, 44, (1), pp. 83–98.
Figures


