1645
Quantifying deviations from gradient design in multi-platform longitudinal DWI QC for on-scanner correction of diffusion weighting bias1Radiology, University of Michigan, Ann Arbor, MI, United States, 2Radiology and Biomedical Imaging, University of California San Francisco, San Francisco, CA, United States, 3GE Global Research, Niskayuna, NY, United States, 4Siemens Medical Solutions, Cary, NC, United States, 5Philips Research Laboratories, Cambridge, MA, United States, 6Philips Research Laboratories, Hamburg, Germany, 7Philips MR Clinical Science, Best, Netherlands, 8Radiology, Massachusetts General Hospital, Boston, MA, United States, 9Radiology and Radiological Science, John Hopkins University School of Medicine, Baltimore, MD, United States
Synopsis
The most practical correction of nonuniform diffusion weighting due to gradient nonlinearity would use scanner-specific gradient design information similar to current mitigation of geometric image distortions. To check the feasibility of this approach in a multi-center, multi-scanner setting, longitudinal DWI quality control studies using a quantitative diffusion phantom were performed on representative MRI platforms in collaboration with three vendors. Here we report preliminary results for proposed descriptive metrics that adequately reflect the amount and source of deviations from system gradient design to guide implementation of comprehensive bias correction for quantitative DWI applications.
Introduction
Effective correction of nonuniform diffusion weighting induced by gradient nonlinearity (GNL)1,2 relies on gradient characteristics known to vendors. The presence of eddy currents (EC) and object-dependent B0 shim variations may create local gradient fields causing deviation from the GNL model3,4. Longitudinal evaluation of spatially-dependent diffusion weighting bias for individual gradient channels relative to vendor-provided gradient models allows assessment of non-GNL bias contributions. This preliminary study describes quantitative metrics that effectively summarize observed longitudinal deviations from static GNL models and reflect their physical origin to inform appropriate bias correction.Methods
A quantitative diffusion phantom5 was scanned on three clinical scanners (Sys1, Sys2 and Sys3 from three MRI vendors) on two dates (“d1” and “d2”, > 6 months apart) using shared protocol6. For phantom orientations along right-left (RL) and superior-inferior (SI) axes, axial and sagittal single spin-echo (SSE) DWI scans were performed, respectively, on all systems, with three diffusion gradient directions along primary magnet axes to characterize individual gradient channels (GRL, GAP, GSI). An additional double spin-echo (DSE) DWI variant was acquired on two systems (Sys2 and Sys3) to suppress EC-distortions7 and shim-induced gradient bias3. B0 maps were generated from multi-echo GRE scans with the same shim settings as for DWI to independently characterize chronic shim gradients.
The ADC mean and standard deviation (SD) were measured from circular regions-of-interest (ROIs) placed along the phantom tube for offsets between -180 and 180 mm. The measured ADC dependence on offset from magnet isocenter along RL and SI was fit to 4th order polynomials. The GNL-induced ADC bias with respect to the known ice-water value (ADC0=1.1x10⁻³ mm2/s), was modeled using vendor-provided gradient field parameters. Shim-gradient profiles were calculated as spatial derivatives of B0 maps along RL and SI axes. “Alignment” between the ADC profiles of individual gradient channels was quantified by Pearson correlation coefficient (R), and fractional “root-mean-square distance” was quantified by fRMS = RMS/ADC0. All data analysis was performed in Matlab (R2015b).
Results and Discussion
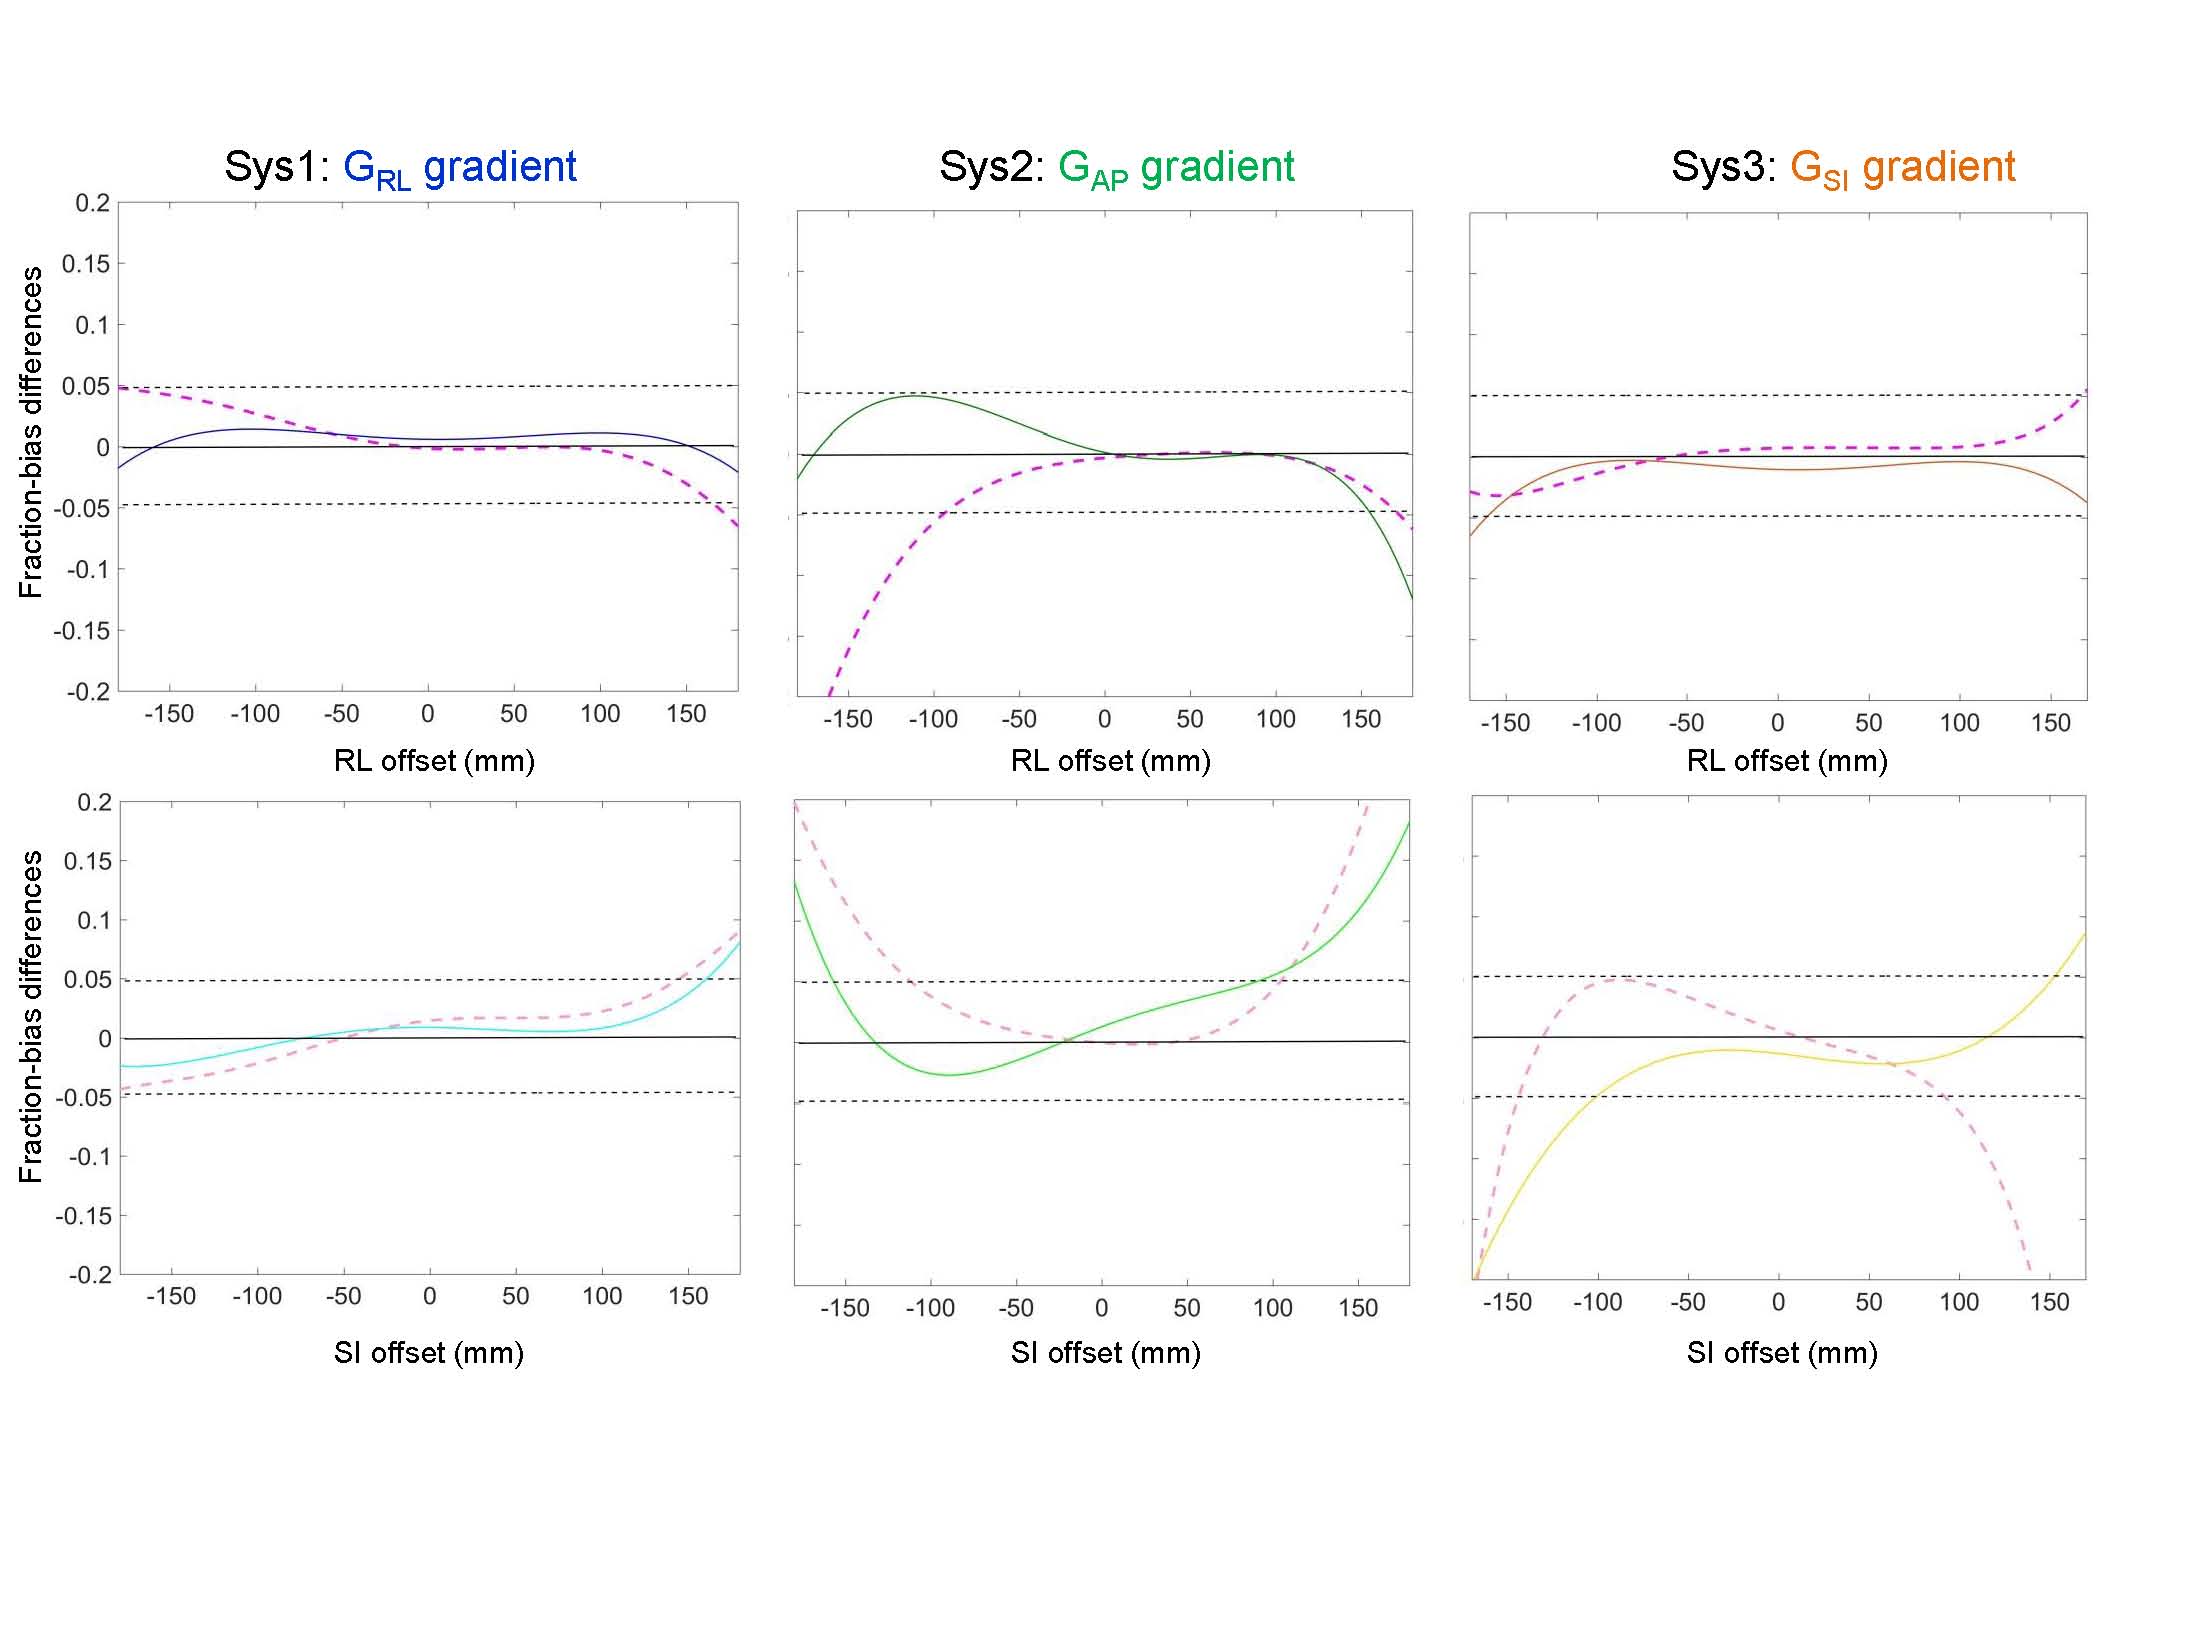
All systems showed spatial bias patterns (e.g., Figure 1) consistent with their GNL models for individual gradient channels (positive bias RL and negative bias SI) with the highest DWI nonuniformity for GRL and GAP gradients along SI direction (up to -45% absolute error). Platform-specific bias exhibited finite local asymmetries (Figs.1,2, solid curves) that deviated from ideal gradient models (Figs.1,2, dashed traces). Higher absolute longitudinal variability and deviation was along SI (Fig.2, bottom panes, lighter traces), while relative misalignment with respect to the model was higher for RL offsets (Fig.1, dark traces). For all systems, differences between longitudinal measurements (Fig.2, solid curves) did not exceed the deviations from their models (Fig.2, dashed traces.)
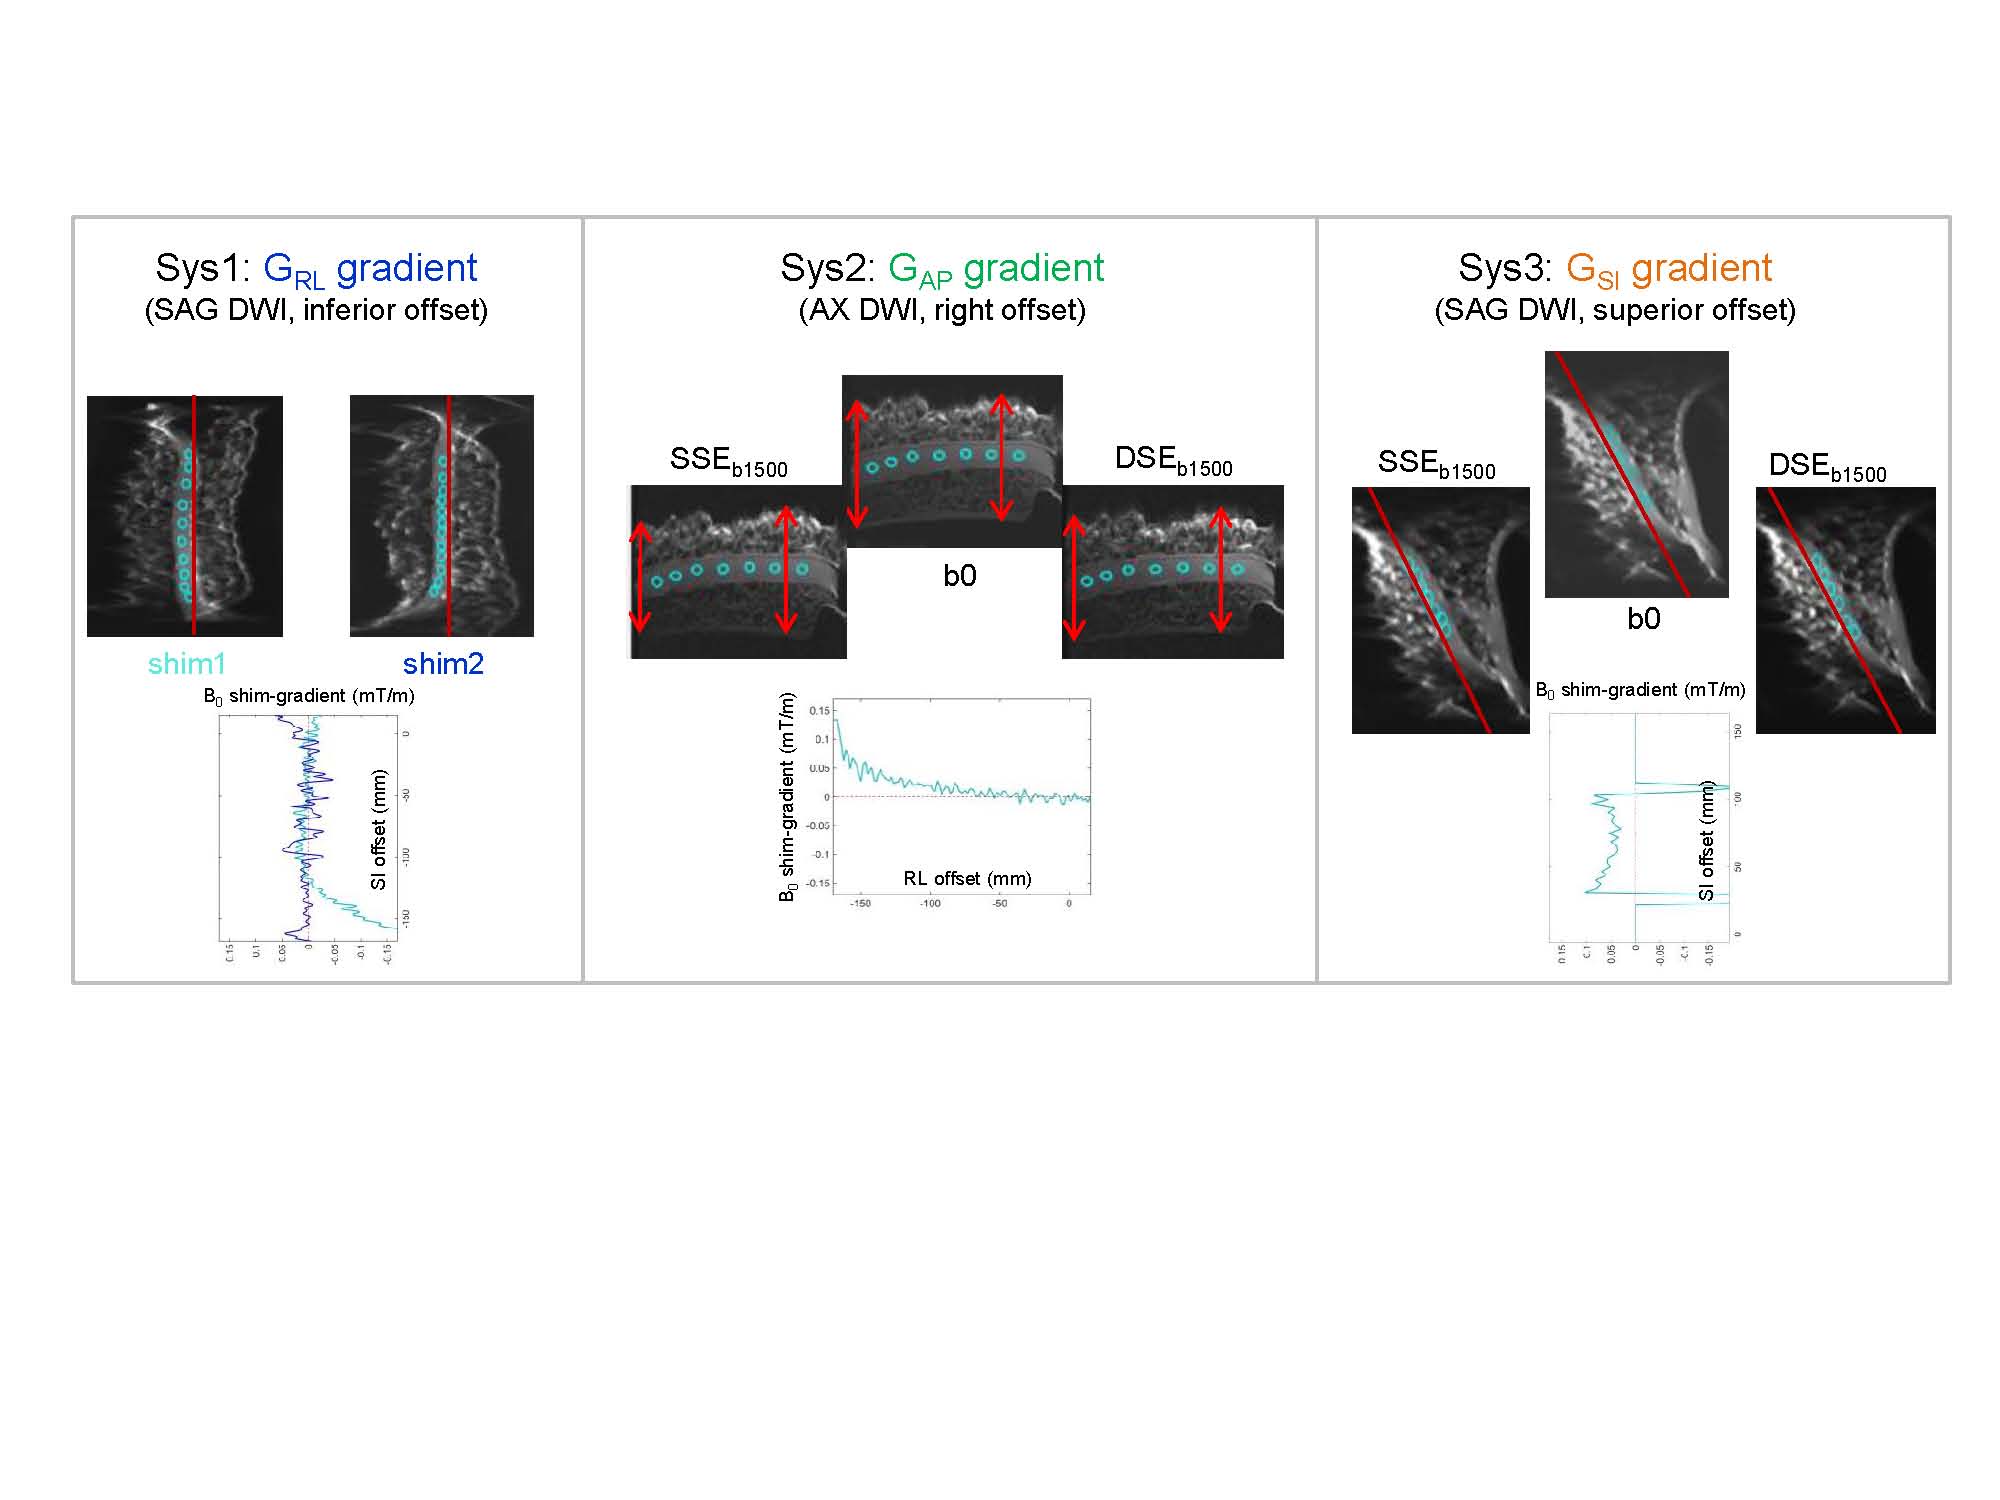
The offset dependence for ADC SD of Sys2 and Sys3 (Fig.1) correlated with the image distortions due to localized eddy current (Fig.3). Alternative acquisitions (DSE for Sys2 and Sys3) eliminated EC-induced distortions (Fig. 3) and uniformly reduced the measurement SDs. For SSE DWI, spatially localized EC led to artifactually enhanced signal density counteracting positive GNL bias for right offset position (Fig.1-3, Sys2) which was removed by DSE. Measured B0 gradients (sloped for Sys2 and constant < 0.1 mT/m for Sys3) were consistent with observed geometric distortions (“parabolic” for Sys2 and “linear” for Sys3, Fig.3) and their longitudinal changes (e.g., Fig.3, Sys1). Longitudinal changes in B0 shim gradients were higher than those in EC-induced distortions, suggesting the object-dependent origin for the former versus the system-dependent for the latter.
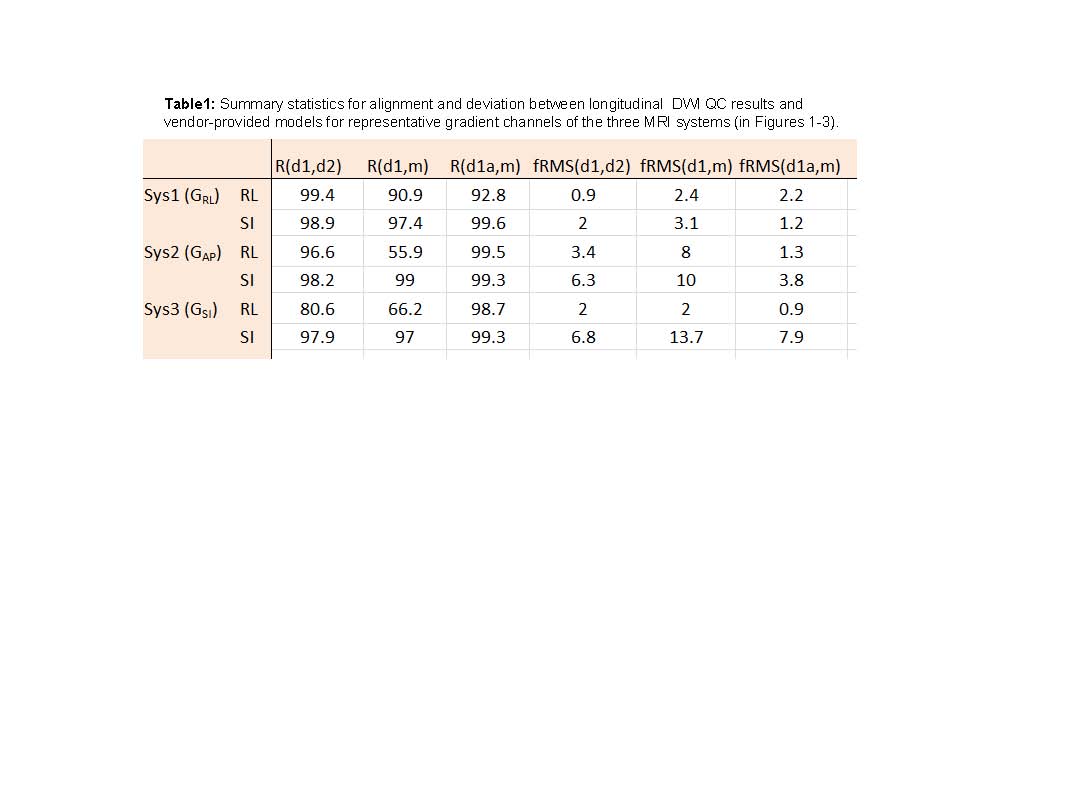
Consistent with Figures 1-3, higher correlation and lower fRMS were found between longitudinal measurements relative to the first (“d1”) measurement and the model (“m”). For each system, correlation with the model was higher for SI offsets, while fRMS was lower along RL (Table 1). Better alignment and smaller fRMS observed between longitudinal QC scans compared to the model confirmed repeatable measurements and suggested systematic sources for the residual deviations. Alternative (“d1a”) measurements (DSE for Sys2 and Sys3, and improved shim for Sys1) increased correlation and reduced fRMS to the model (Table 1). These improvements in R and fRMS metrics agreed with observed reduction of image distortions (Fig.3). Minor (order of SD) unexplained deviations persisted for “d1a” of Sys1 along RL and Sys2 along SI, while Sys3 SI deviation from model was in excess of longitudinal fRMS.
Summary
Gradient channel-specific deviations from GNL model exceeded longitudinal differences for all scanners. Relative systematic deviations were lower than GNL bias and more pronounced along RL compared to SI direction. The main cause for the deviations was the intensity and geometric distortions from either local eddy currents or residual shim-gradients. The measurement SD, correlation and RMS summary metrics accurately reported on non-GNL bias sources to guide their correction.Acknowledgements
National Institutes of Health Grants: R01CA190299, U01-CA166104, U01CA151235, U01CA140204, 5P30CA006973.References
1Bammer R, Markl M, Barnett A, et.al. Magn. Reson. Med. 2003 50:560-569;
2Malyarenko DI, Ross BD, Chenevert TL. Magn Reson Med. 2014; 71(3):1312-1323;
3Malyarenko DI, Newitt D, Wilmes LJ, et.al. Magn Reson Med. 2016; 75(3):1312-23;
4Tan ET, Marinelli L, Slavens ZW, et.al.J Magn Reson Imaging. 2013; 38(2):448-453;
5Chenevert TL, Craig JG, Ivancevic MK, et.al. J. Magn Reson Imaging 2011; 34:983-987;
6Chenevert TL and Malyarenko DI, “Longitudinal quantitative diffusion phantom QC protocol” (2016) https://www.researchgate.net/publication/316932001;
7Reese TG, Heid O, Weisskoff RM, Wedeen VJ. Magn Reson Med 2003;49(1):177-182.
Figures