1643
Single-scan Mapping of Mean Diffusivity Using the Incomplete Initial Nutation Diffusion Imaging (INDI) framework1Champalimaud Neuroscience Programme, Champalimaud Centre for the Unknown, Lisbon, Portugal, 2Centre for Medical Image Computing, Department of Computer Science, University College London, London, United Kingdom
Synopsis
Diffusion MRI techniques require at least two different acquisitions separated by a repetition time in order to map mean diffusivity. Thus, dynamic imaging techniques, such as diffusion functional MRI, which aim to measure rapid diffusivity changes, might provide results confounded by T2 changes over the repetition time. This study introduces and validates the INDI (incomplete initial nutation diffusion imaging) framework, which can be used to accelerate diffusion acquisition so that the reference and diffusion weighted images are acquired within a few tens of milliseconds of each other.
Introduction
Mapping diffusivities from diffusion MRI (dMRI) data requires at least two acquisitions separated by a repetition time1,2. Diffusion functional-MRI (dfMRI) requires however, rapid acquisitions for delivering information on variations in diffusivity with neural activity3,4. Furthermore, it would be desirable to acquire both b=0 and nonzero b-value experiments as close together as possible, to avoid T2 effects mislabelled as diffusion effects. Here, a novel methodology, termed incomplete initial nutation diffusion imaging (INDI) is presented, and shown to accelerate diffusion MRI acquisitions such that both reference and diffusion-weighted are acquired in a single-shot experiment with <50 ms spacing between b=0 and nonzero b-values with no sensitivity penalty when TR<~1.76T1.Methods
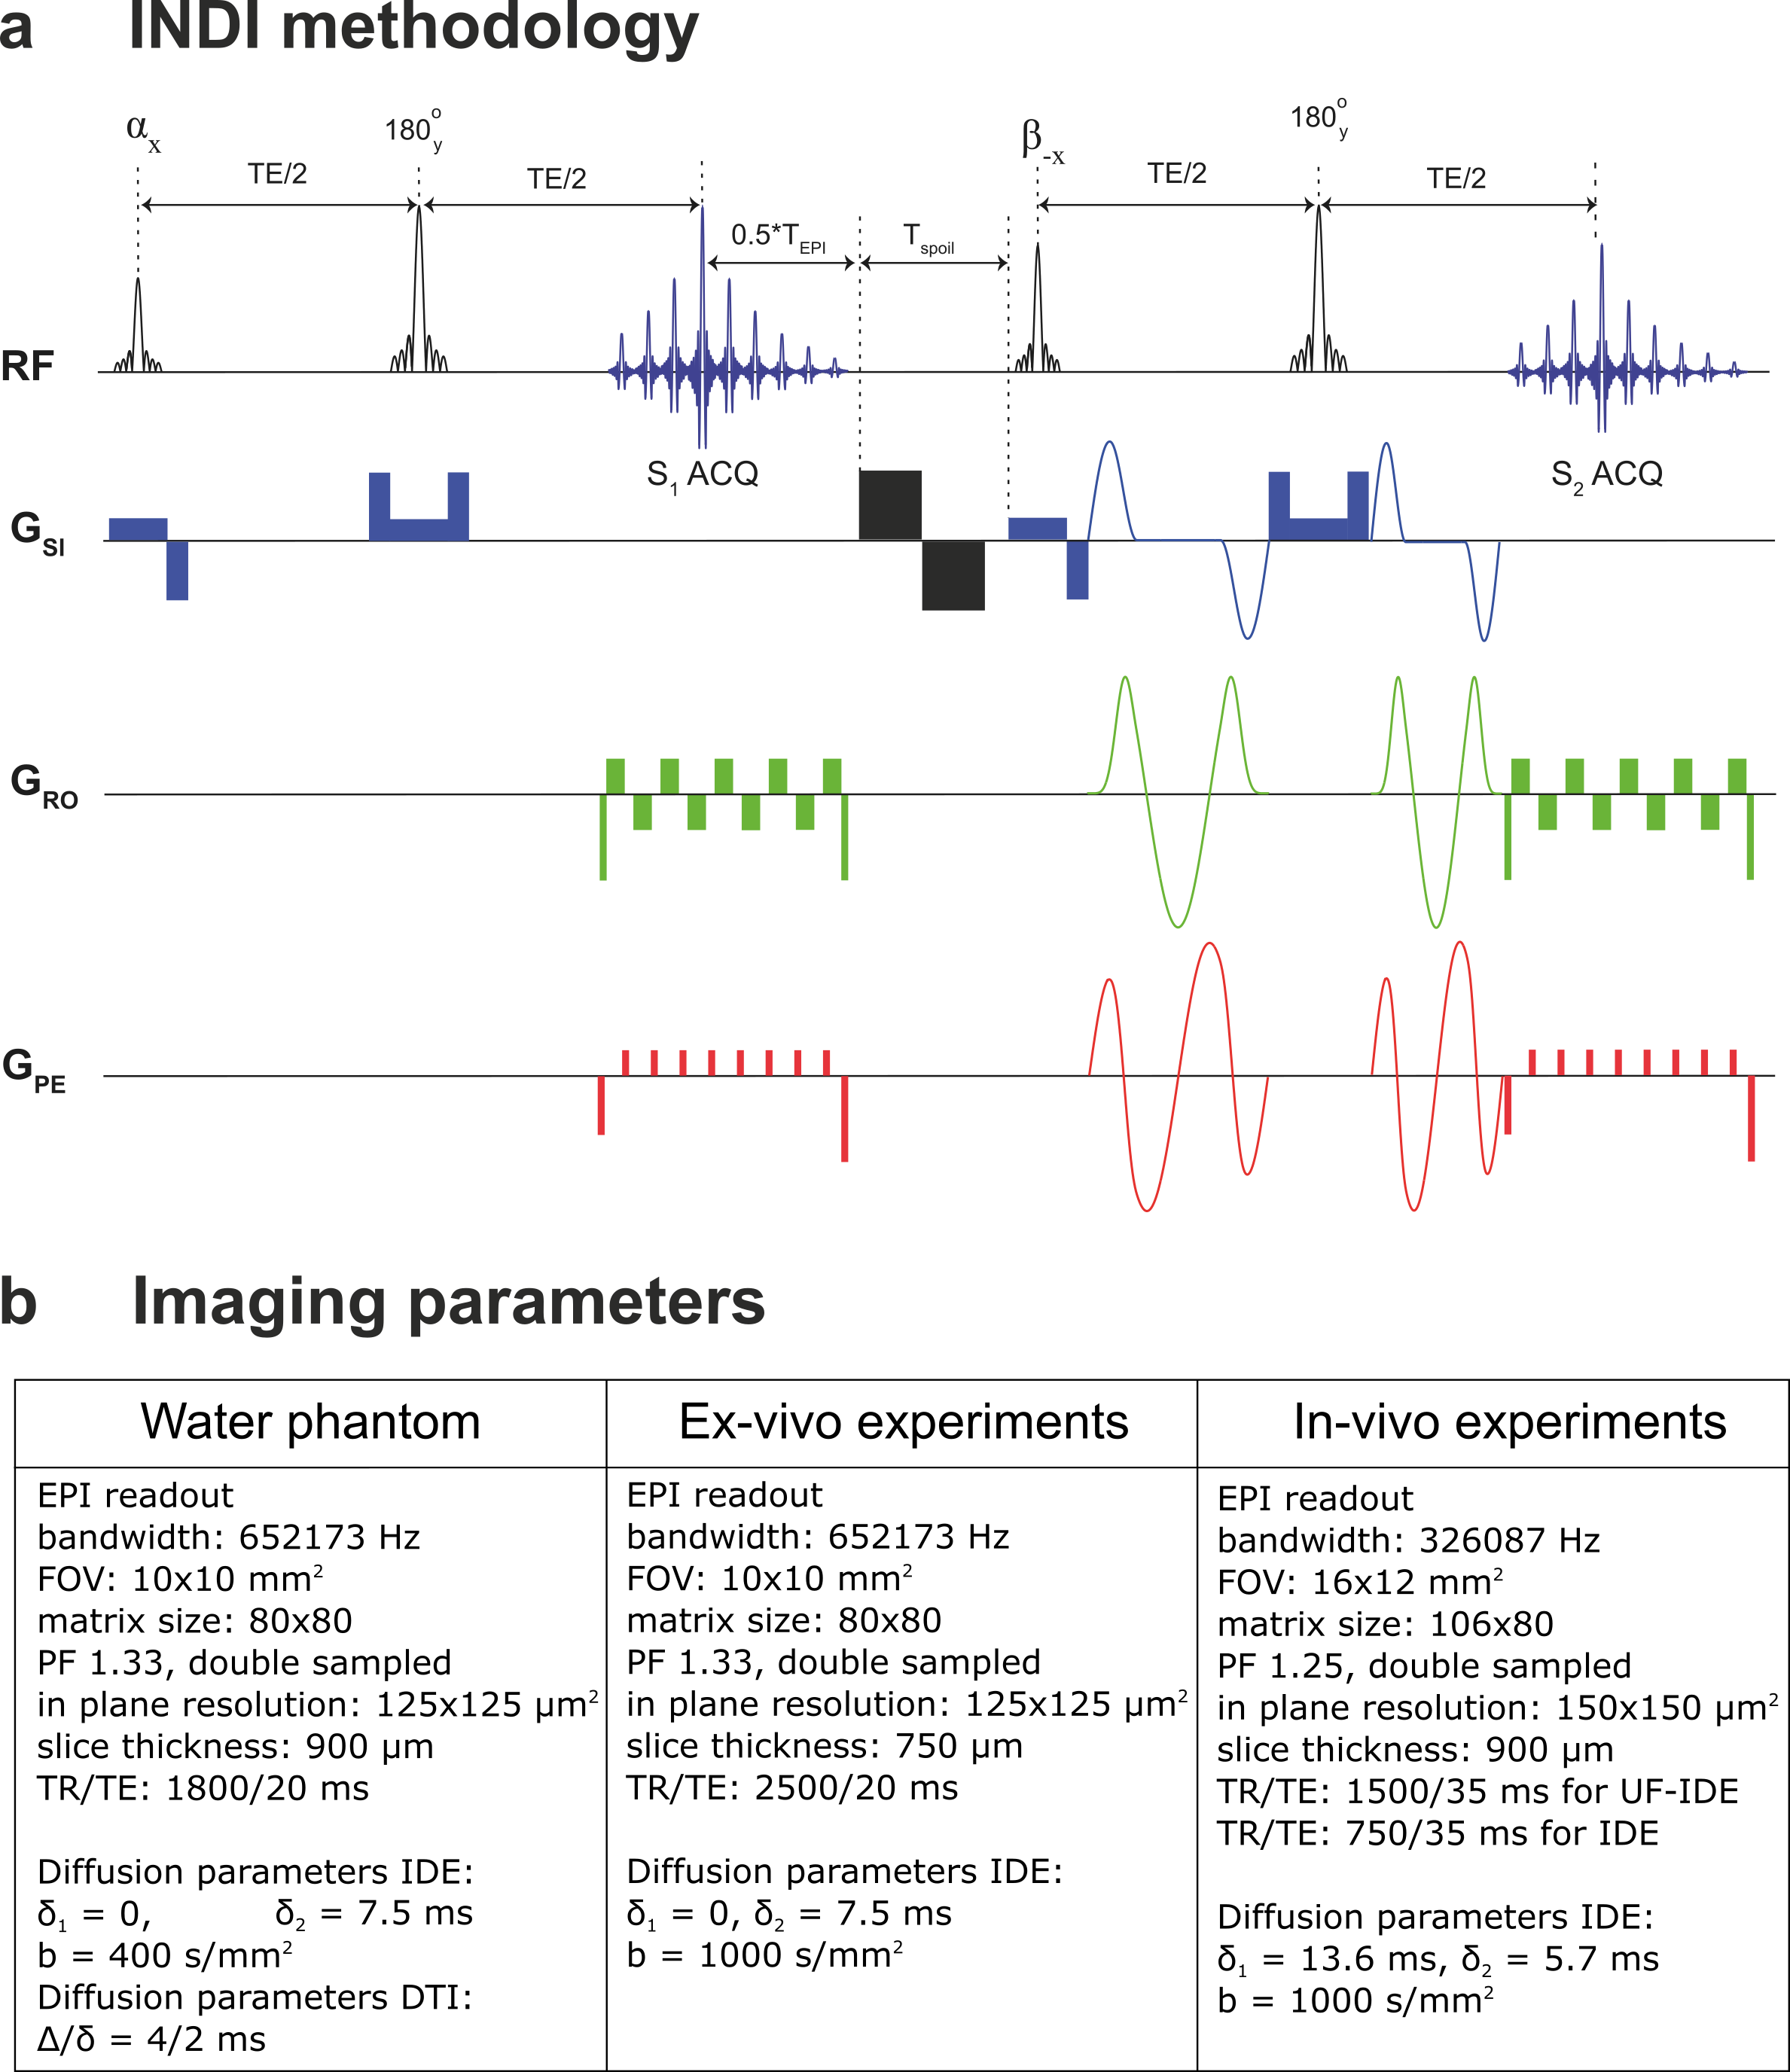
INDI framework: A fraction of the magnetization is rotated from the equilibrium position using a nutation angle α, leaving (ideally) an equal magnetization pool unperturbed; the b=0 image is then acquired using, for instance, a spin-echo EPI sequence. Then, residual transverse magnetization is crushed, and the leftover magnetization is rotated to the transverse plane using a pulse angle β, followed by an identical spin-echo EPI with the diffusion gradients applied, providing the nonzero b-value image. Here, we use this framework with isotropic diffusion encoding (IDE) gradients5,6 to provide a single-shot estimation of mean diffusivity (MD), as illustrated in Figure 1a. We term the proposed acquisition ultra-fast IDE (UF-IDE).
All experiments were preapproved by the Institution’s animal ethics committee. The imaging parameters for different experiments are detailed in Figure 1b.
Experiments: First, a doped water phantom (CuSO4 in 30/70% D2O/water) was used to validate the sequence. Experiments were performed on a 16.4T Bruker scanner, and also included a standard DTI acquisition for validation purposes. For ex-vivo experiments, brain samples (n=3) were perfused from healthy mice, immersed in gadoterate meglumine 2.5mM for 24h before scanning and placed in a 10mm NMR tube filled with Fluorinert. The last experiment shows feasibility for in-vivo imaging. A mouse was was anesthetized with isoflurane (4% induction, 1–2% maintenance in 95%O2) and scanned on a 9.4T Bruker scanner. In all settings, the MD values obtained from UF-IDE were compared with values from standard IDE acquisitions, requiring two repetition times.
An INDI “scout” sequence was acquired once per specimen with identical parameters, but diffusion gradients turned off. These scouts were used to correct INDI-derived maps.
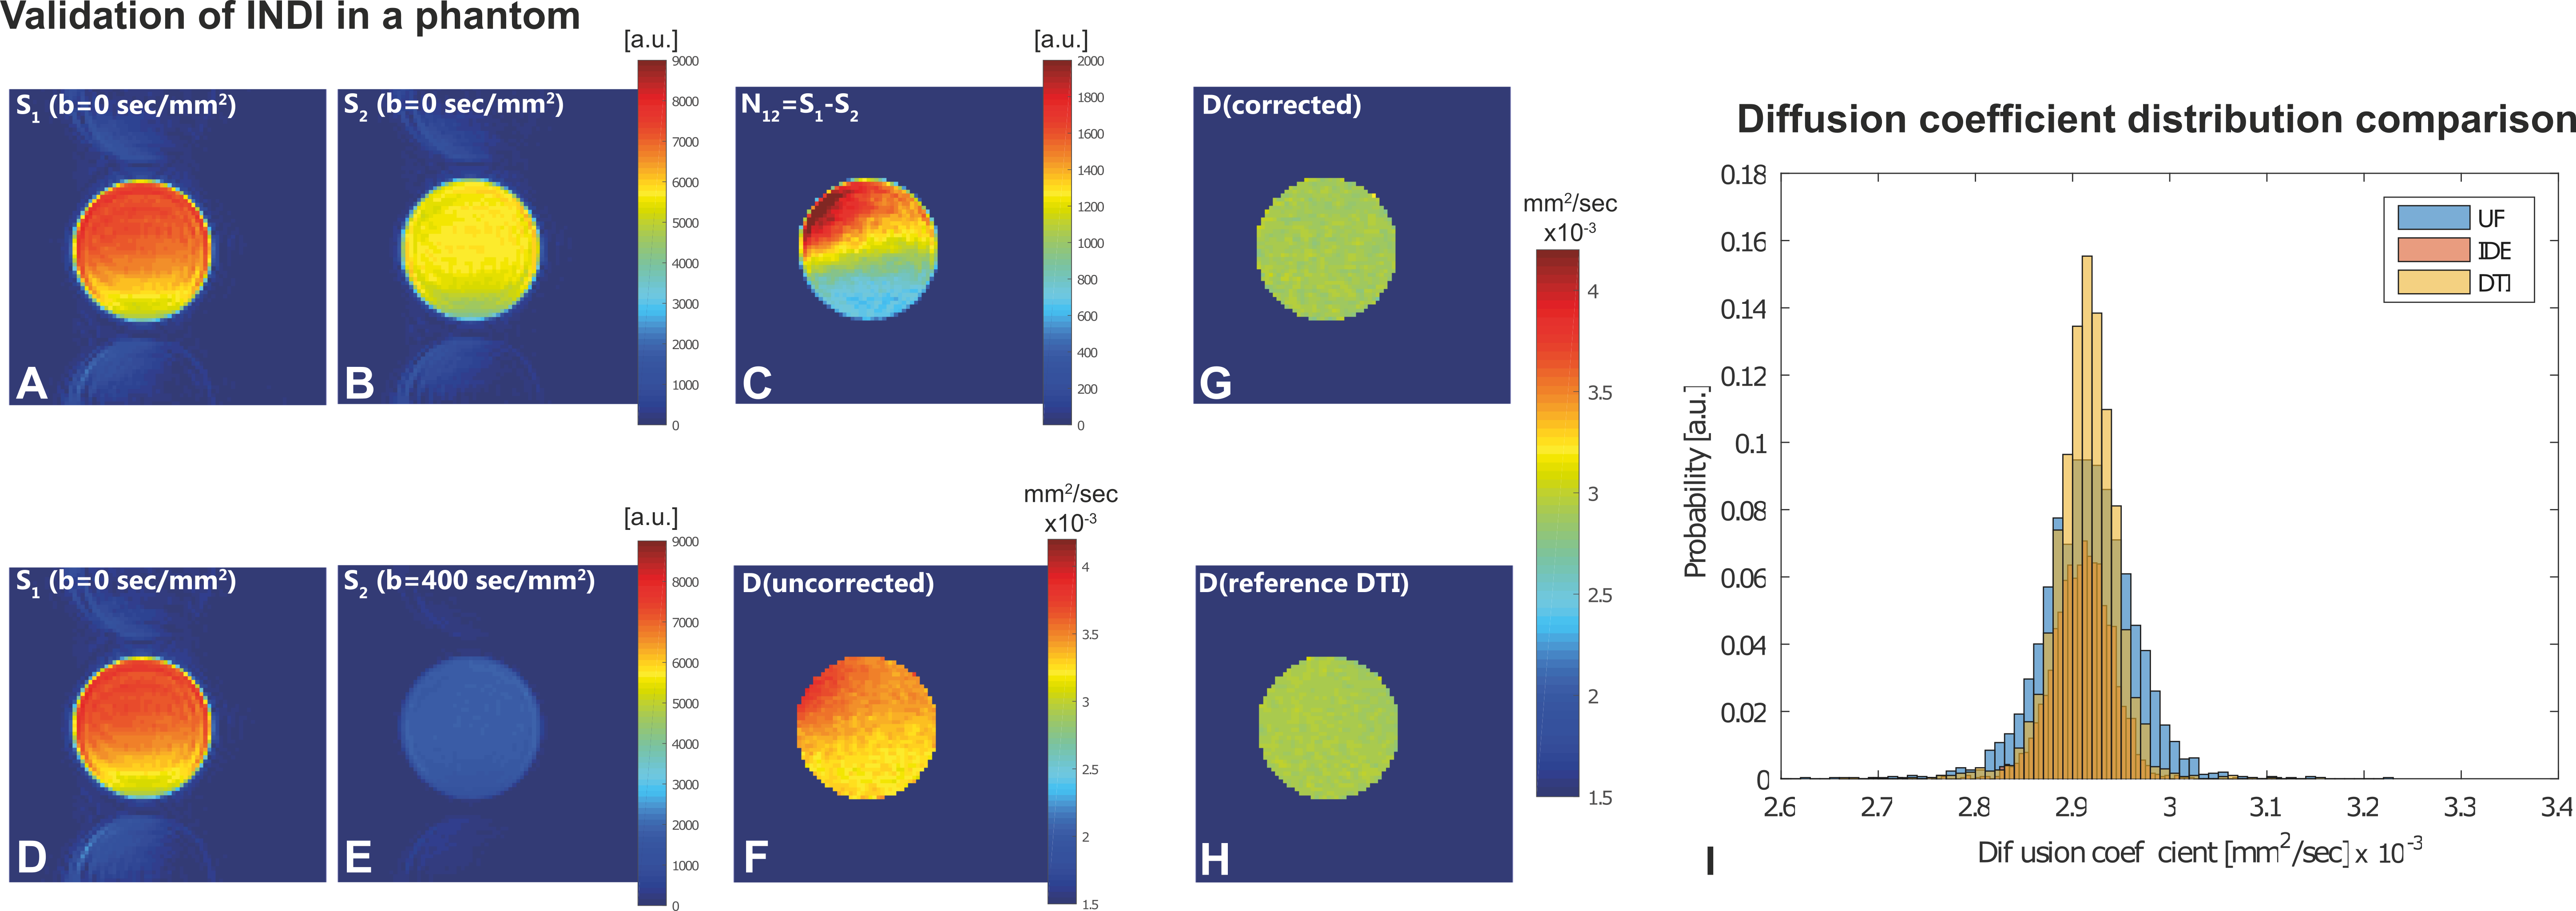
Data analysis: MD maps are computed as MDIDE=$$$-1/b\log(S(b)/S(b=0))$$$ and MDUF-IDE= $$$-1/b\log(S_2/(S_1-N_{12}))$$$ , where N12=S1-S2(b=0) is obtained from the “scout” acquisition.
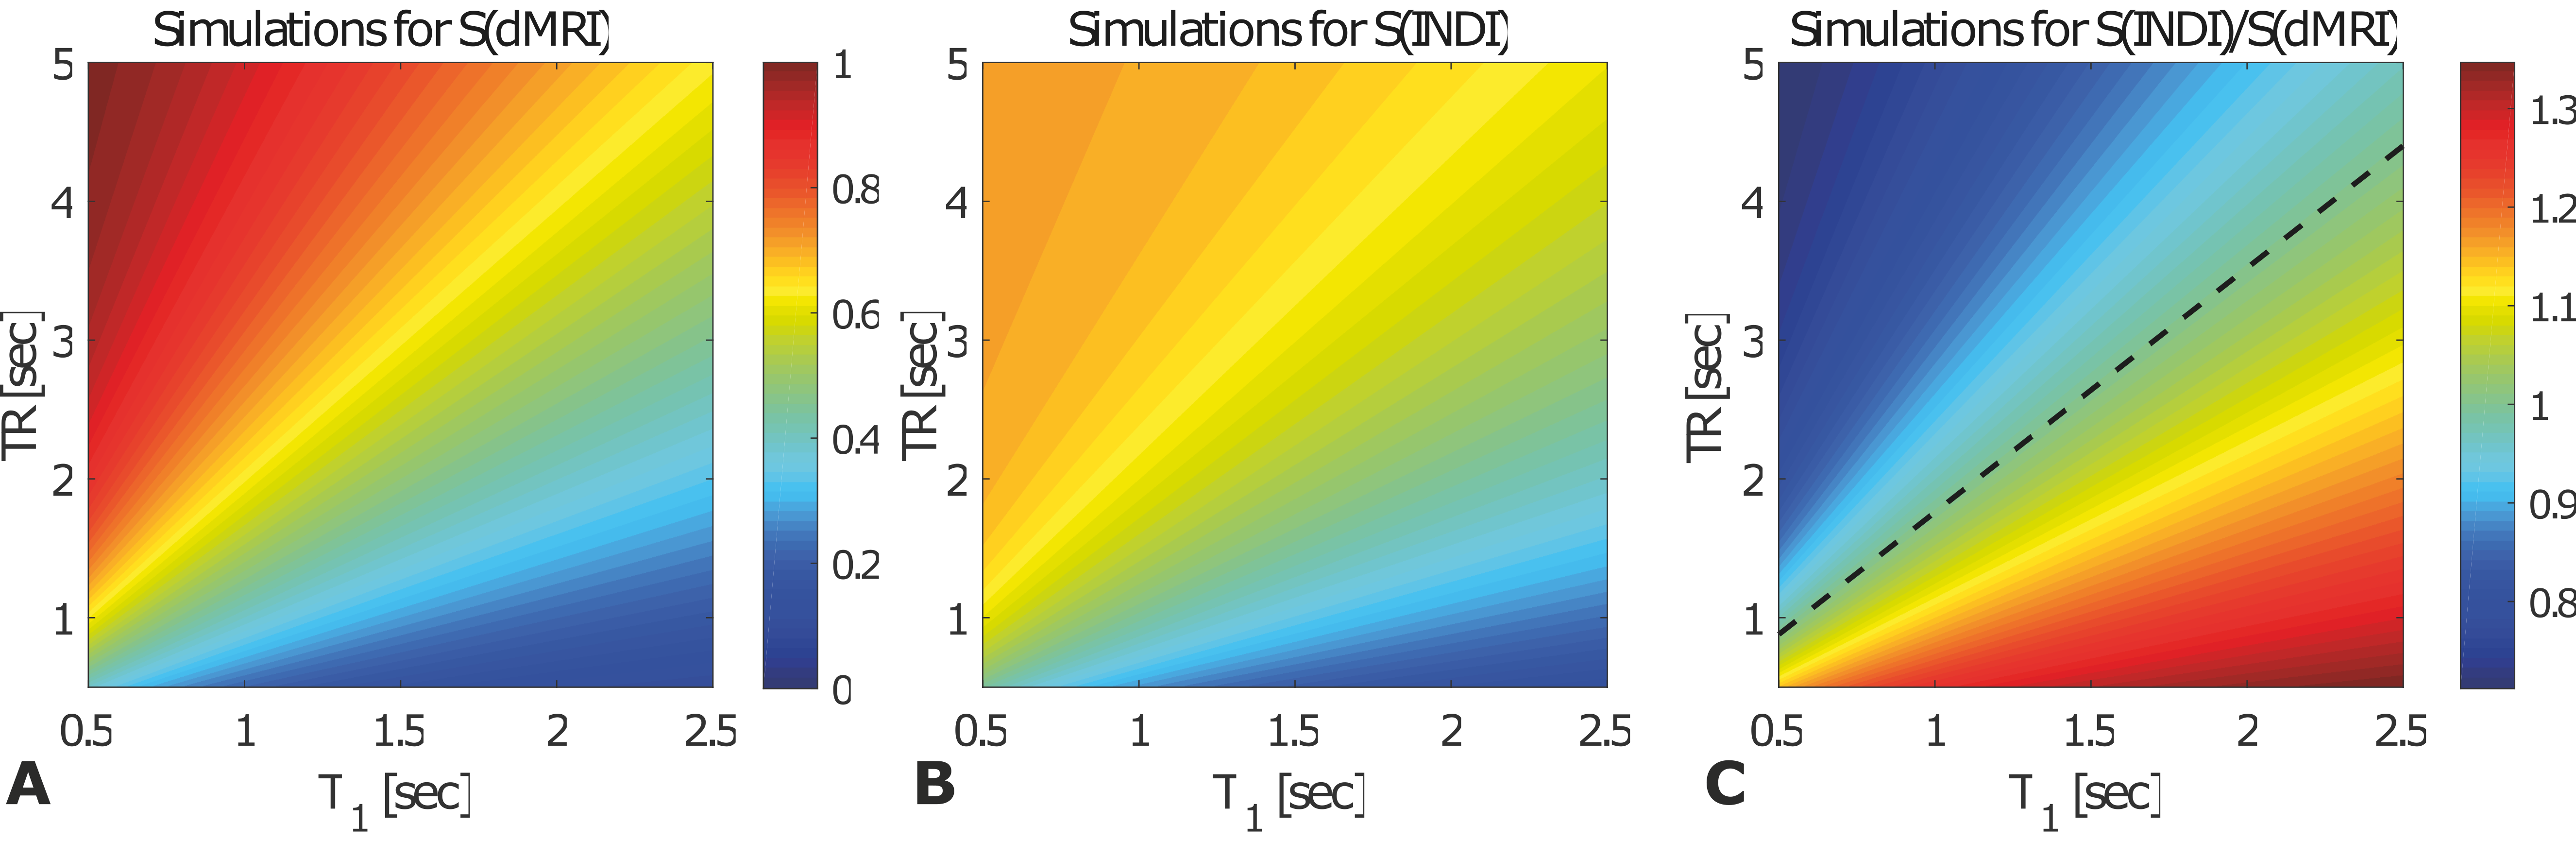
INDI Sensitivity Simulations: This analysis quantifies the sensitivity of INDI signal $$$S=\cos(\pi/4)(1-\exp(TR/T1))$$$ with its equal temporal resolution dMRI counterpart $$$S=(1-\exp(TR/2T1))$$$ for a broad range of TRs and T1s.
Results
Figure 2 presents the water phantom results. Assuming T1>>TEPI/2+Tspoil (Figure 1a), S1 and S2(G=0 mT/m) should ideally be identical for α=β=45o; however, the two images are not exactly equal in practice (Figures 2a-c), likely due to uncrushed higher-order coherence pathways. Figure 2d and 2e show raw S1 and S2 images, and Figure 2f shows the extracted MD map directly from S1 and S2, exhibiting artifactually high diffusivity. Figure 2g shows the MD map after the scout images were used for correction, revealing identical values compared to the gold-standard DTI (Figures 2g and 2i).
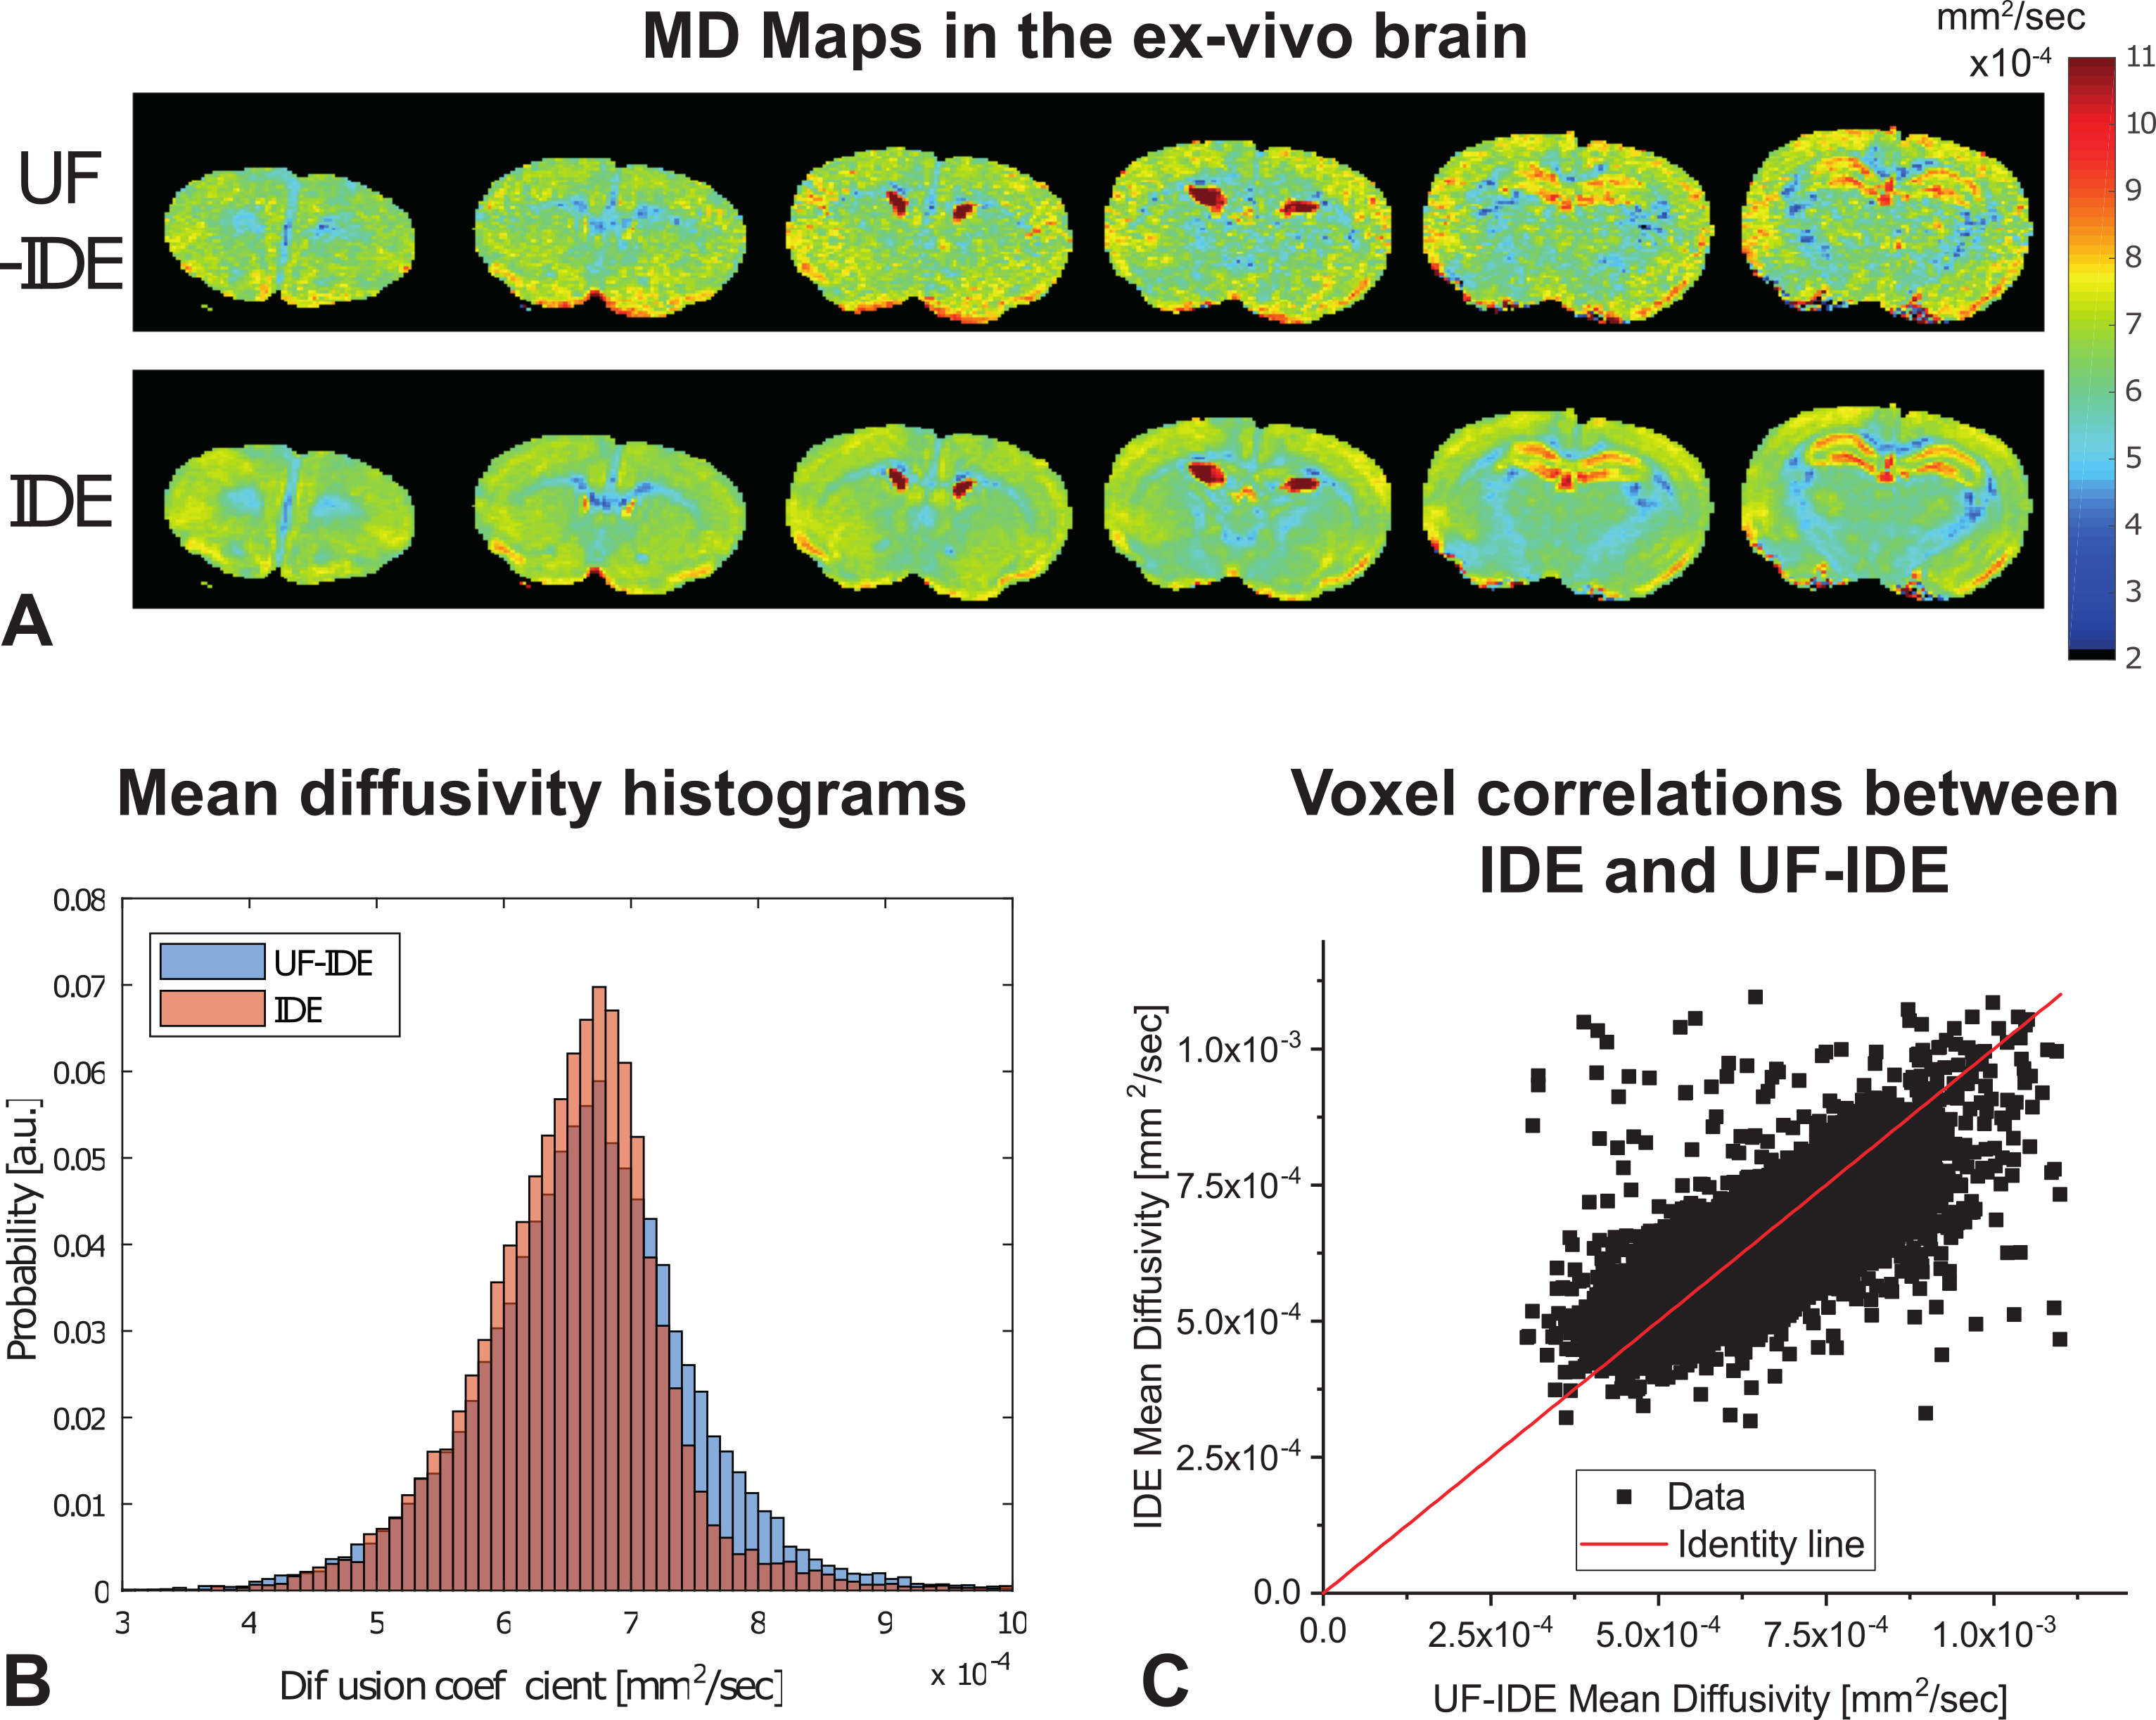
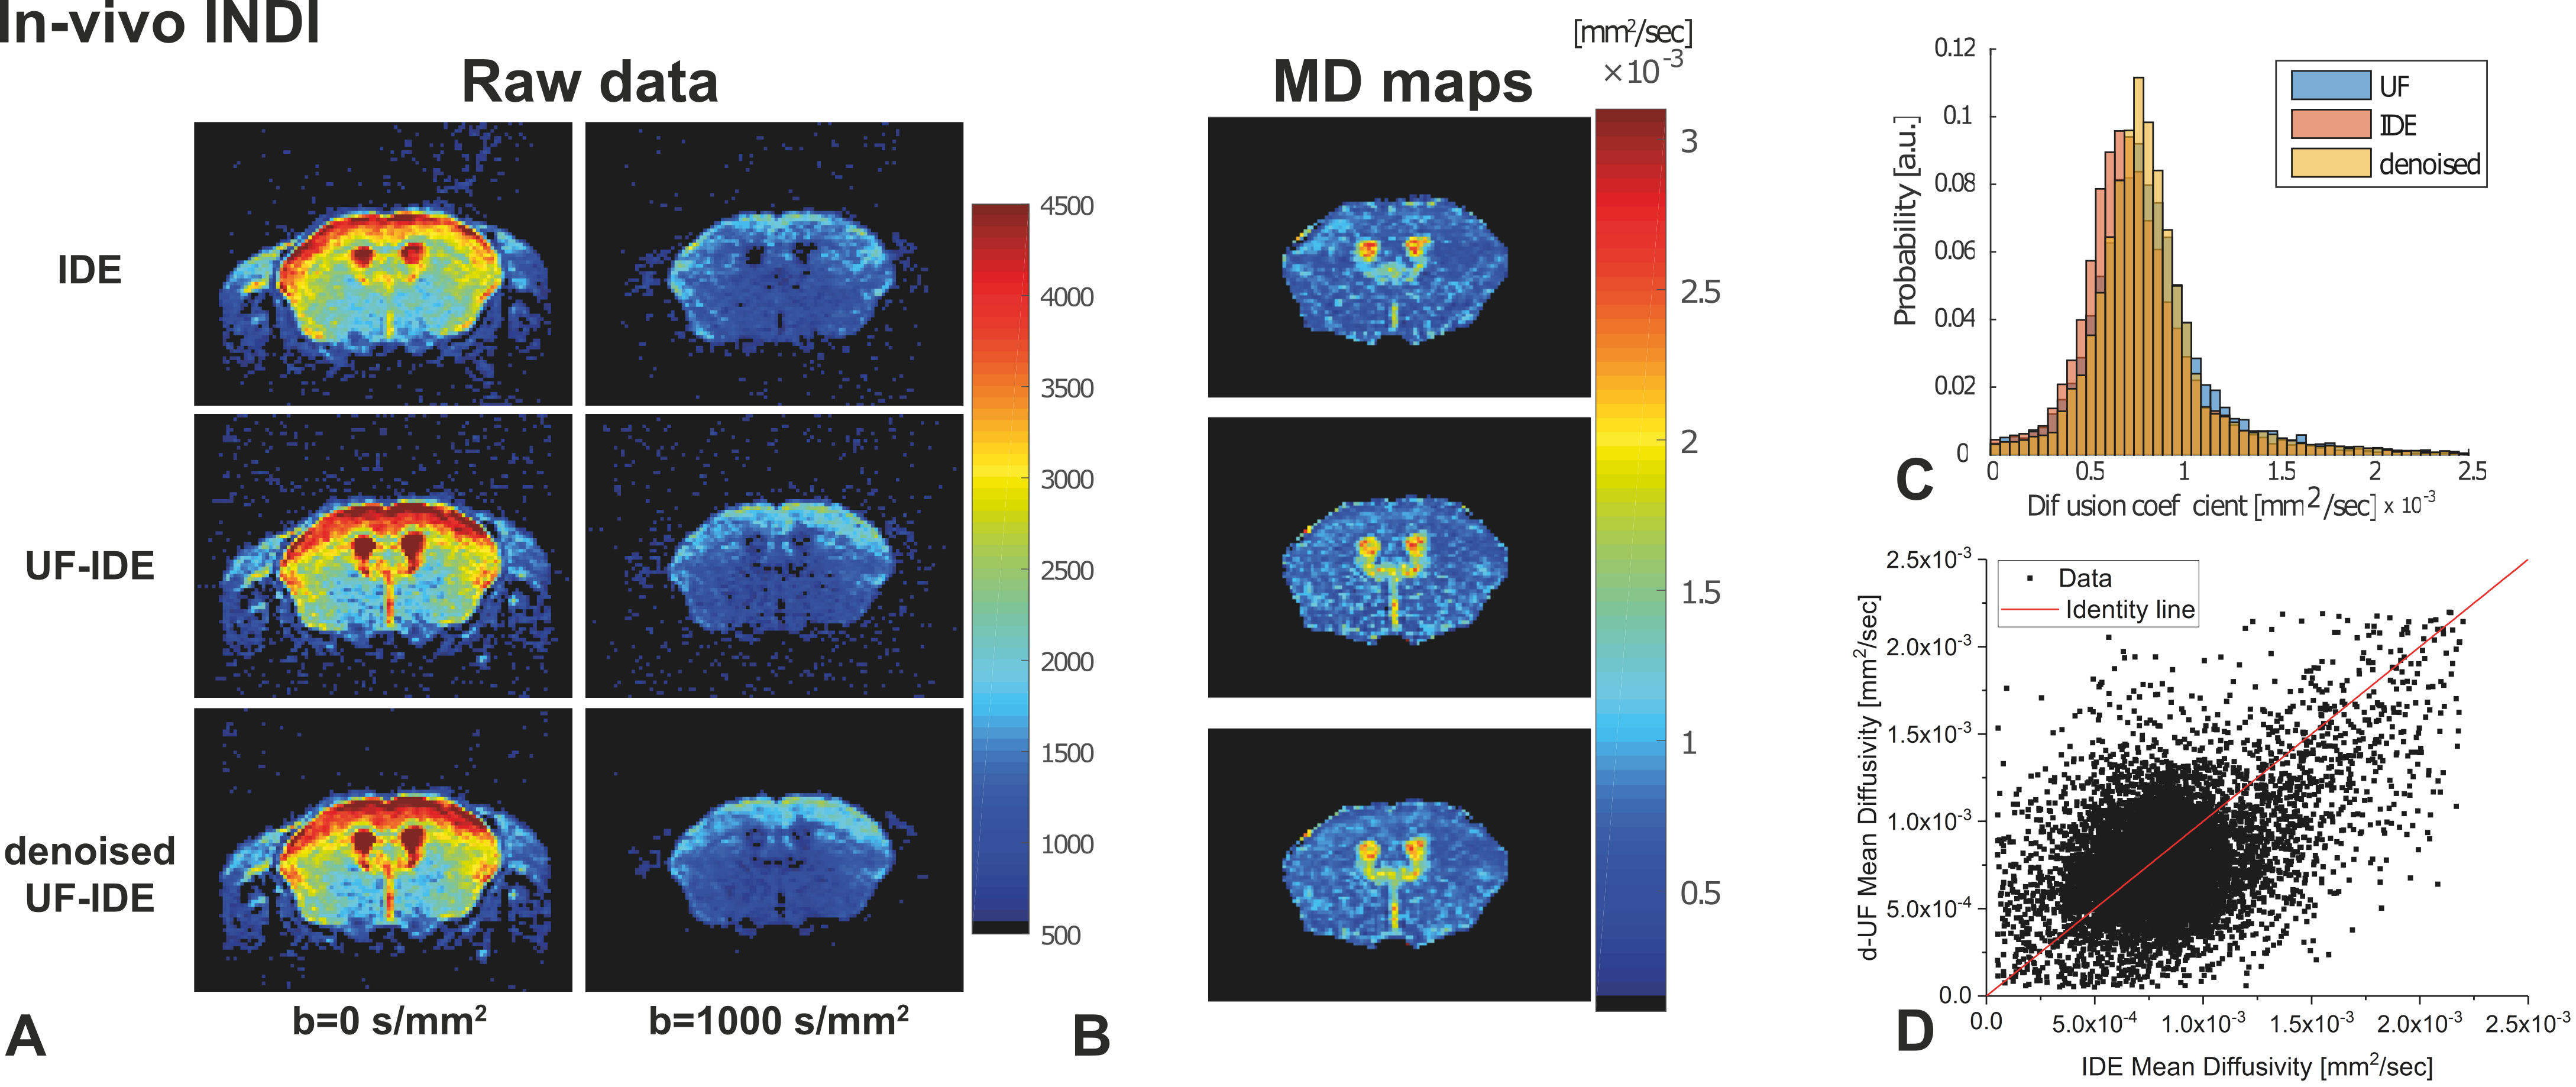
Figures 3a and 3b show that the standard IDE and UF-IDE yield very similar MD maps and histograms in ex-vivo mouse brain. The MD values measured with the two methods are highly correlated (Figure 3c, Pearson’s ρ=0.71). Figure 4 compares the two techniques for in-vivo mapping of MD with high temporal resolution. In this case the UF-IDE yields 20% higher SNR. Figure 5a and 5b plot the sensitivity of IDE and UF-IDE, respectively, for a range of T1s and TRs, and Figure 5c presents their relative sensitivity. UF-IDE shows higher sensitivity for TR<~1.76T1, which is the regime of interest for dynamic imaging. More details are provided in 7.
Discussion
The INDI methodology can be used for fast acquisition of diffusion images and allows single-shot mapping of mean diffusivity, using two consecutive sets of excitations followed by spin-echo EPI acquisitions. Scout images may be necessary, although in our in-vivo setups they have been nearly redundant. In the future, these scouts may be obviated by using other gradient crusher schemes or alternatively, with different phase cycling. The method is quite general in the sense that other flip angles or number of blocks can be designed, such that more images per TR can be acquired. These can assist increasing the applicability of dynamic microstructure imaging.Conclusion
This work introduces the INDI acceleration framework, which allows the acquisition of a reference and diffusion weighted image within <50 ms of each other.Acknowledgements
This study was supported by funding from the European Research Council (ERC) under the European Union’s Horizon 2020 research and innovation programme (Starting Grant, agreement No. 679058) and EPSRC (grant number M507970). The authors are thankful to Dr. Daniel Nunes for preparing the ex-vivo specimens and to Ms. Madalena Fonseca for assisting with in-vivo acquisitions.References
1. Mori, S. and P.C. Van Zijl, Diffusion weighting by the trace of the diffusion tensor within a single scan. Magn Reson Med, 1995. 33: p. 41-52.
2. Basser, P.J., J. Mattiello, and D. LeBihan, MR diffusion tensor spectroscopy and imaging. Biophysical Journal, 1994. 66(1): p. 259-267.
3. Le Bihan, D., Looking into the functional architecture of the brain with diffusion MRI. Nature Reviews Neuroscience, 2003. 4: p. 469-480.
4. Tsurugizawa, T., L. Ciobanu, and D. Le Bihan, Water diffusion in brain cortex closely tracks underlying neuronal activity. PNAS, 2013. 110(28): p. 11636–11641.
5. Eriksson, S., S. Lasic, and D. Topgaard, Isotropic diffusion weighting in PGSE NMR by magic-angle spinning of the q-vector. Journal of Magnetic Resonance, 2013. 226: p. 13-18.
6. Topgaard, D., Director orientations in lyotropic liquid crystals: diffusion MRI mapping of the Saupe order tensor. Phys. Chem. Chem. Phys., 2016. 18: p. 8545.
7. Ianus, A. and N. Shemesh, Incomplete Initial Nutation Diffusion Imaging: AnUltrafast, Single-Scan Approach for Diffusion Mapping. Magn Reson Imaging, 2017: p. Early View.
Figures