1635
A living phantom study to evaluate the echo planar imaging (EPI) distortion correction effects in reducing inter-site variability1Quantitative Medical Imaging Section, NIBIB, NIH, Bethesda, MD, United States, 2The Henry M. Jackson Foundation for the Advancement of Military Medicine Inc, Bethesda, MD, United States, 3Baylor College of Medicine, Houston, TX, United States, 4Chronic Effects of Neurotrauma Consortium, Richmond, VA, United States
Synopsis
In this study we evaluate the effect of echo planar imaging (EPI) distortion artifact as a contributing factor in inter-site variability. With living phantom data acquired with opposite phase encoding direction protocol (blipup-blipdown), we show the effectiveness of a robust EPI distortion correction method in reducing inter-site variability.
Introduction
Diffusion Tensor Imaging (DTI) multicenter studies are becoming increasingly popular for their ability to improve statistical power by utilizing a larger number of subjects. [1,2] However, processing and analyzing data originating from various centers presents unique challenges due to the intrinsic higher heterogeneity of experimental procedures compared to a single center study. DTI data acquired with echo planar imaging (EPI) sequences are usually affected by geometrical distortions resulting from susceptibility artifacts and other field inhomogeneities, primarily affecting the tissue air interface in the brain. Measures have been taken to reduce the intra- and inter-site variability arising from noise in data, motion artifacts, scanners used in acquiring data, [3,4] but uncorrected EPI distortions have not been considered as a potential contributor to increased variability of DTI metrics in population studies. Here, we evaluate the potential contribution of EPI distortion to the observed inter-site variability in DTI metrics. This assessment is timely because methods exist that correct EPI distortions effectively from data acquired with reversed polarity of phase encoding (blip up and down).[5,6,7] Such correction methods could be used in multicenter studies.Methods
Experimental Design
To address this issue, we need an appropriate experimental design. First, we need data from the same healthy subject at various sites, so that we can assume that all the measured variability across different scans is of experimental origin only, without contributions from biological variability. Second, we need data that is acquired with both blip-up and blip-down so that an effective distortion correction is possible. Third, by using only the blip-up or down acquisition, we can simulate what is typically done in multicenter DTI studies in which reverse phase encoding is generally not used. Finally, by comparing the voxel-wise variance for data processed with EPI distortion correction and without EPI distortion correction, we can evaluate the contribution of EPI distortions to the variability because the other sources of variability are the same for the two sets of data. Therefore, we used data from a healthy living phantom, scanned at 5 sites as part of Chronic effects of Neurotrauma Consortium (CENC) [8] with opposite phase encoding direction schemes [AP, PA].
Image Processing
Step1: Each AP and PA dataset from all sites underwent DTI data processing to remove eddy, motion distortion artifacts; Step2: EPI distortion correction was then performed on AP-PA data, using a fat suppressed T2W structural from one site that was used as an anatomical reference image[9,7]; Step3: Diffusion tensors (DT)s were computed for each output from step1 and step2 processing [9]. FA maps were derived from the computed DTs.
Analysis
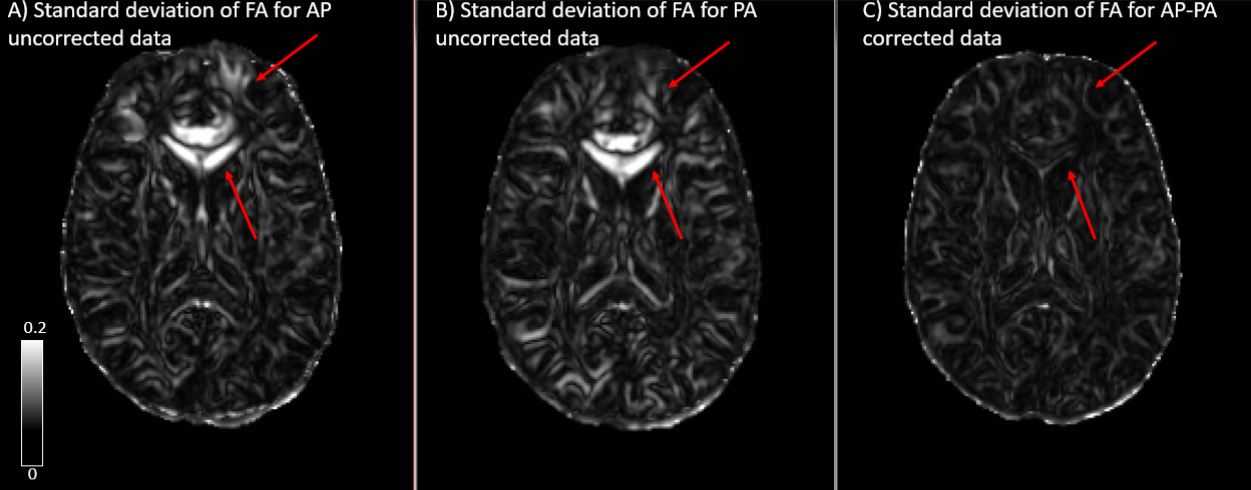
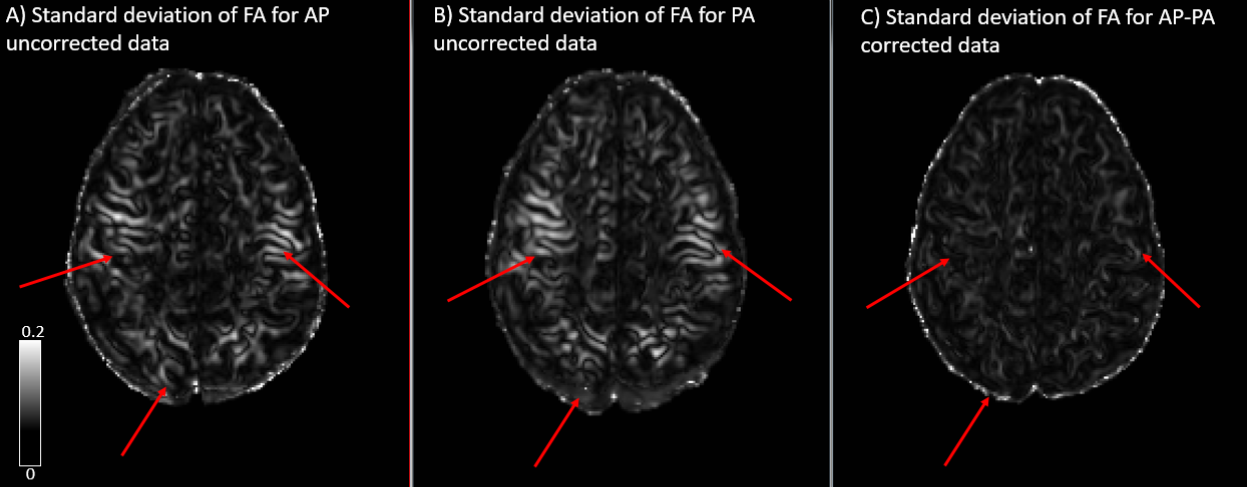
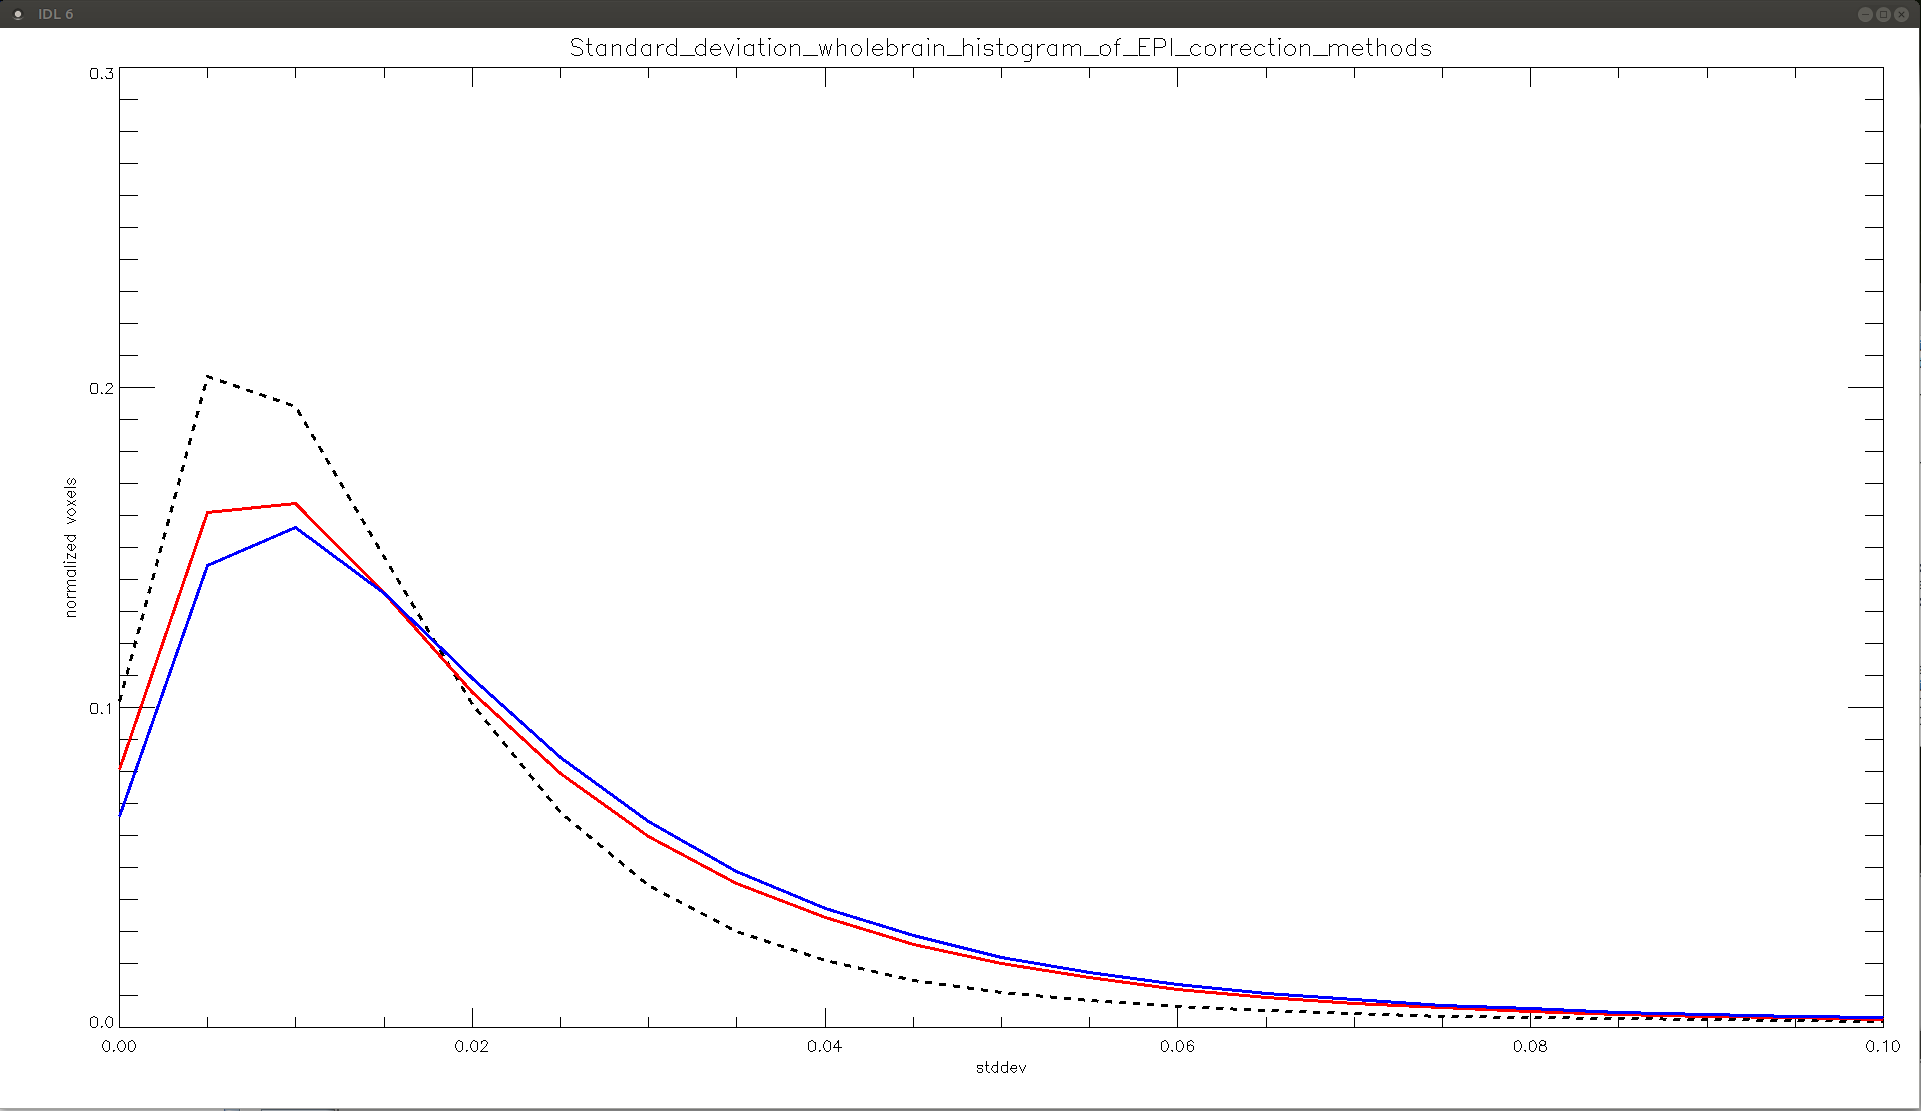
Three groups were created comprising of data from each site, based on the EPI correction method used, namely: Group1- AP (distortion uncorrected) , Group2- PA (distortion uncorrected) and Group3- AP-PA (distortion corrected). Standard deviation maps were created for each of the three groups. In addition to looking at the differences visually, we generated whole brain voxel-wise histograms to visualize the differences between the uncorrected and corrected data.
Results
The standard deviation maps for AP (distortion uncorrected) and PA (distortion uncorrected) show increased inter-site variability in fractional anisotropy (FA), in the following regions: brainstem, corpus callosum (CC) and at apex of the brain, as seen in figs 1, 2, and 3, respectively. These regions of increased variability are in line with the regions of maximal EPI distortion artifacts generally seen in DTI data. The figures also show the standard deviation maps computed for AP-PA (distortion corrected), where these inter site variability due to EPI distortions have been eliminated. Whole brain histograms in fig 4 for the three groups show the positive effect of EPI distortion correction at a voxel level, compared to the uncorrected data.Discussion
EPI distortion is one of the most prevalent artifacts in DTI acquisition and has generally been overlooked as a contributor towards inter-site variability. Moreover, DTI with reverse phase encoding is typically not collected in multicenter DTI studies, precluding the positive effects of robust EPI distortion correction on the data. In this analysis, we have demonstrated the importance of EPI correction in reducing inter-site variability using a living phantom. We showed reduced variability in FA between sites after EPI correction, even though the data were acquired with different scanner models from the same manufacturer and had slight differences in acquisition protocol. EPI correction is particularly important in multicenter studies such as CENC studying mild traumatic brain injury (mTBI) population, as the regions of interest for these studies are also the regions more prone to geometrical distortions. It is therefore essential that multicenter studies consider the potential effects of EPI distortions when collecting DTI data and employ an effective means of EPI correction.
Acknowledgements
This material is based upon work supported by the U.S. Army Medical Research and Material Command and from the U.S. Department of Veterans Affairs Chronic Effects of Neurotrauma Consortium under Award No. W81XWH-13-2-0095. The U.S. Army Medical Research Acquisition Activity, 820 Chandler Street, Fort Detrick MD 21702-5014 is the awarding and administering acquisition office. Any opinions, findings, conclusions or recommendations expressed in this publication are those of the author(s) and do not necessarily reflect the views of the U.S. Government, or the U.S. Department of Veterans Affairs, and no official endorsement should be inferred.References
[1] Walker et al. The diffusion tensor imaging (DTI) component of the NIH MRI study of normal brain development (PedsDTI). Neuroimage 124(Pt B):1125-30, 2016.
[2] Brueggen et al. A multicenter DTI and MRI study on Alzheimer's disease and Mild Cognitive Impairment, Neuroimage, Volume 144, Part B, January 2017, Pages 305-308.
[3] Jean-Philippe Fortin et al. Harmonization Of Multi-Site Diffusion Tensor Imaging Data, 10.1016/j.neuroimage.2017.08.047.
[4] Mirzaalian et al. Multi-site harmonization of diffusion MRI data in a registration framework, Brain Imaging and Behavior DOI 10.1007/s11682-016-9670-y.
[5] Andersson et al. How to correct susceptibility distortions in spin-echo echo-planar images: application to diffusion tensor imaging, NeuroImage, 20(2):870-888, 2003.
[6] Smith et al. Advances in functional and structural MR image analysis and implementation as FSL, NeuroImage, 23(S1):208-219, 2004.
[7] Irfanoglu et al. DR-BUDDI (Diffeomorphic Registration for Blip-Up blip-Down Diffusion Imaging) method for correcting echo planar imaging distortions, NeuroImage 106 (2015) 284–299.
[8] https://cenc.rti.org
[9] C. Pierpaoli, L et al. TORTOISE: an integrated software package for processing of diffusion MRI data, ISMRM 18th annual meeting, Stockholm, Sweden, #1597.
[10] Irfanoglu et al. TORTOISE v3: Improvements and New Features of the NIH Diffusion MRI Processing Pipeline, ISMRM, 2017.
Figures