1621
Optimization of b values and reproducibility of perfusion and diffusion parameters using IntraVoxel Incoherent Motion (IVIM) with peripheral pulse triggering1Philips Japan, Tokyo, Japan, 2Kawasaki Medical School, Kurashiki, Japan, 3Yamaguchi University Graduate School of Medicine, Ube, Japan, 4Philips HealthTech, Tokyo, Japan
Synopsis
To investigate the reproducibility of IVIM-derived parameters with peripheral pulse unit (PPU) triggering and optimized b values combination to decrease scan time, we assessed the reproducibility by calculating coefficient of variation (CV) for each parameter. Moreover, D* and F calculated with some b value patterns were compared to those with all b values using the Pearson correlation. Our results suggest that cardiac gating does not improve reproducibility of perfusion and diffusion parameter. F with only 4 b values (e.g. b=0-200-500-1000) can provide robust information on perfusion noninvasively with significantly shortened scan time.
Introduction
The IntraVoxel Incoherent Motion (IVIM) model has been introduced to separate extravascular molecular diffusion and microcirculation of blood within the capillaries (perfusion) using a biexponential decay1. Although clinical usefulness of IVIM has been reported in some articles2, 3, there are a couple of problems with IVIM. First, we could not obtain stable values for the flow/perfusion-influenced pseudodiffusion coefficient (D*). Previous studies suggested that D* was less reproducible4 and could be strongly affected by the cardiac cycle5. Second, consensus is yet to be reached regarding the best selection of b values and their distribution. As a result, scanning with multiple b values to assess IVIM results in a long scan time. Therefore, the purpose of this study is to investigate the reproducibility of IVIM-derived parameters with peripheral pulse unit (PPU) triggering and optimized b value combination to decrease scan time.Methods
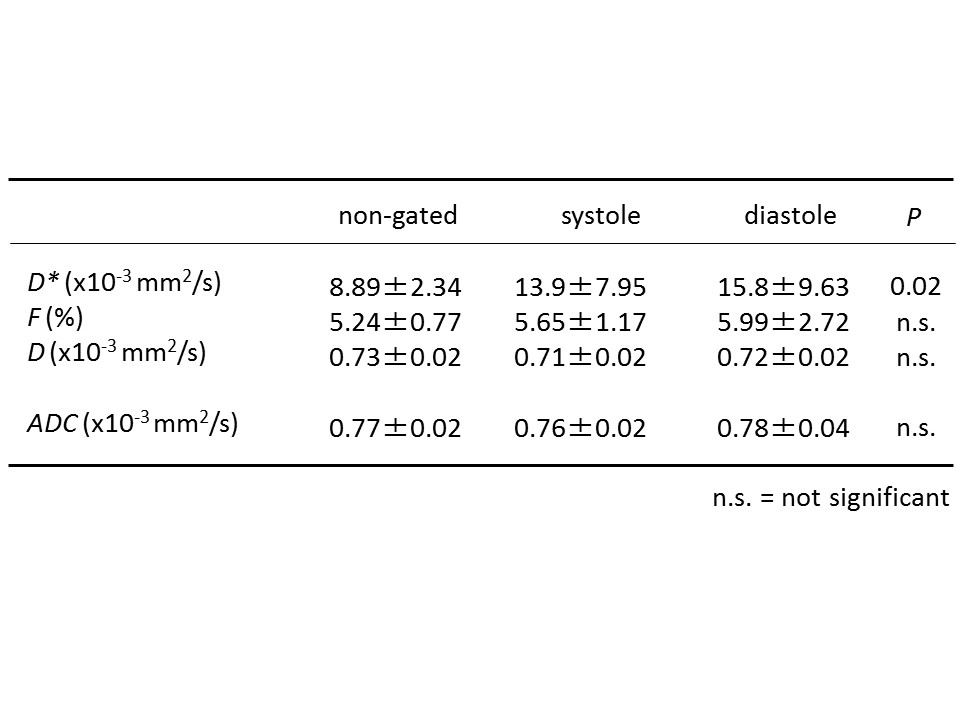
This study was approved by the institutional review board (IRB) and was performed only after informed consent was obtained from each participant. 16 healthy volunteers (mean age, 30.8 ± 8.69 years) underwent Brain MRI at 3.0 T including multiple b value DWI (12 steps: b= 0, 10, 20, 30, 50, 75, 100, 150, 200, 300, 500 and 1000 s/mm2). IVIM was performed to calculate D*, “pure” diffusion coefficient (D) and perfusion fraction (F). First, monoexponential fitting was performed with b values of 200 s/mm2 and higher to obtain D. Next, D* and F were derived from the biexponential function including all b values. We compared D*, D and F between non-gated, systole and diastole acquisition with PPU triggering. Each parameter was analyzed by Kruskal-Wallis test with Steel-Dwass test for post hoc comparisons. Next, we assessed the reproducibility by calculating the coefficient of variation (CV) for each parameter. Moreover, D* and F calculated with some b value patterns (i.e. 0-200-1000, 0-200-300-1000, 0-200-500-1000, 0-200-300-500-1000) were compared to those with all b values using the Pearson correlation.Results
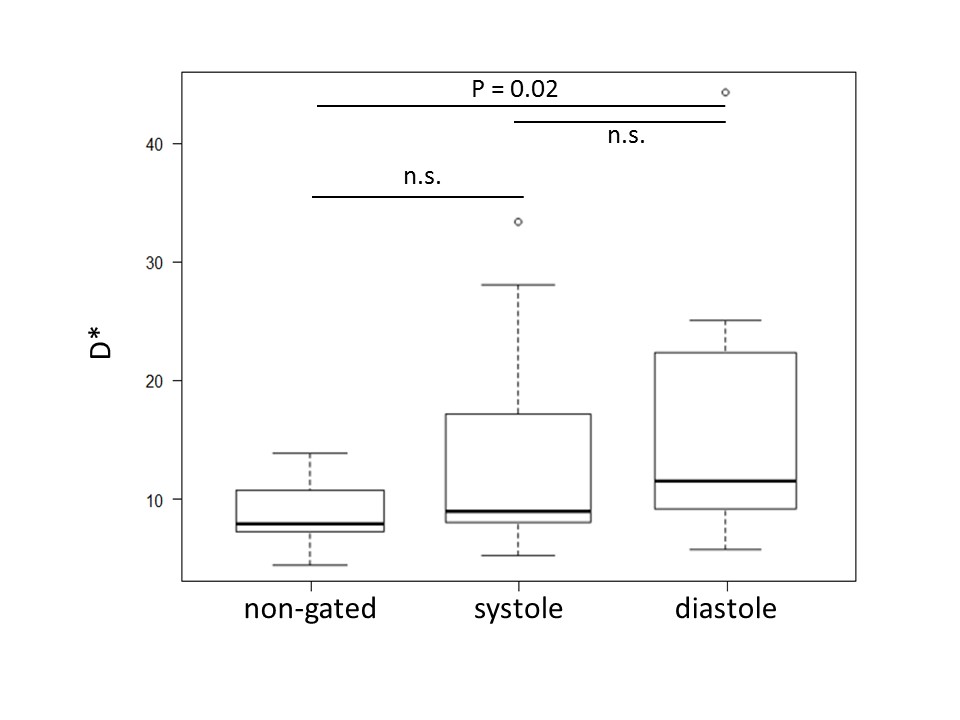
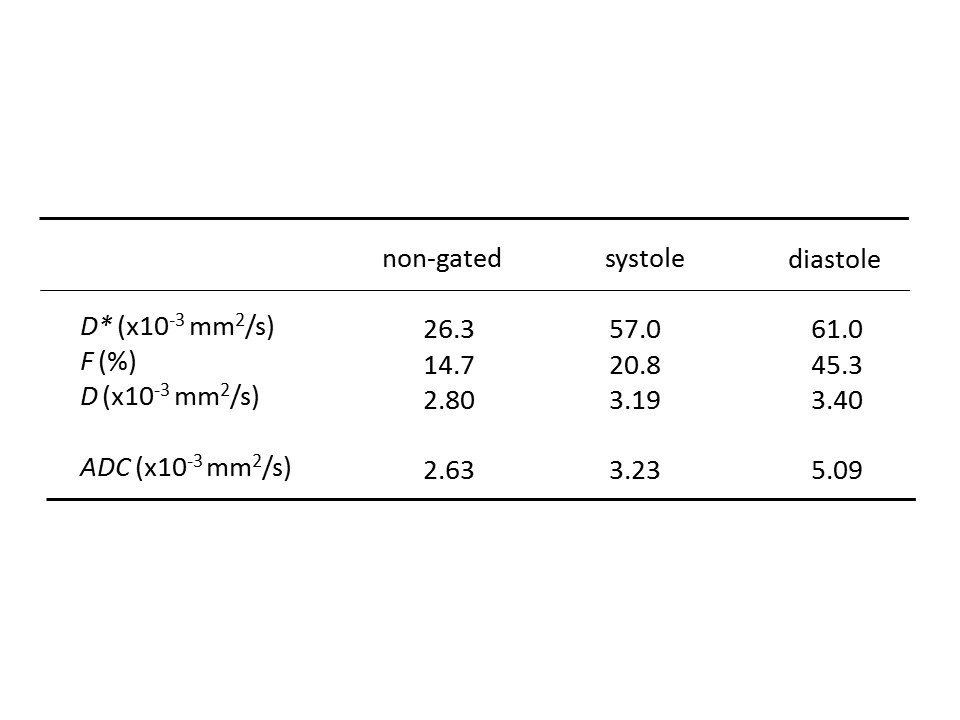
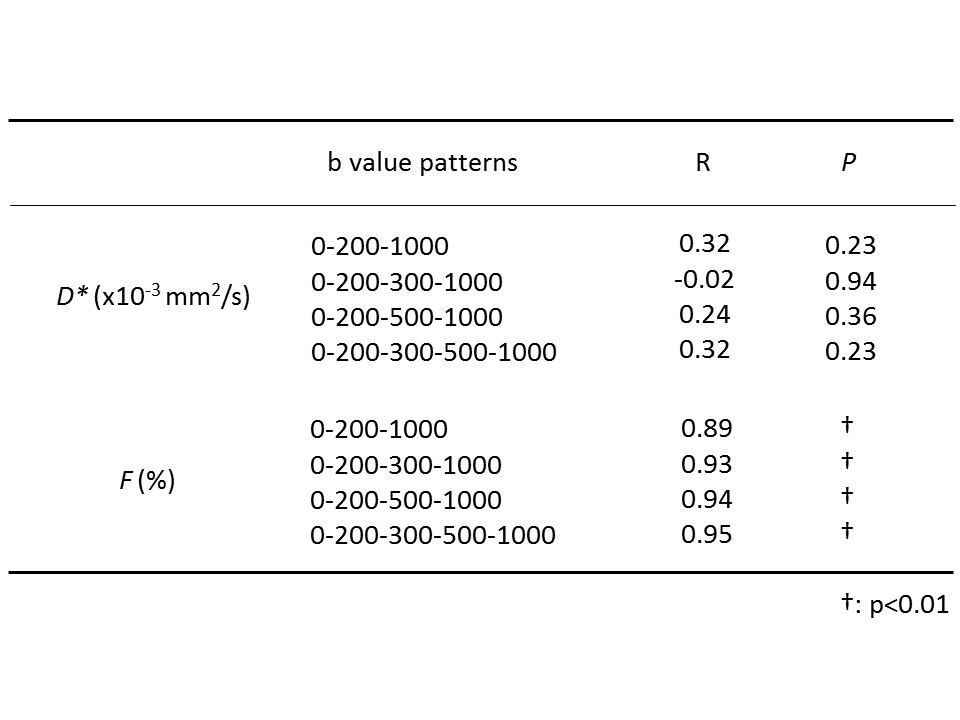
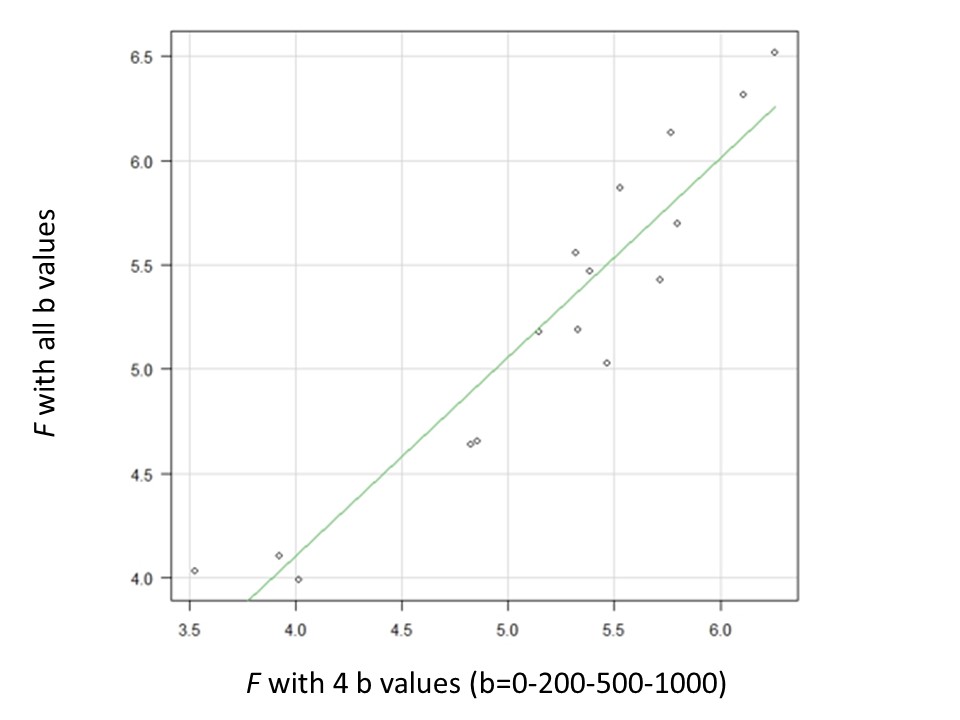
D* was significantly increased in diastole vs non-gated (P = 0.02, Figure 1 and 2). On the other hand, there was no significant difference in other parameters among non-gated, systole and diastole (Figue 1). As Federau reported5, D* is affected by microvascular pulsation depending on cardiac cycle. However, PPU triggering did not improve CV of D* in systole or diastole (CV: 26.3 (non-gated), 57.0 (systole), 61.0 (diastole), Figure 3). Also, CV of F was smaller than that of D*. In case of non-gated (with lowest CV), D* obtained using all b values showed no significant correlation with that with other patterns (Figure 4), whereas F with all b values showed significant correlation with that with other 4 b value patterns (R = 0.89, P < 0.01; R = 0.93, P < 0.01; R = 0.94, P < 0.01; R = 0.95, P < 0.01, respectively, Figure 4).Disussion
PPU triggering did not improve CV of D* in systole or diastole. Therefore, reproducibility of D* was not improved with PPU triggering. F with all b values showed significant correlation with that with 0-200-300-1000 or 0-200-500-1000 or 0-200-300-500-1000. Therefore, using F for perfusion with reduced number of b values (i.e. 0-200-500-1000) makes it possible to maintain reproducibility while shortening the scan time (Figure 5).Conclusion
Our results suggest that cardiac gating does not improve reproducibility of perfusion and diffusion parameter. F with only 4 b values (e.g. b=0-200-500-1000) can provide robust information on perfusion noninvasively and significantly shorten scan time.Acknowledgements
We would like to thank radiological technologists in Kawasaki Medical school Hospital for dedicated supports.References
1. Le Bihan D, Breton E, Lallemand D, et al. Separation of diffusion and perfusion in intravoxel incoherent motion MR imaging. Radiology 1988:168(2):497-505.
2. Togao O, Hiwatashi A, Yamashita K, et al. Differentiation of high-grade and low-grade diffuse gliomas by intravoxel incoherent motion MR imaging. Neuro-Oncology 2016:18(1):132-141.
3. Luciani A, Viqnaud A, Cavet M, et al. Liver cirrhosis: intravoxel incoherent motion MR imaging--pilot study. Radiology 2008:249(3):891-899.
4. Andreou A, Koh DM, Collins DJ, et al. Measurement reproducibility of perfusion fraction and pseudodiffusion coefficient derived by intravoxel incoherent motion diffusion-weighted MR imaging in normal liver and metastases. Eur Radiol 2013:23(2):428-434.
5. Federau C, Haqmann P, Maeder P, et al. Dependence of brain intravoxel incoherent motion perfusion parameters on the cardiac cycle. PLoS One 2013: 8(8): e72856.
Figures