1618
In-vivo line-scan diffusion MR at 250 micron inline resolution within human cerebral cortex at 7T1Harvard Medical School, Boston, MA, United States, 2Department of Radiology, Boston Children's Hospital, Boston, MA, United States, 3Department of Neurology, Boston Children's Hospital, Boston, MA, United States, 4Department of Radiology, Brigham and Women's Hospital, Boston, MA, United States, 5Department of Radiology, Sahlgrenska University Hospital, Gothenburg, Sweden, 6Athinoula A. Martinos Center for Biomedical Imaging, Department of Radiology, Massachusetts General Hospital, Charlestown, MA, United States, 7Harvard-MIT Division of Health Sciences and Technology, Massachusetts Institute of Technology, Cambridge, MA, United States
Synopsis
We used the line-scan technique to measure in-vivo diffusion at 7T within human primary somatosensory cortex (S1) and primary motor cortex (M1), achieving voxel sizes as low as 0.25 mm in the radial direction (i.e., orthogonal to the cortical surface). Our results are consistent with recent reports of predominantly tangential diffusion in S1 and, to a lesser extent, radial diffusion in M1; however, the smaller voxel sizes used in our study alleviate concerns regarding partial-volume effects and, perhaps more importantly, enable the study of fine-scale variations in diffusion structure across cortical layers.
Purpose
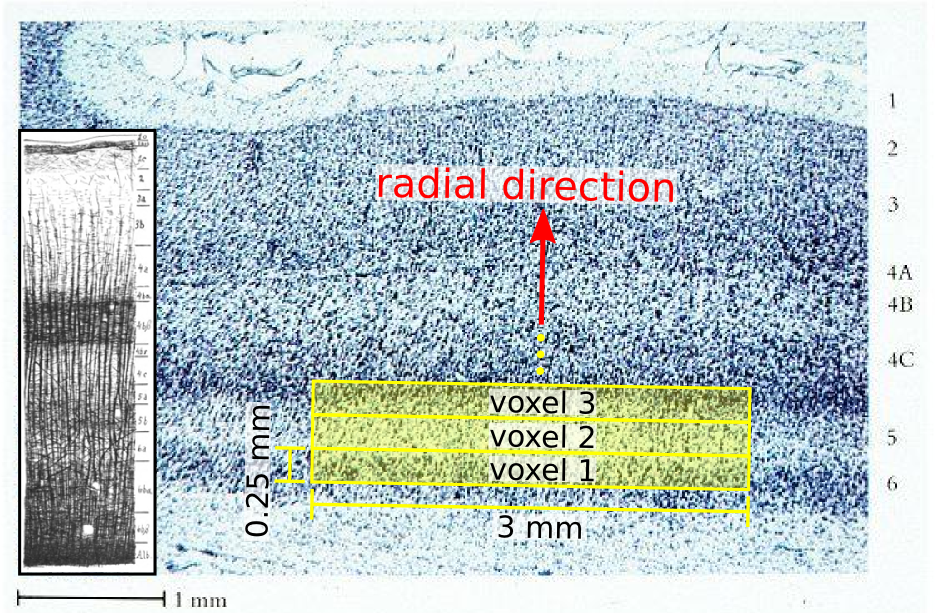
Cortical gray matter has far greater structural variation radially (i.e., perpendicular to the cortical sheet) than tangentially[1,2], suggesting the utility of reducing the voxel size in the radial direction in order to interrogate this structure, with the resulting loss in signal-to-noise ratio (SNR) offset by the choice of larger voxel sizes in the tangential directions (Fig. 1). The goal of this study was to measure cortical diffusion in vivo at 7T using the line-scan technique[3-5] to obtain radial voxel sizes down to 0.25 mm (250 microns), resulting in spatial resolution that is hard to achieve with standard single-shot EPI acquisitions, especially at higher field strengths.Methods
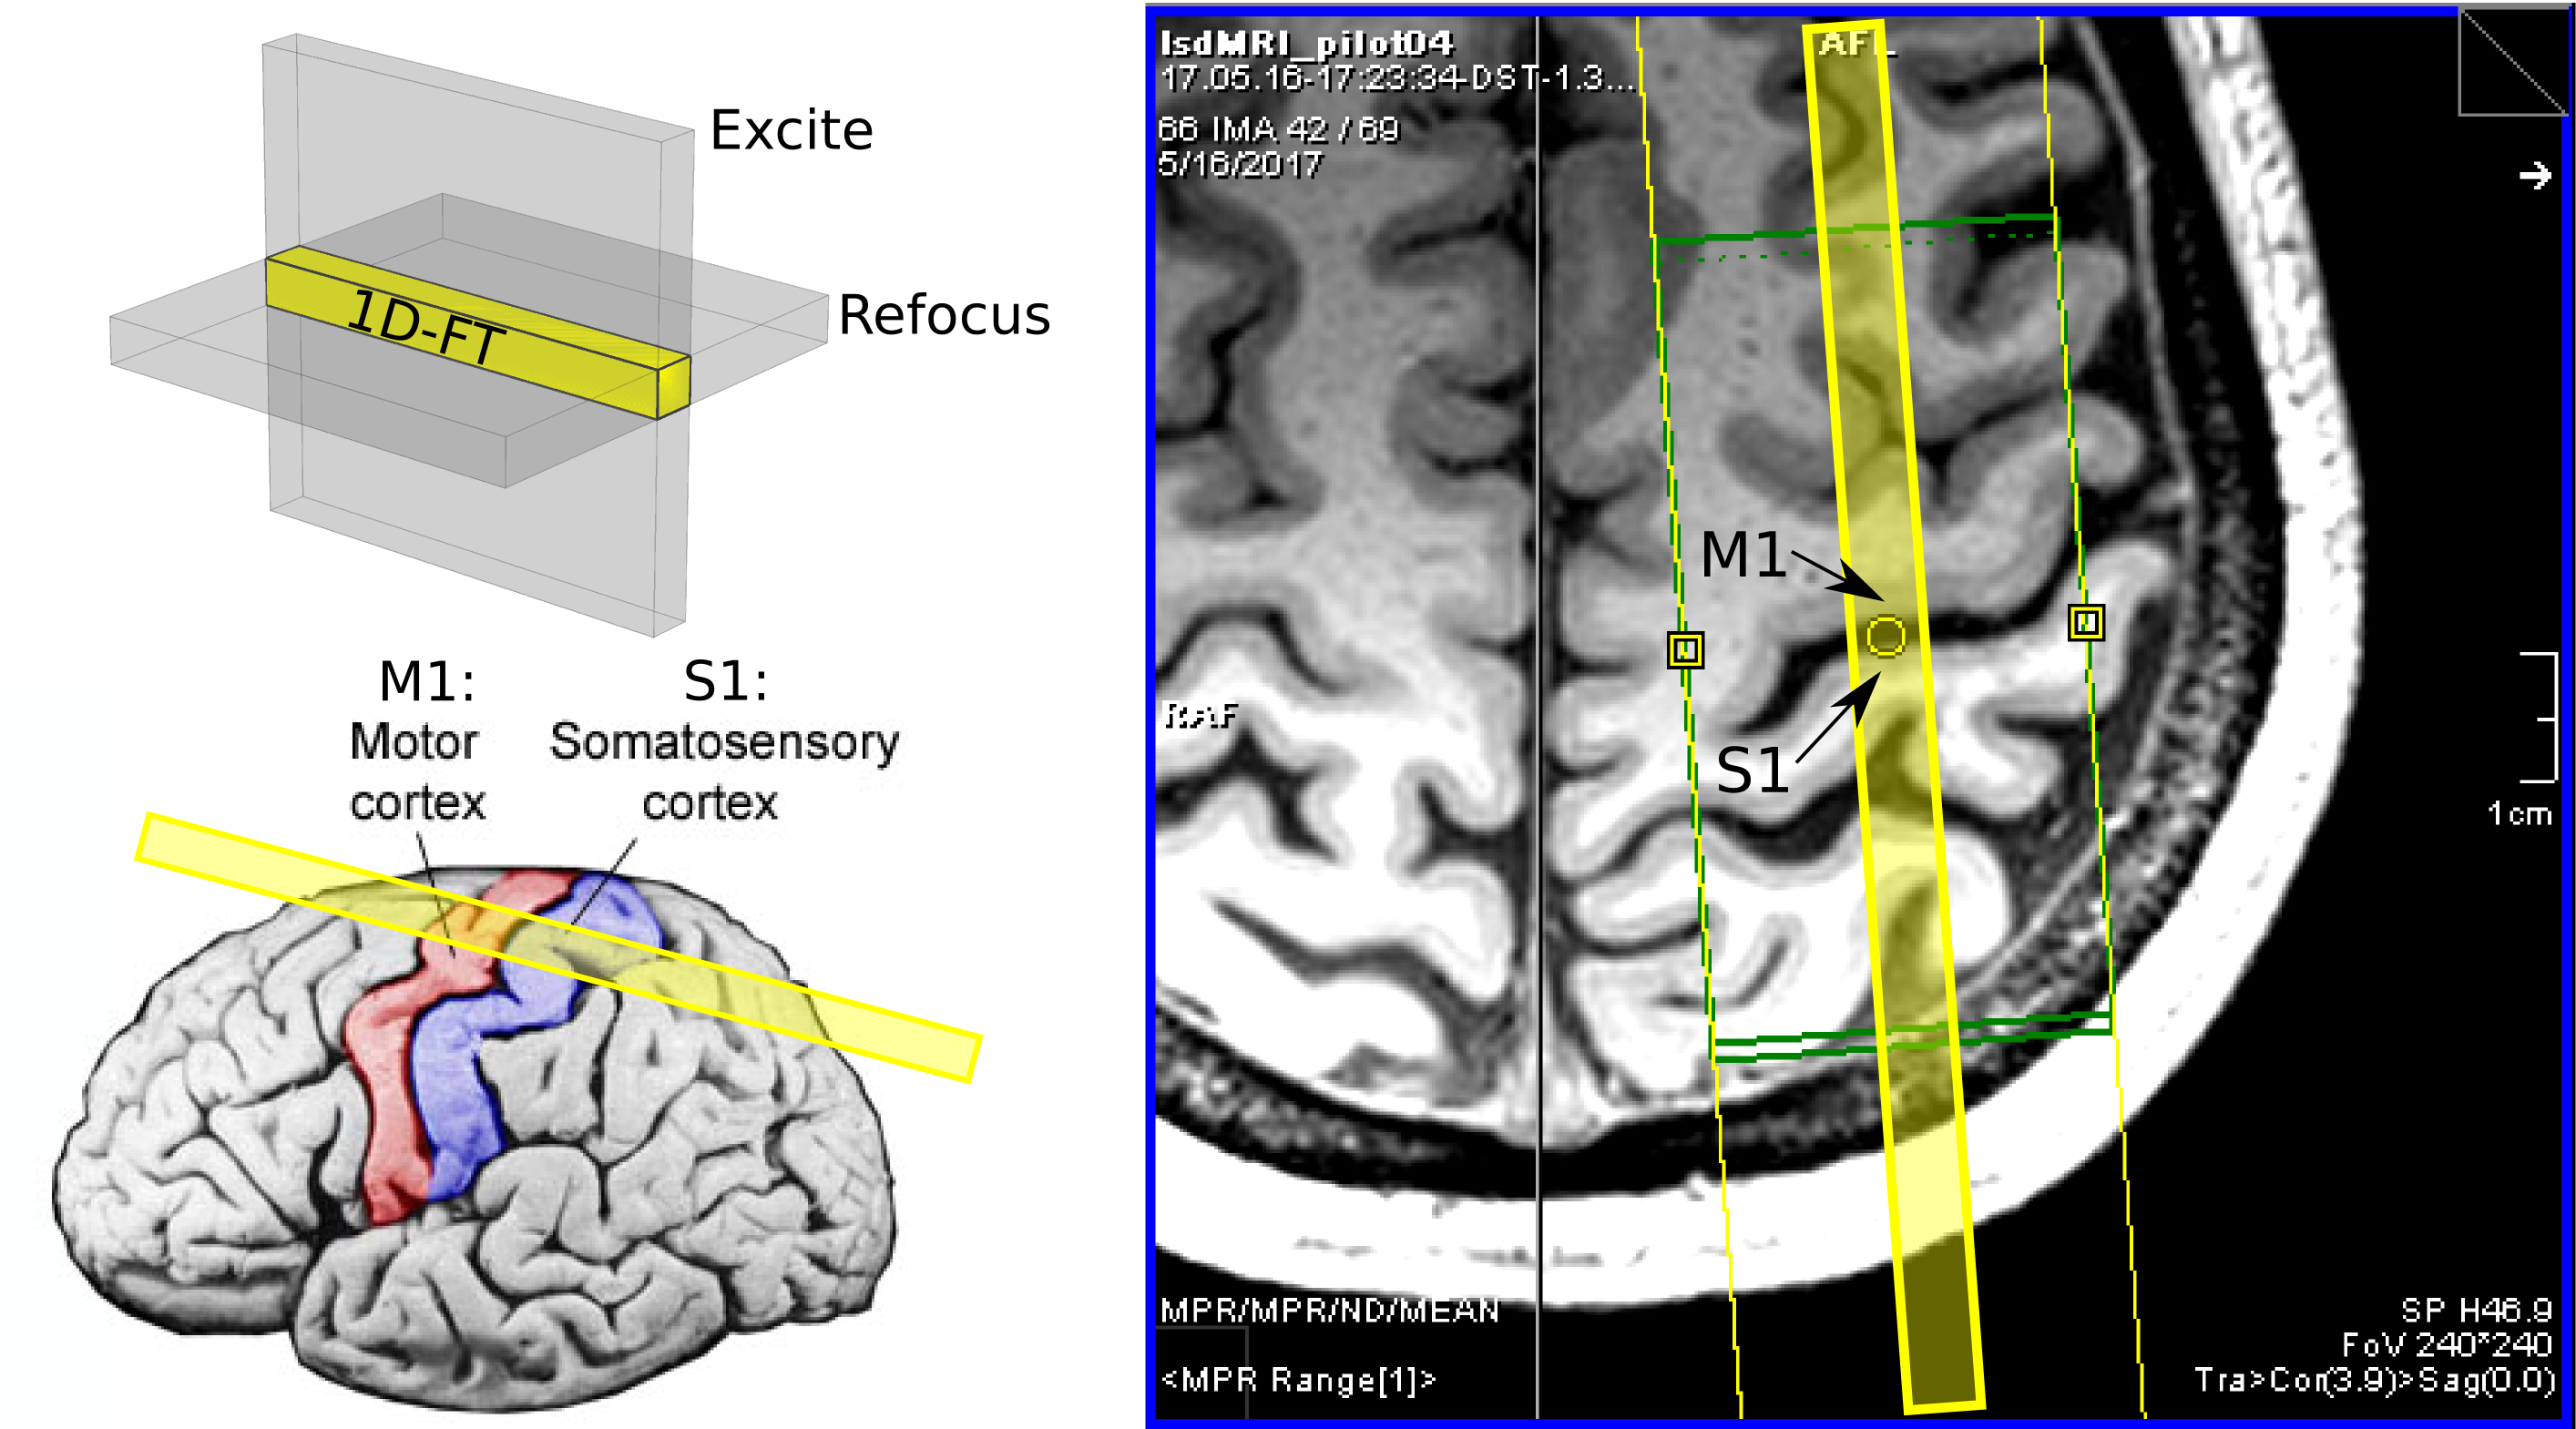
Two healthy volunteers (1F/1M, ages: 25–26 years), having given informed consent, were scanned on a Siemens 7T whole-body scanner using a custom-built 31-channel head receive coil and birdcage transmit coil. On each volunteer, a 0.75×0.75×0.75 mm3 FOCI-ME-MPRAGE scan[6] was acquired in ~8 minutes with the following parameters: FA = 7°, TE1/TE2/TI/TR = 1.76/3.7/1100/2530 ms, GRAPPA acceleration factor = 2. A single line was acquired with the line-scan diffusion sequence[3-5], prescribed as perpendicularly as possible to primary somatosensory cortex S1 and primary motor cortex M1 (Fig. 2), using the MPRAGE images as anatomical localizers. The line-scan acquisition parameters were as follows: TR/TE = 2000/50 ms, BW ≈ 120 Hz/pixel, 21 b-values equally spaced from “0” to 1000 s/mm2 (∆/δ = 21.77/16.79 ms and with G = 54.6 mT/m for b = 1000 s/mm2) and three diffusion directions: one parallel to the line, and two perpendicular to the line and to one another. We acquired one run with 0.5 mm voxel size along the line (~2 minute acquisition) and four runs with 0.25 mm voxel size (~8 minutes), with a 256 mm readout field-of-view and nominal line thickness of 3 mm in each case.
To remove shot-to-shot phase variations, the following scheme was used: for each voxel, the average complex-valued signal over a 16 mm window was computed, and the phase of this average was subtracted from the phase of the voxel, on a per-coil basis and for each b-value and each run. The resulting phase-corrected complex signal was then averaged across runs prior to root-sum-of-squares coil combination. The monoexponential model was then fitted per-voxel to the resulting signal versus the 19 b-values between 100 and 1000 s/mm2, using the Levenberg-Marquardt nonlinear least-squares algorithm in MATLAB, yielding an apparent diffusion coefficient (ADC) for each direction. The y-intercept of the fit divided by the standard deviation of the residuals provided an estimate of the SNR at b = 0 for each voxel and diffusion direction.
Results
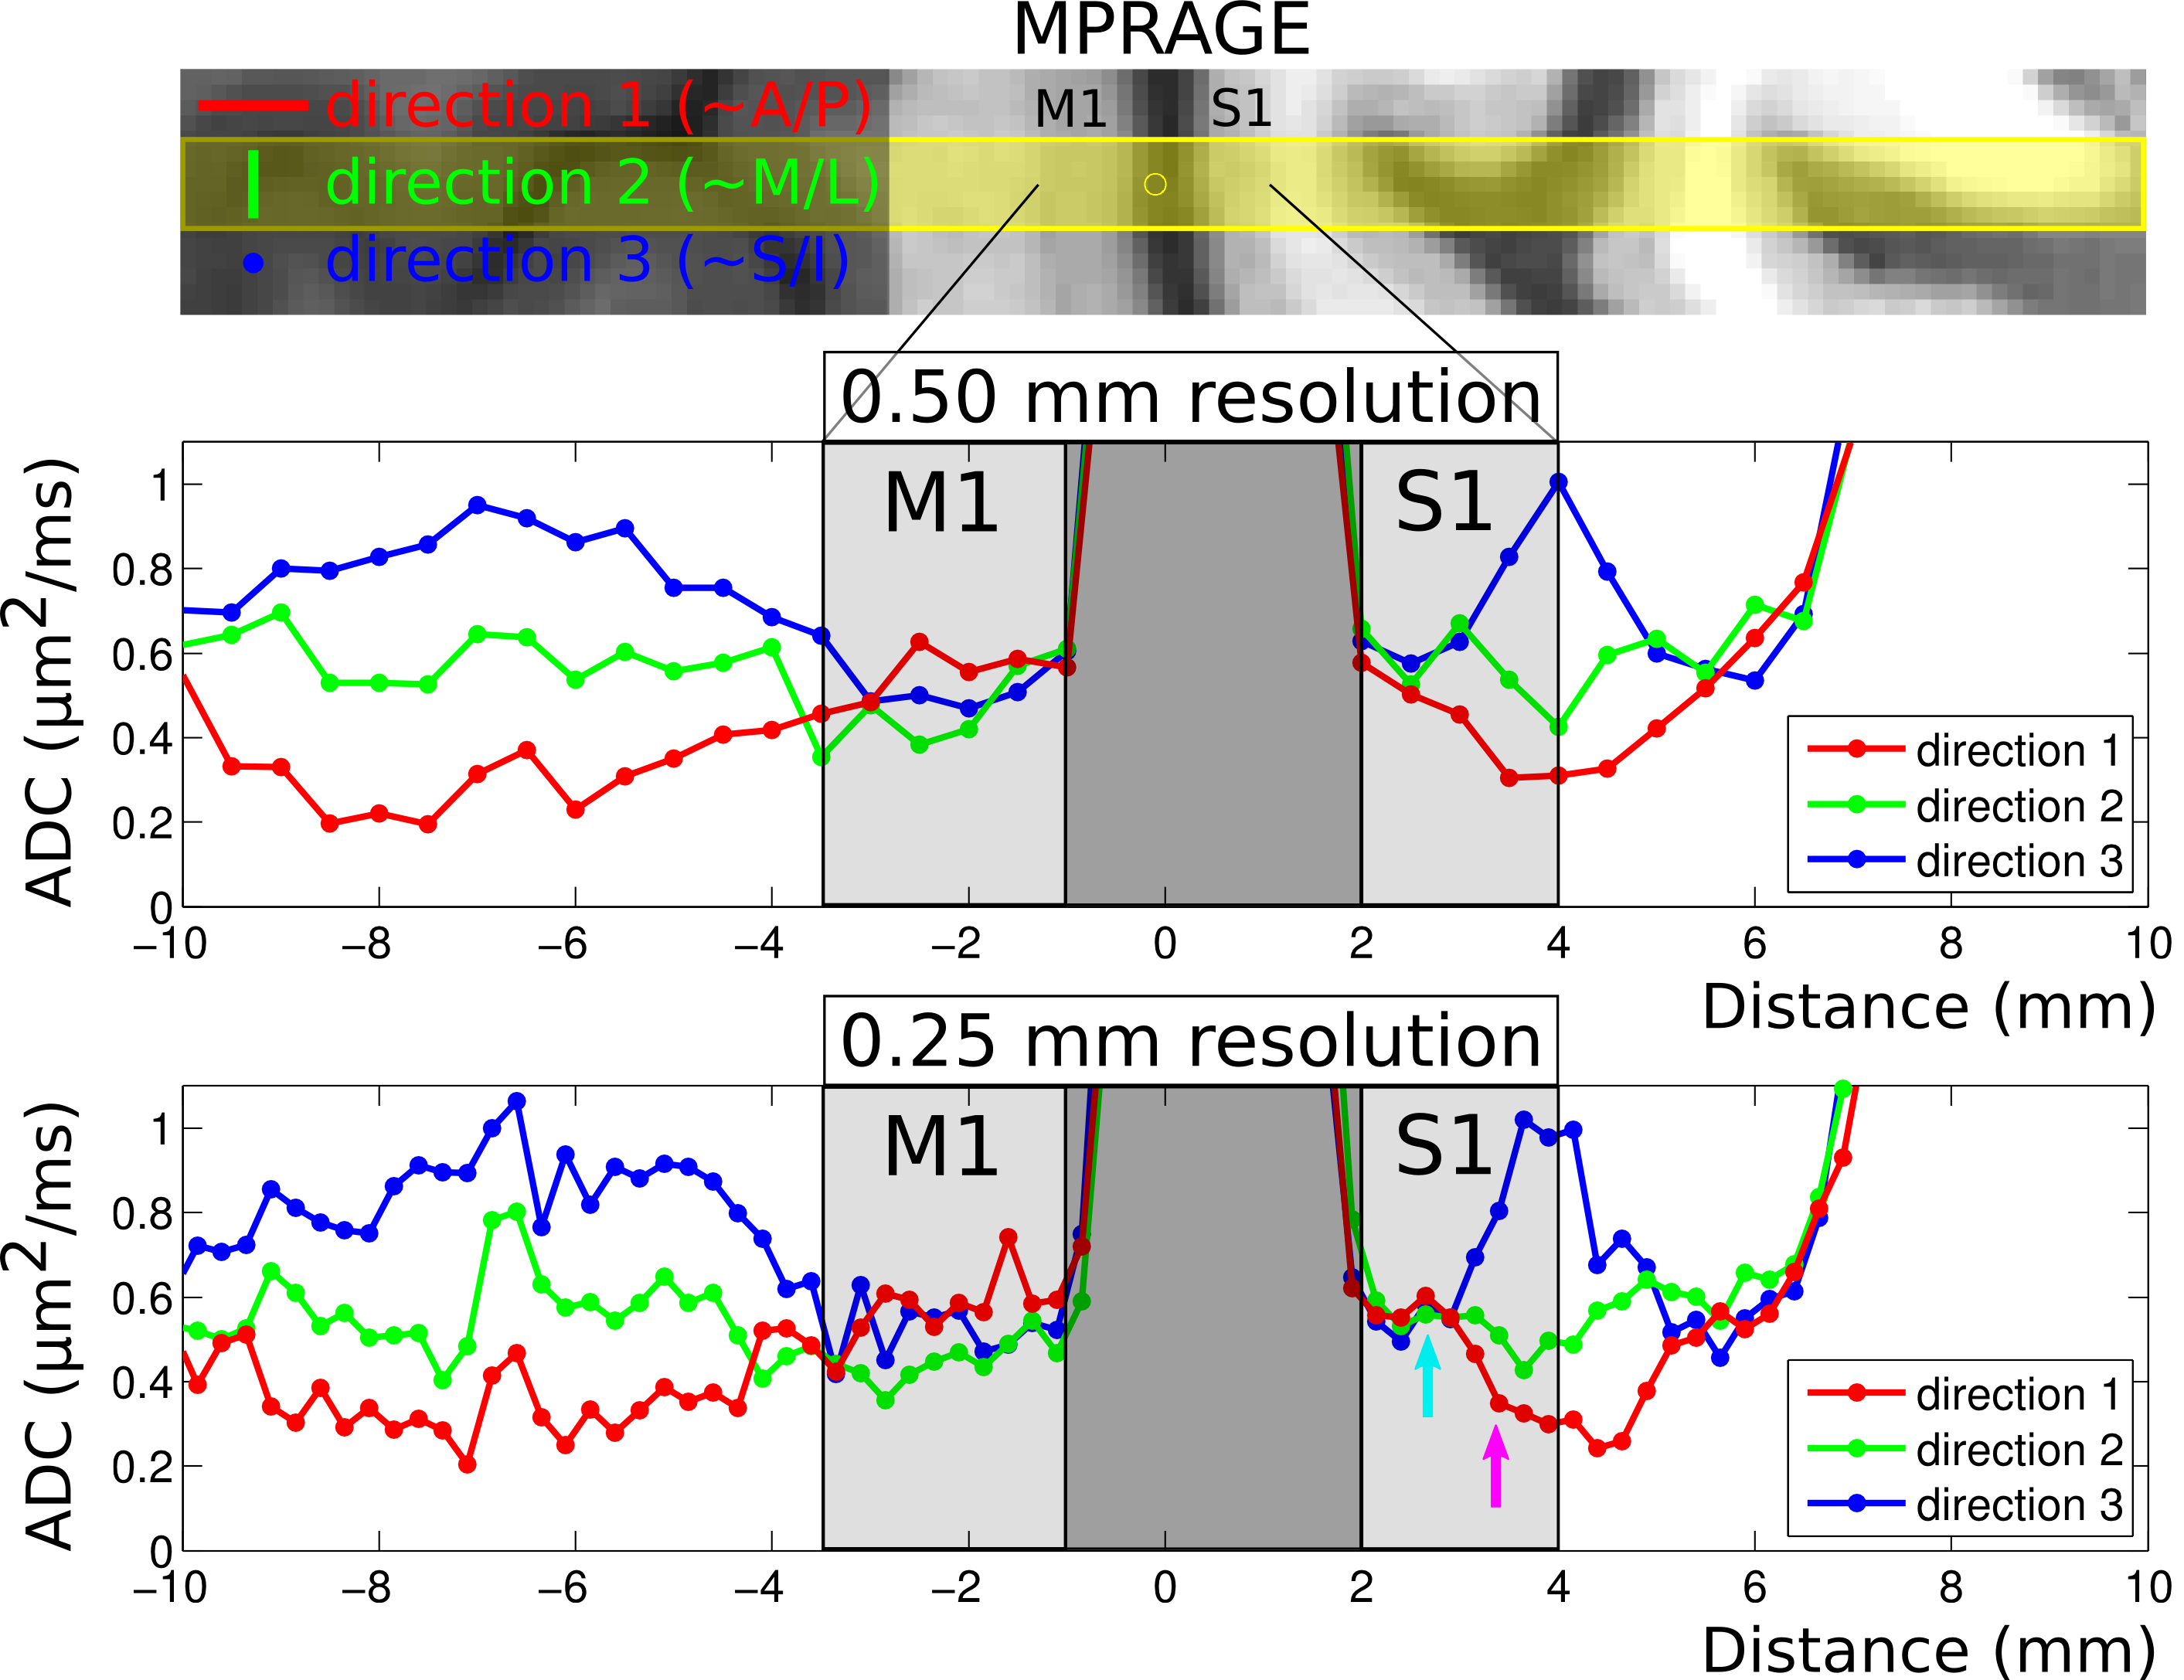
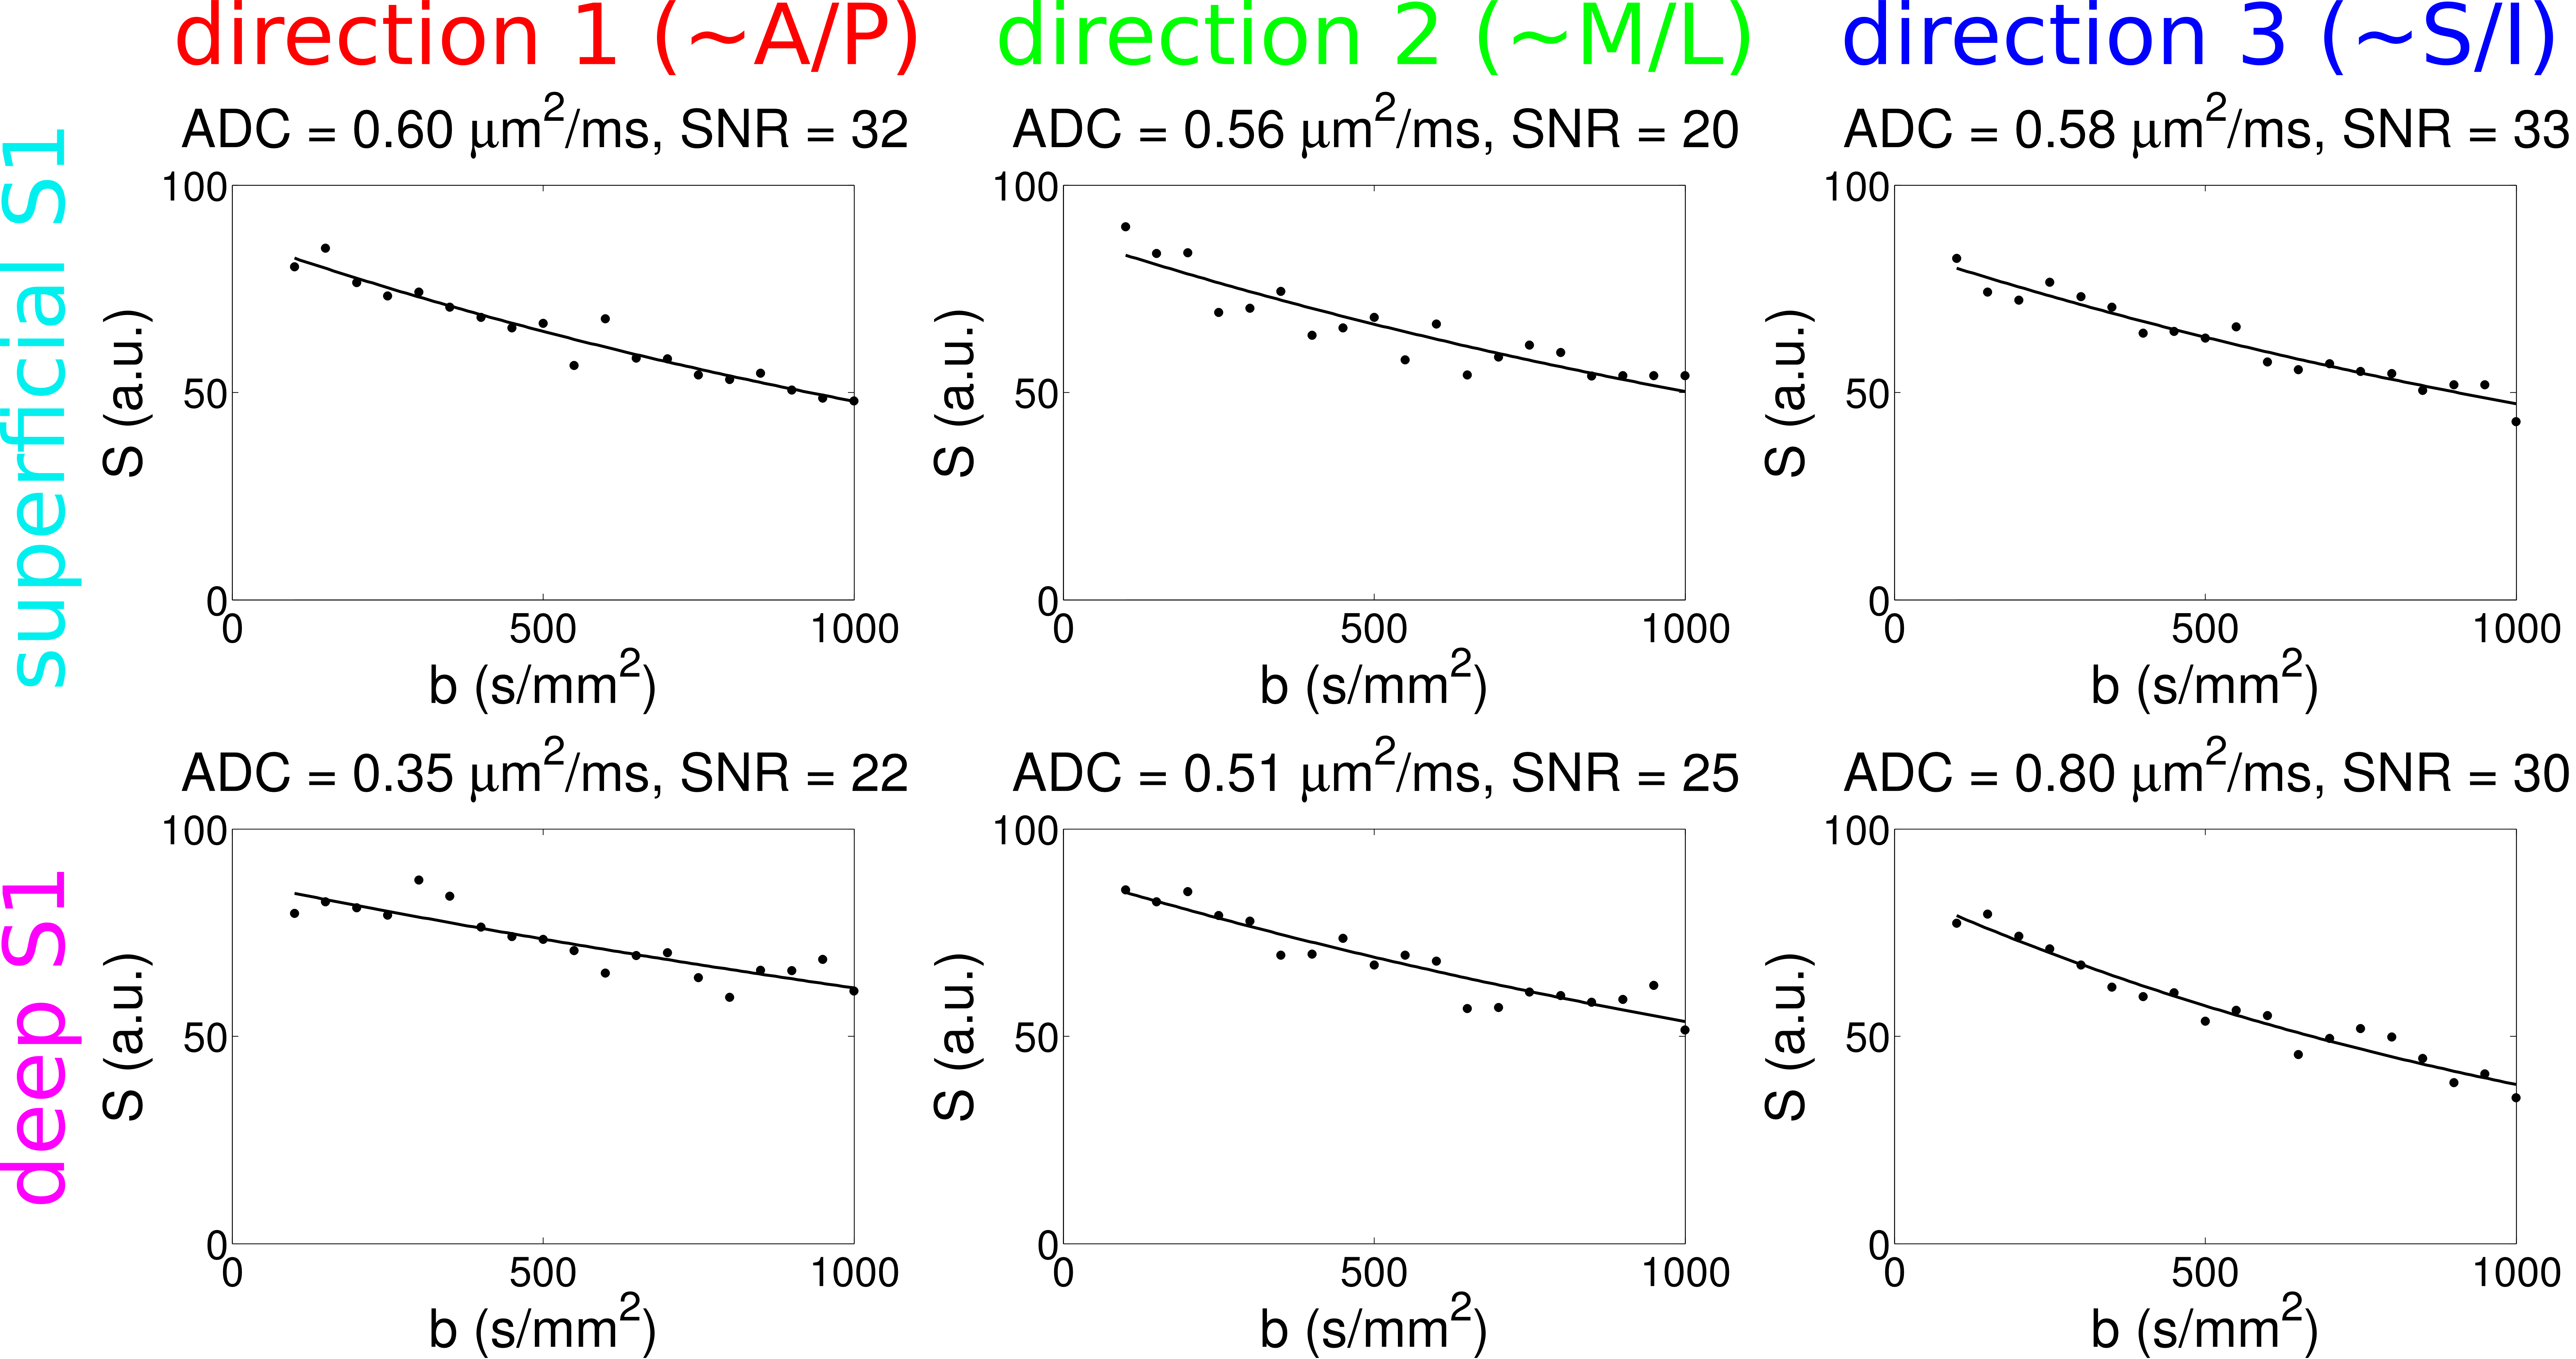
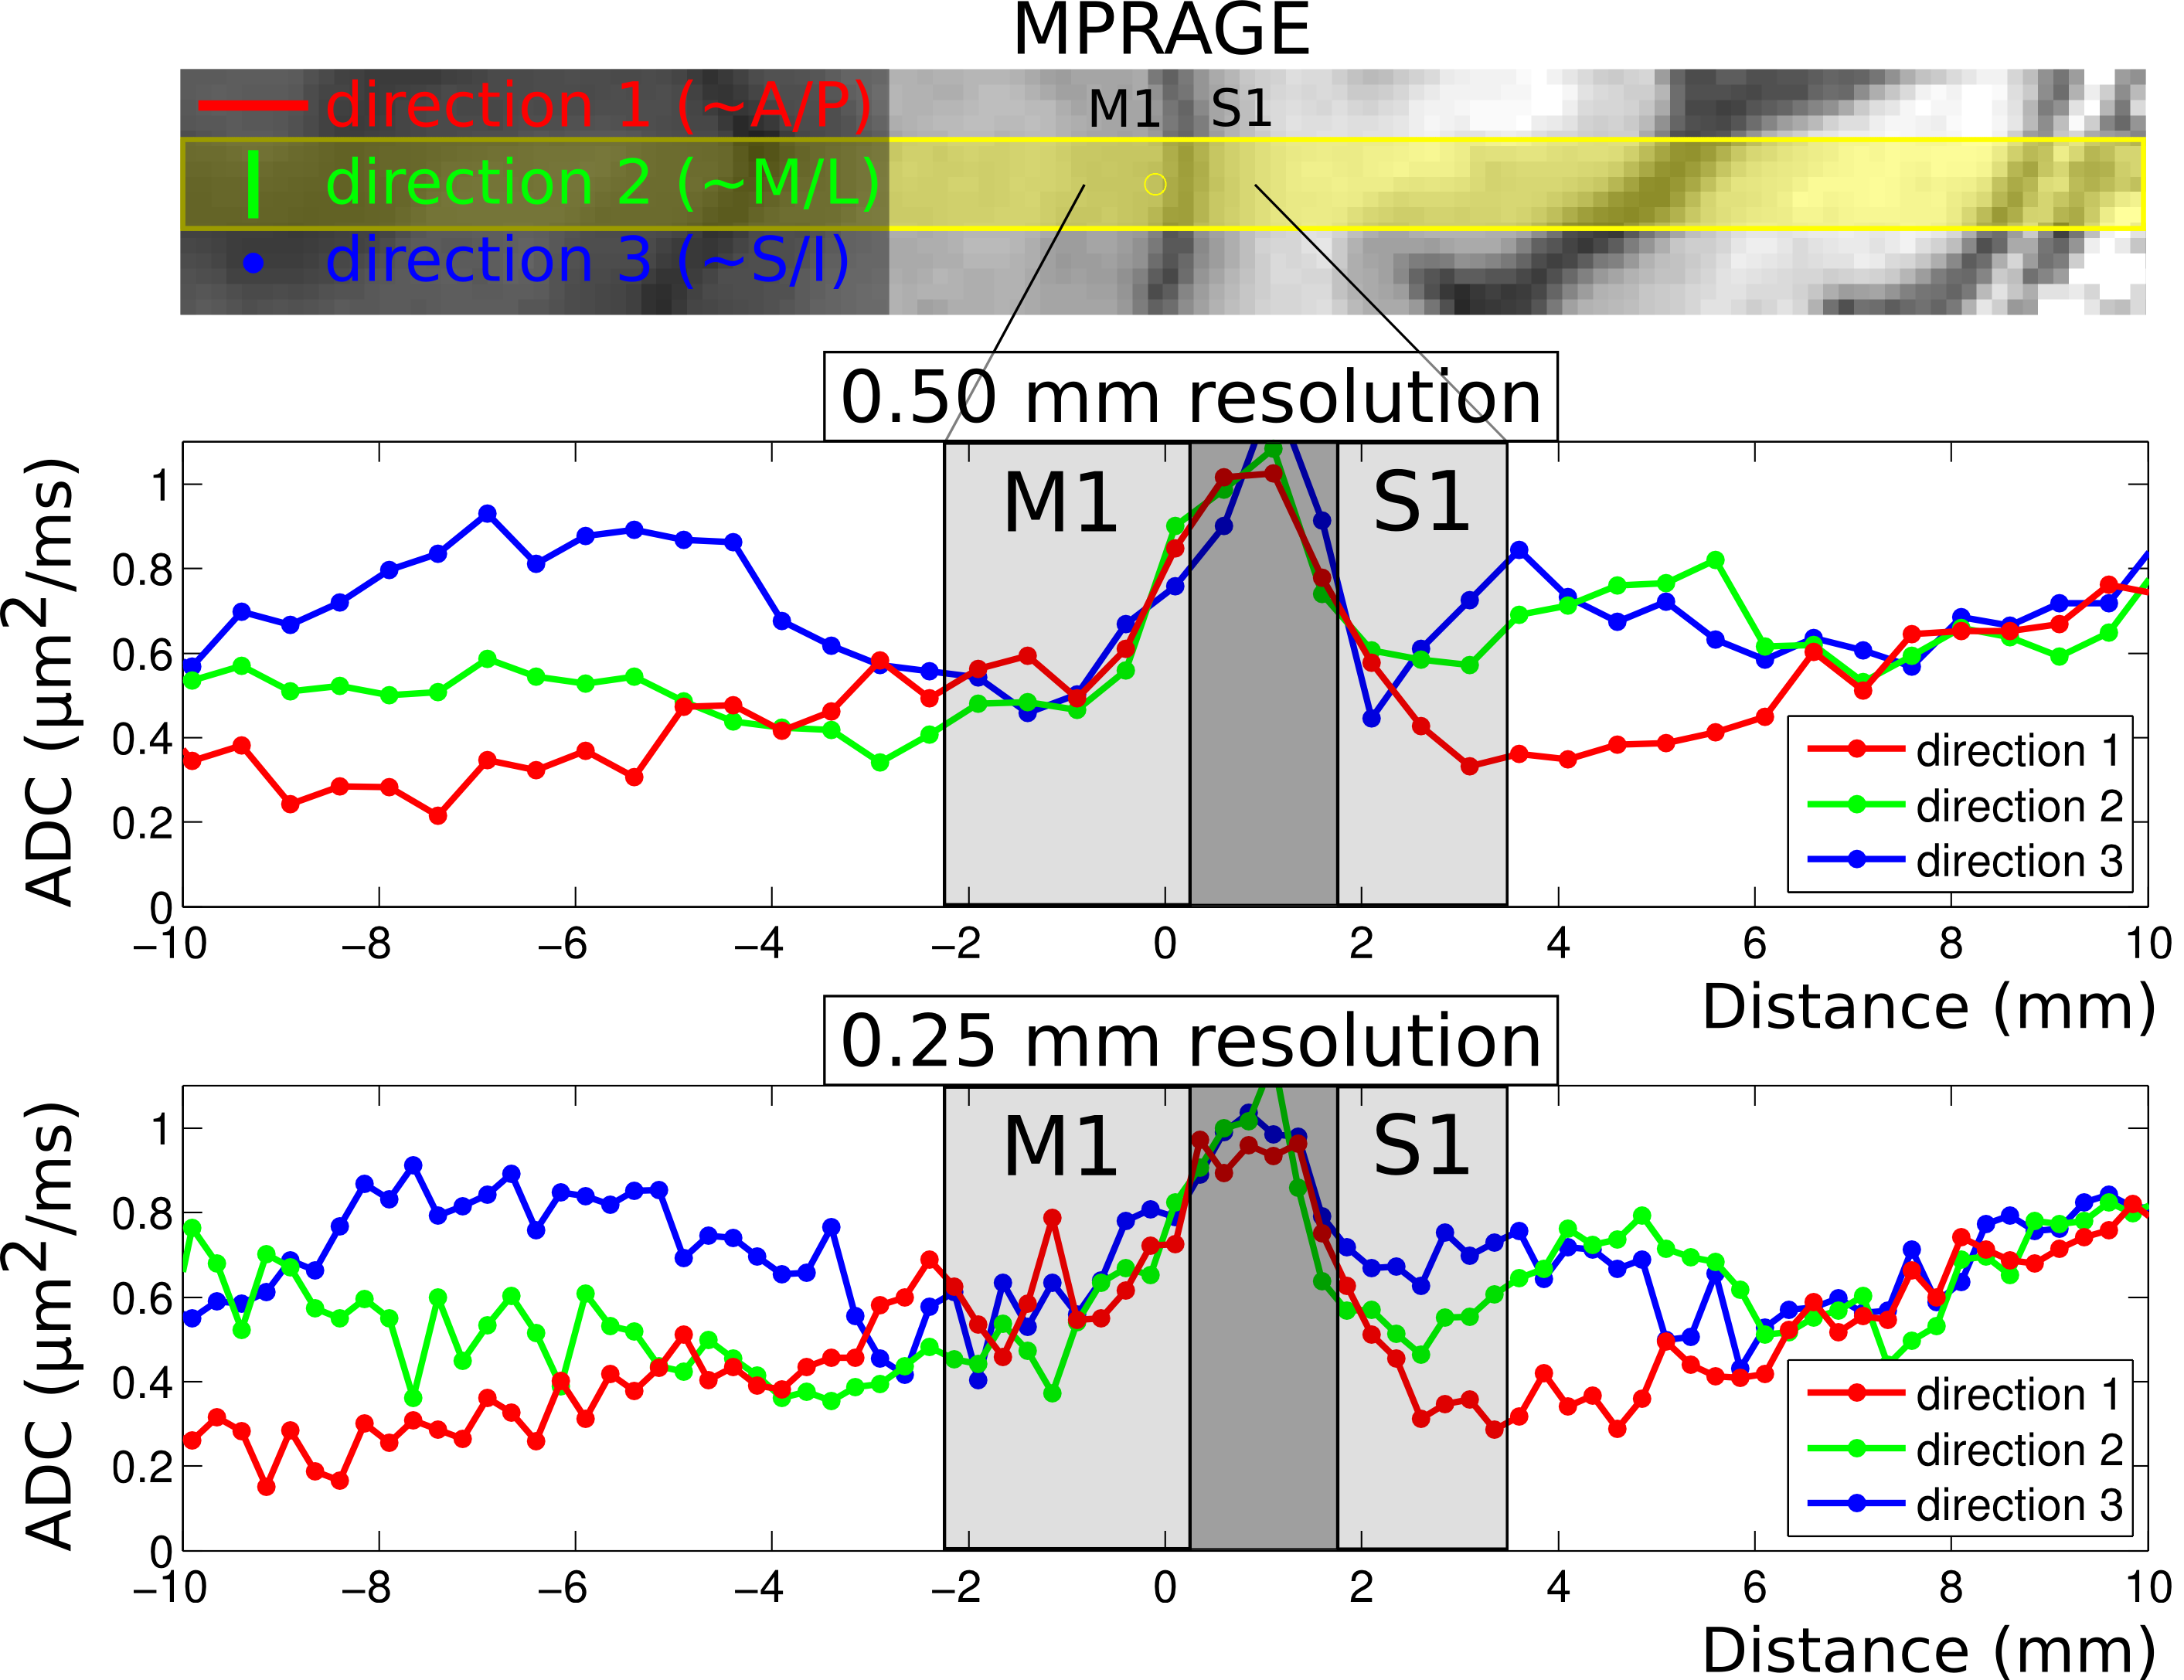
Results from the first volunteer are presented in Fig. 3, with the upper panel showing MPRAGE data and with the prescribed line for the diffusion scans overlaid in yellow. The middle panel shows ADCs for each diffusion direction for the 0.5 mm data and the bottom panel shows the corresponding ADCs for the 0.25 mm data. Note that in the superficial layers of S1 (around the cyan arrow), ADCs appear to be quite similar for the three directions, whereas substantial anisotropy is observed in the deeper layers (around the purple arrow), with the primary diffusion direction appearing to be non-radial. Although these results can be seen to some extent in the 0.5 mm data, they are particularly evident at 0.25 mm. In M1, much less difference is seen at all depths between ADCs for each of the three directions, but with a slight bias towards higher ADCs in the radial direction. Fig. 4 shows plots of signal versus b-value in this volunteer, for one 0.25 mm voxel in superficial S1 and for one in deep S1 (cyan and purple arrows in Fig. 3), with SNRs (at b = 0) of ~25. Results for the second volunteer are presented in Fig. 5, in the same format as Fig. 3, again showing evidence of greater diffusion anisotropy in the deeper layers of S1.Discussion
Our results demonstrate the feasibility of making in-vivo diffusion measurements at 7T within cortical gray matter down to a radial resolution of 0.25 mm, approaching the thickness of individual cortical layers and thus potentially providing an unprecedented window into the fine-scale diffusion structure of cerebral cortex. Illustrating the value of making such measurements, we obtain results that are consistent with prior reports of primarily radial diffusion in M1 and primarily tangential diffusion in S1[7,8], but with reduced concern of partial-volume effects and with the finer-scale detail now available suggesting that the tangential diffusion in S1 originates mainly from the deeper cortical layers.Acknowledgements
Supported by the BWH-MGH 7T Pilot Study Grant, NIH grants P41-EB015896, R01-EB019437, R01-MH111419, R01-EB010195 and R01-CA154834, the Athinoula A. Martinos Center for Biomedical Imaging, and the Radiology Departments at BCH, BWH and MGH.References
[1] Hubel DH. Eye, Brain, and Vision. Scientific American Library 1988.
[2] Vogt C, Vogt O. Allgemeinere ergebnisse unserer hirnforschung. J Physiol Neurol (Leipz.) 1919;25:279–462.
[3] Gudbjartsson H, Maier SE, Mulkern RV, Mórocz IA, Patz S, Jolesz FA. Line scan diffusion imaging. Magn Reson Med 1996;36:509–519.
[4] Mulkern RV, Gudbjartsson H, Westin CF, Zengingonul HP, Gartner W, Guttmann CR, Robertson RL, Kyriakos W, Schwartz R, Holtzman D, Jolesz FA, Maier SE. Multi-component apparent diffusion coefficients in human brain. NMR Biomed 1999;12:51–62.
[5] Maier SE, Mulkern RV. Biexponential analysis of diffusion-related signal decay in normal human cortical and deep gray matter. Magn Reson Imaging 2008;26:897–904.
[6] Zaretskaya N, Fischl B, Reuter M, Renvall V, Polimeni JR. Advantages of cortical surface reconstruction using submillimeter 7 T MEMPRAGE. Neuroimage 2017;in press. PMID: 28970143.
[7] Anwander A, Pampel A, Knösche TR. In vivo measurement of cortical anisotropy by diffusion-weighted imaging correlates with cortex type. Proc Intl Soc Mag Reson Med 2010;18:109.
[8] McNab JA, Polimeni JR, Wang R, Augustinack JC, Fujimoto K, Stevens A, Triantafyllou C, Janssens T, Farivar R, Folkerth RD, Vanduffel W, Wald LL. Surface based analysis of diffusion orientation for identifying architectonic domains in the in vivo human cortex. Neuroimage 2013;69:87–100.
Figures