1613
A comparison of multi-ADC and DTI fit metrics of diffusion MRI data acquired with Stejskal-Tanner and asymmetric bipolar gradients at identical echo time.1Image Sciences Institute, UMC Utrecht and University Utrecht, Utrecht, Netherlands, 2Department of Radiology, UMC Utrecht, Utrecht, Netherlands
Synopsis
Asymmetric-Bipolar (AS) gradients have been proposed in diffusion MRI (dMRI) experiments as alternative to Stejskal-Tanner (ST) gradients to achieve flow and motion-compensation. However, it remains unclear whether the gradient shape affects commonly derived metrics. Data at multiple diffusion-weightings was acquired on 4 subjects with ST and flow-compensated gradients, then fit with a multi-ADC model and DTI. Results showed that some metrics, as free water signal fraction and fractional anisotropy were comparable between AS and ST, whereas diffusion coefficients and perfusion fraction were remarkably different. Great care is suggested when comparing studies using different waveforms despite other identical acquisition parameters.
Purpose
Diffusion MRI (dMRI) experiments can be performed with different gradient waveforms. Beside classic Stejskal-Tanner (ST) gradients, bipolar gradients (AS) have been suggested to achieve flow and motion-compensation(1,2). At low diffusion-weighting ST signal is sensitive to both pseudo-diffusion from the microvascular network and flow, while the latter effect is removed in AS by design.
Here we aim to investigate how metrics derived from a multi-exponential ADC fit(3,4), as the perfusion signal fraction (fIVIM)(5), and those from a DTI fit(6) of such data compare to the classic ST acquisitions in the brain.
Methods
Four healthy volunteers underwent brain MRI at 3T. The acquisition included a T2 weighted sequence (echo-time TE 202ms, repetition time TR 2.5s, SENSE 2, voxel-size 1x1x2mm3) and two dMRI sequences (TR 9.5s, SENSE 2.5, voxel-size 2.5x2.5x2.5mm3) with ST (TE=133ms) and AS (TE=135ms) gradients respectively. The gradient scheme included 3 orthogonal directions at b=0, 5, 10, 15, 20, 30, 40, 50, 75, 100, 150, 200, 300, 400, 500, 750s/mm2 and 30 gradient directions at b=1000s/mm2.
Segmentation masks of grey matter (GM), white matter (WM) and cerebro-spinal fluid (CSF) were derived on the T2 image of each subject(7,8), then aligned to the dMRI space of each subject(9). dMRI data was pre-processed with ExploreDTI(10) for motion/eddy-currents correction. ST and AS data were averaged within tissues after b=0s/mm2 normalization for comparison of their attenuation profiles. A two-sided t-test was performed for each diffusion-weighting.
For the voxel-wise multi-ADC fit, data at each diffusion-weighting b was geometric averaged (S), then a three-exponential equation was fit with a segmented approach:
$$S=f_{CSF}e^{-bD_{CSF}}+f_{IVIM}e^{-bD^{*}}+(1-f_{CSF}-f_{IVIM})e^{-bD}$$
where $$$f_{CSF}, f_{IVIM}$$$ refer to the CSF and perfusion (IVIM) signal fractions, $$$D_{CSF}, D^{*}$$$ are their ADC, and D is the tissue ADC. Histograms of $$$f_{IVIM}, f_{CSF}$$$ and D were computed within the tissue masks.
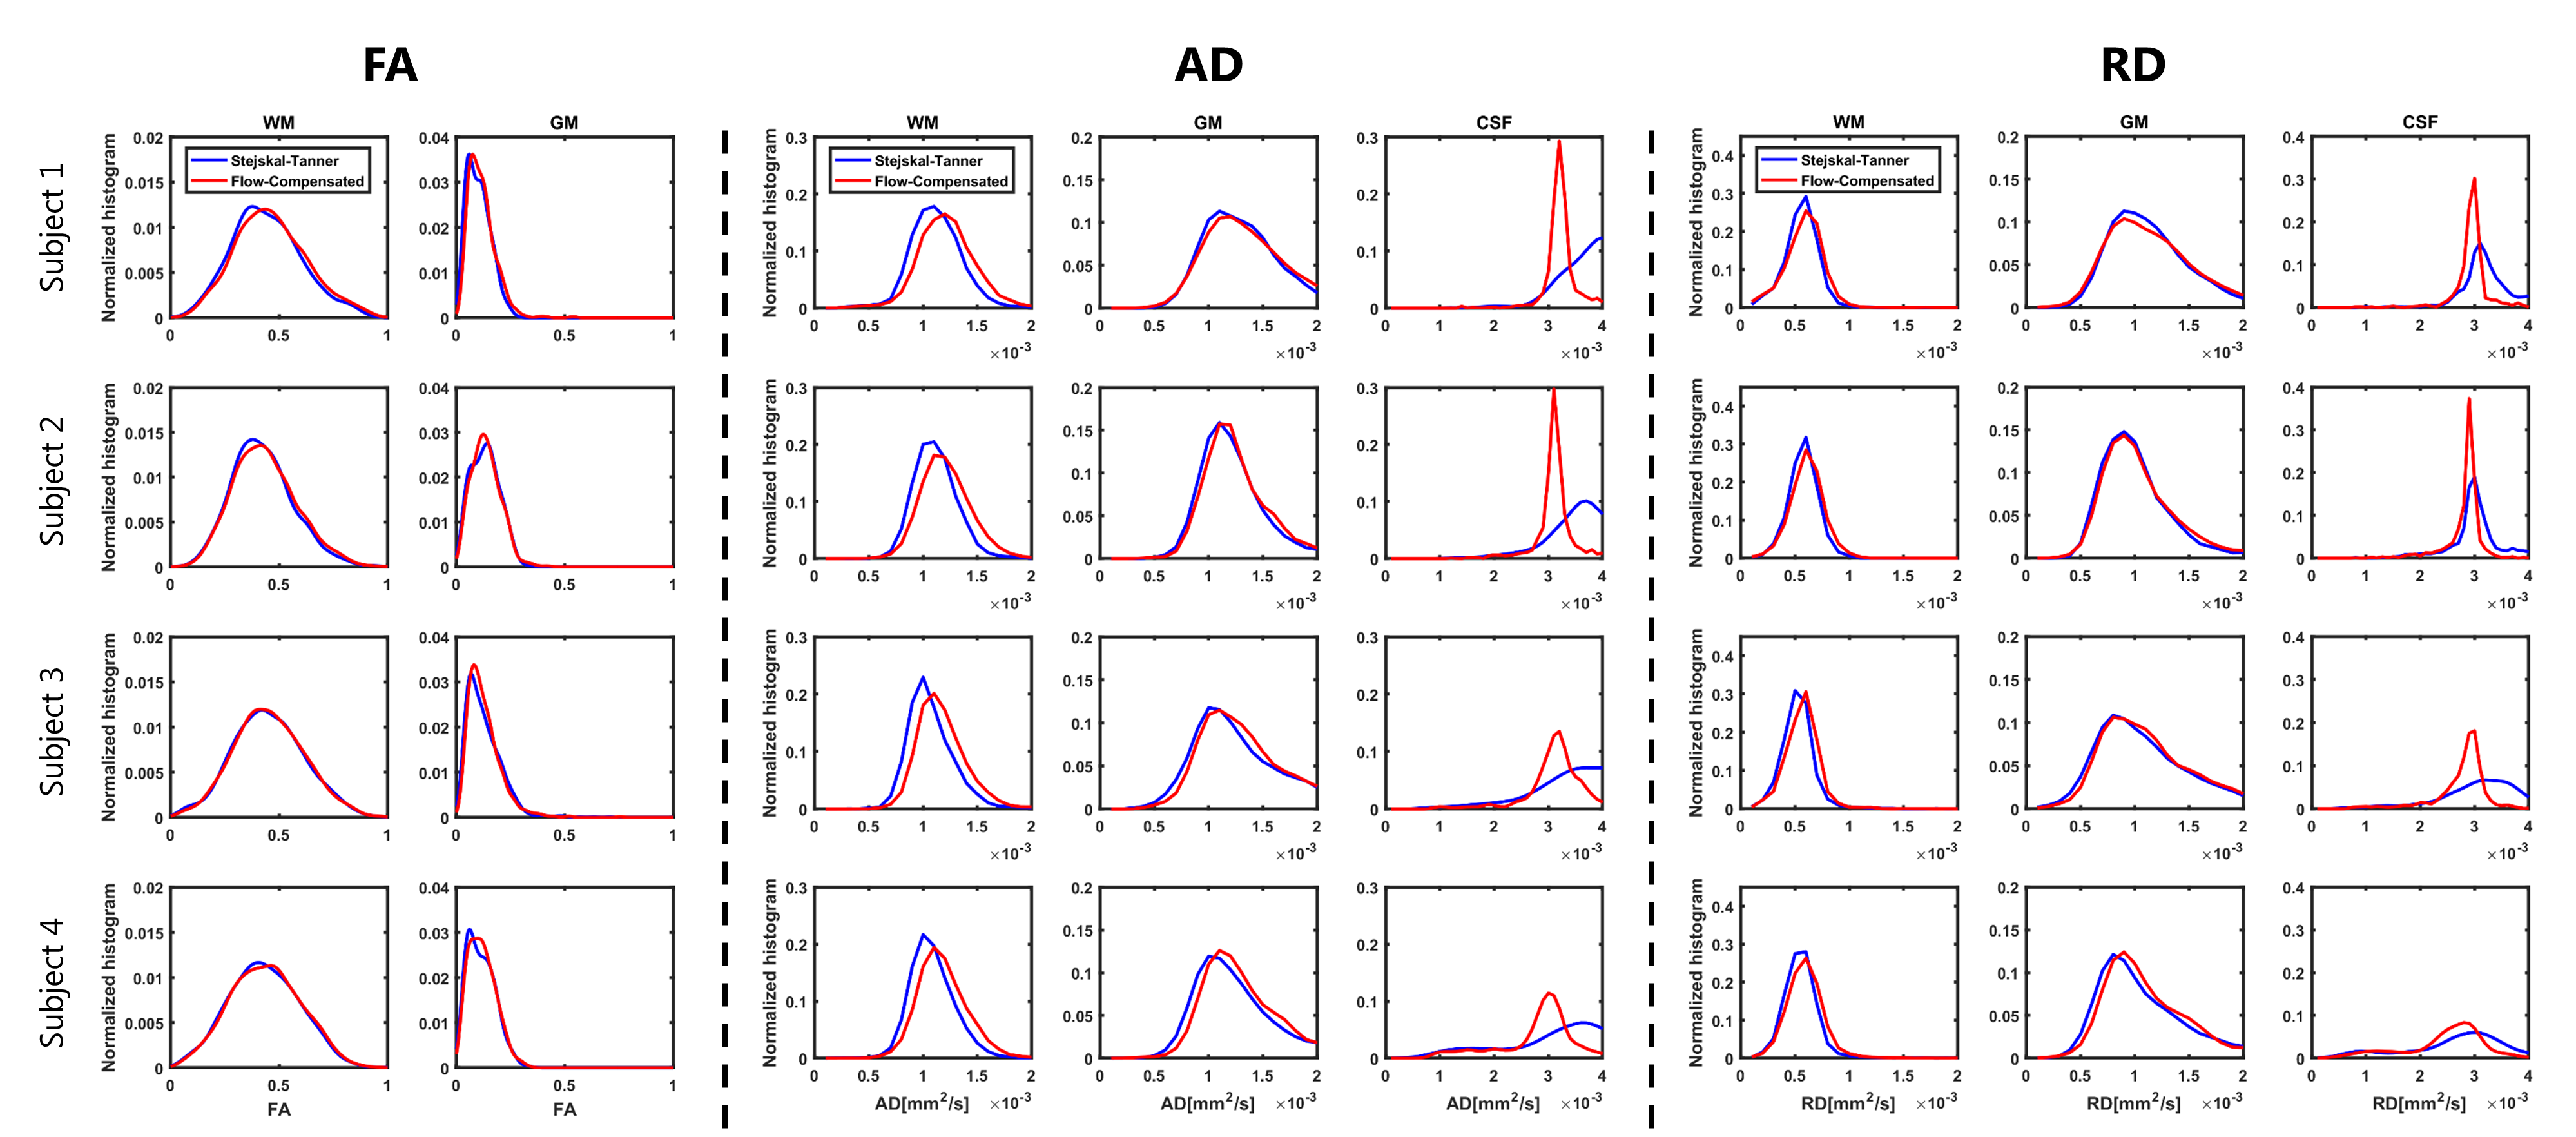
DTI fit of the data at b=0,1000s/mm2 was performed in ExploreDTI(11) to derive fractional anisotropy (FA), axial diffusivity (AD) and radial diffusivity (RD) maps. Histograms of these metrics were computed within tissue masks.
Results
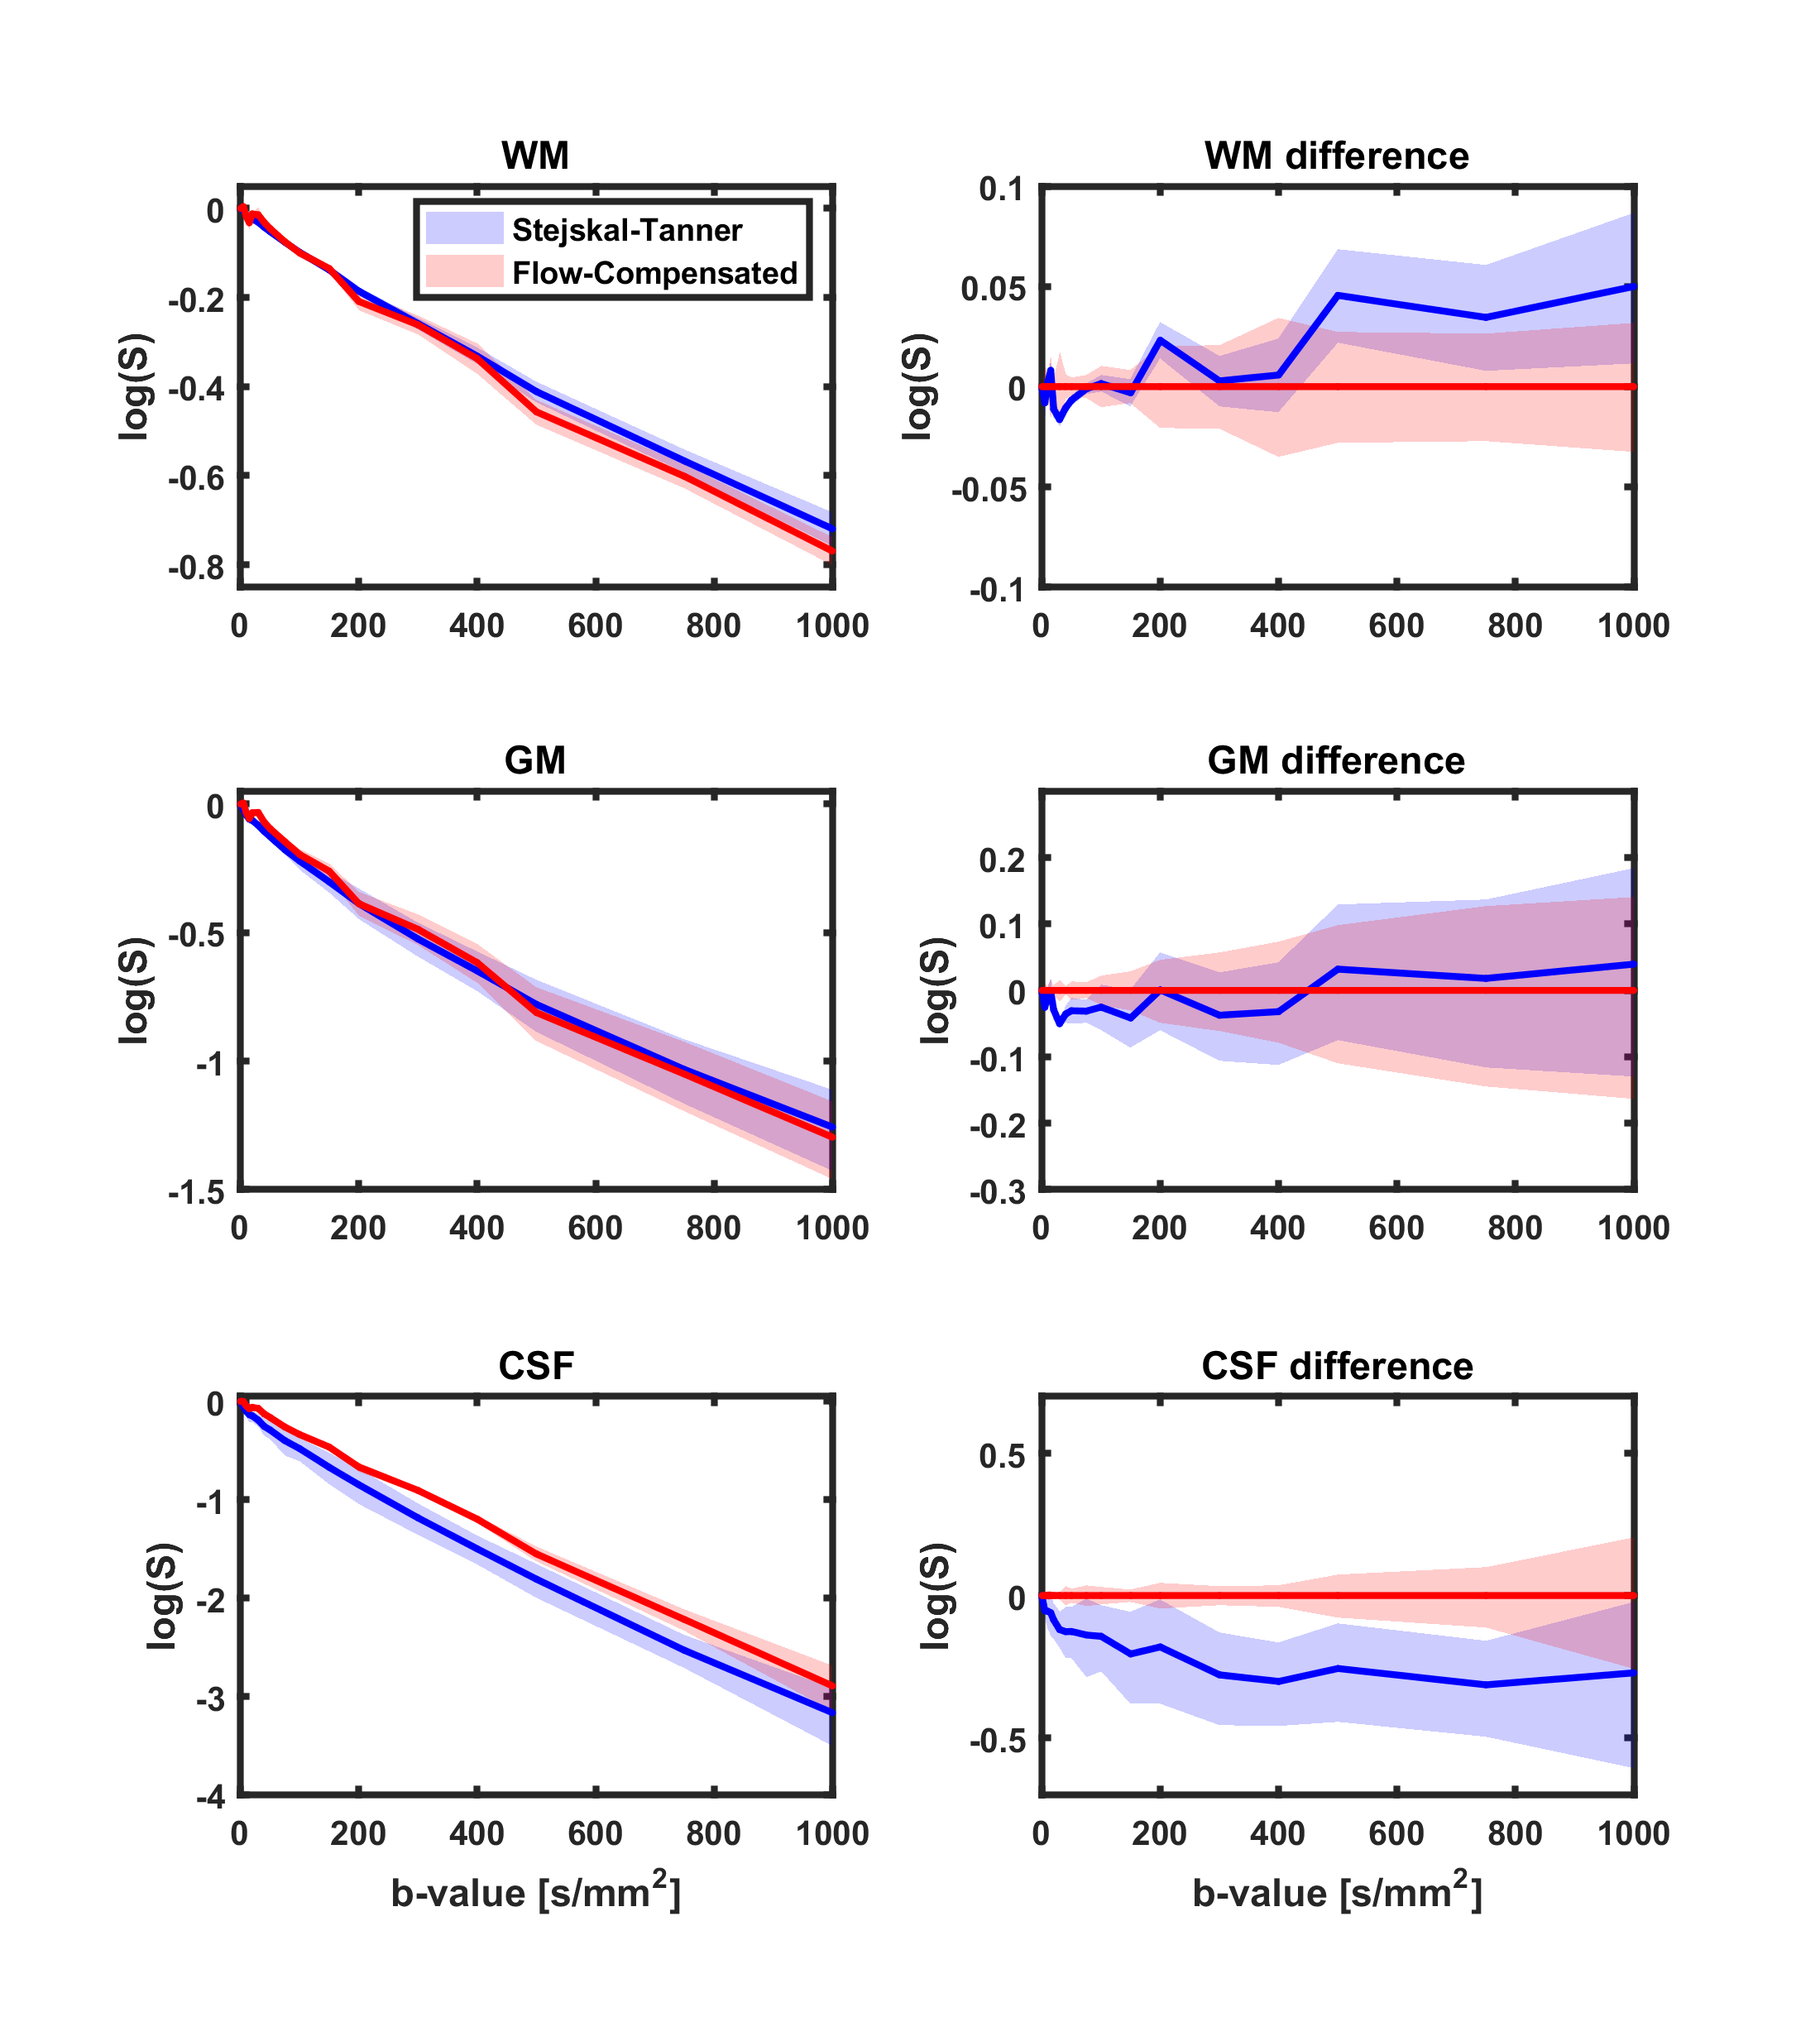
Figure 1 shows the confidence interval of the logarithm of the geometric averaged dMRI signals of all subjects in WM, GM and CSF. The signal attenuation of AS and ST was significantly different (p≤0.01) in GM for b≤75s/mm2, in WM for b in ranges 20-50, 200-1000s/mm2 and in CSF for all b-values.
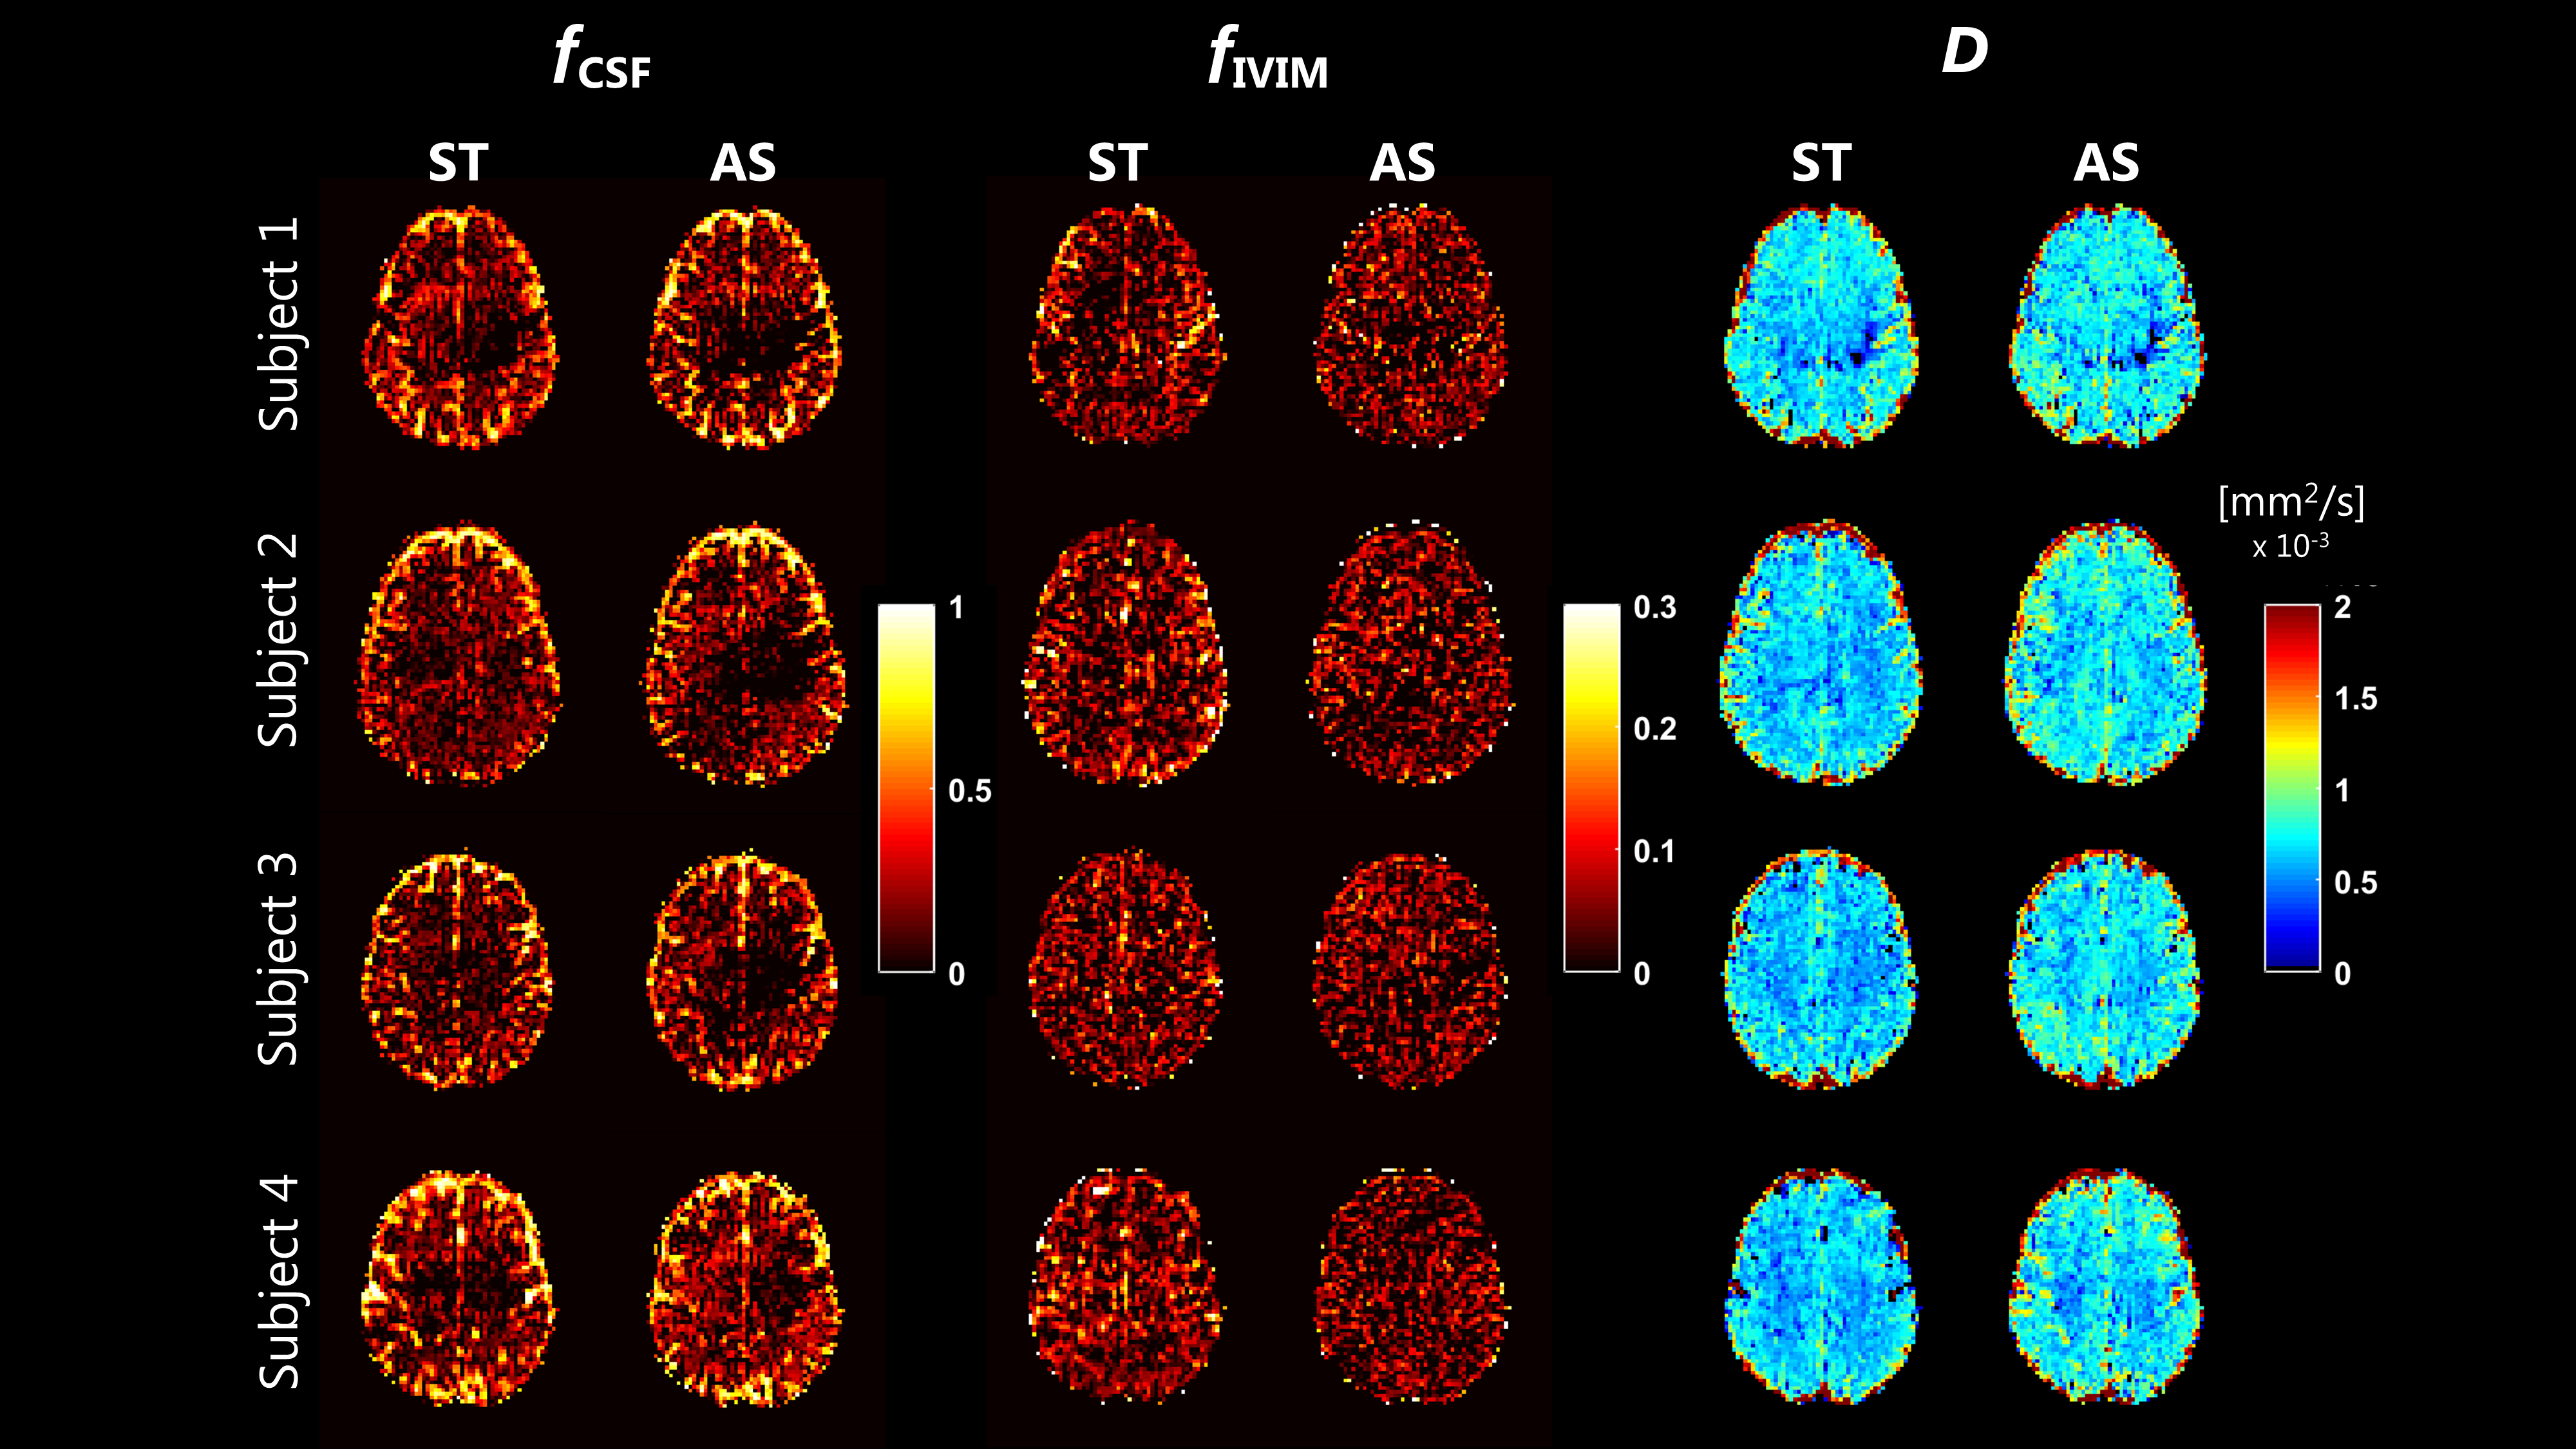
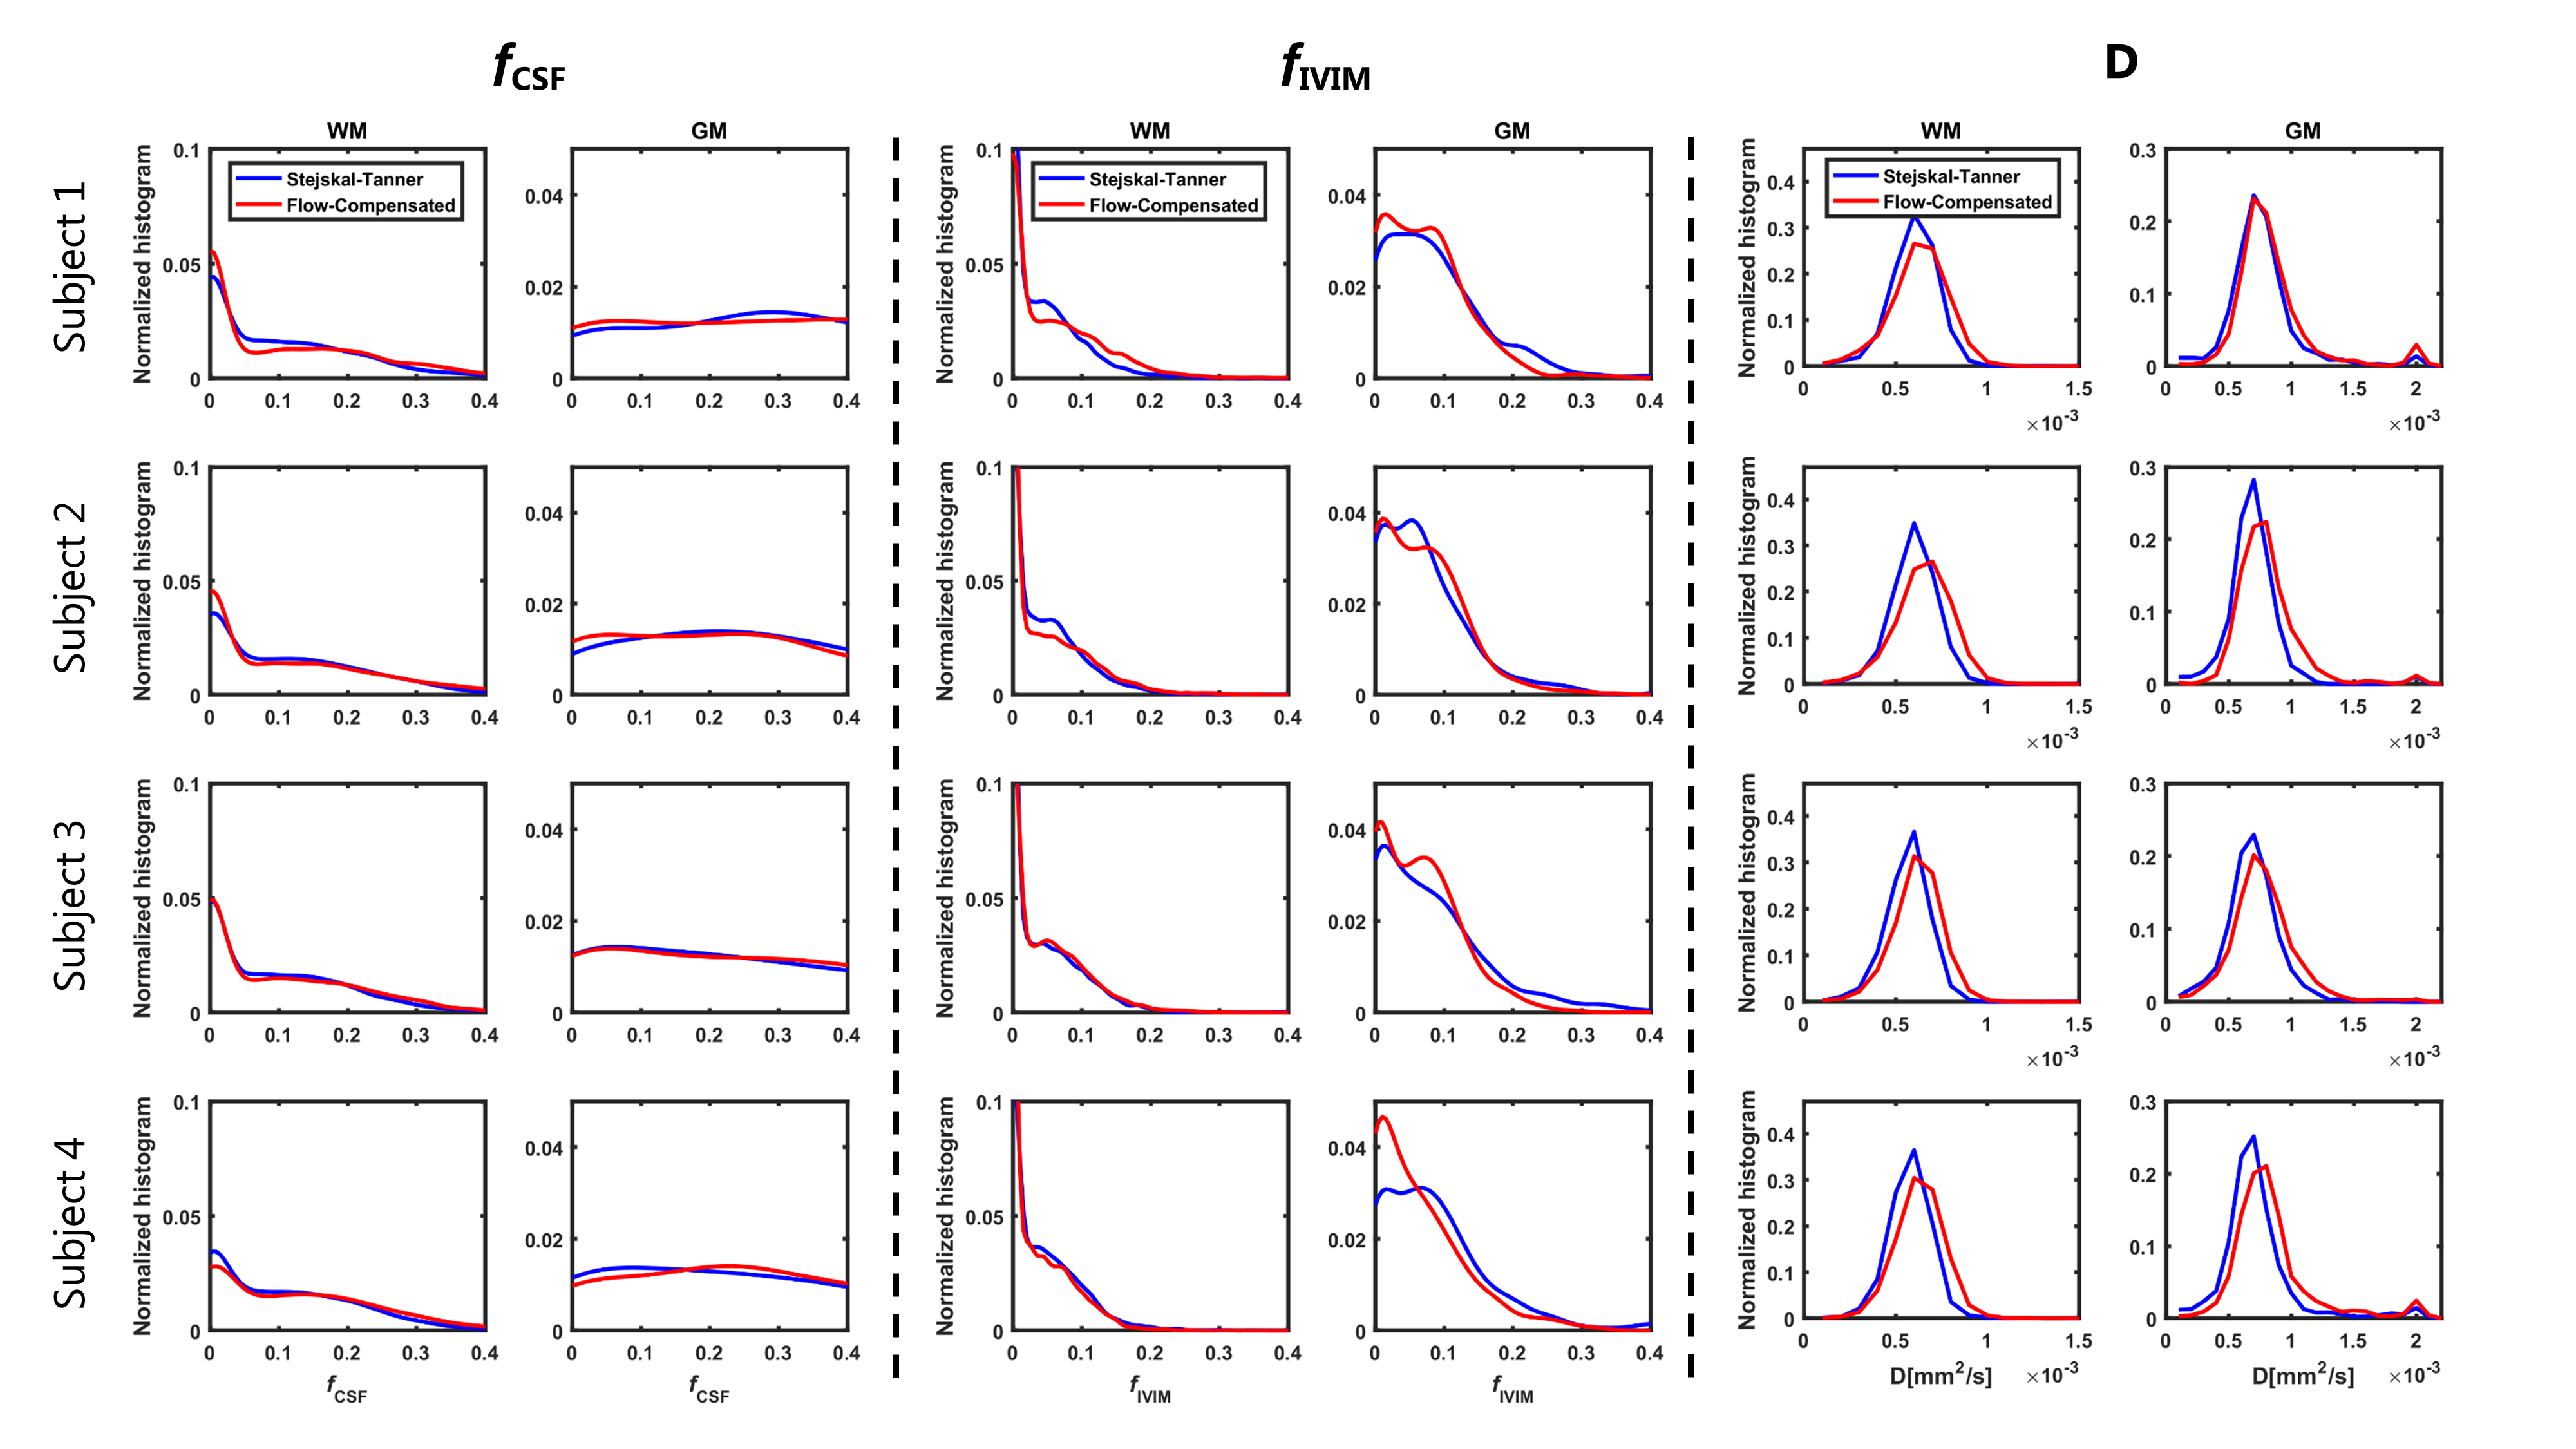
Example maps of $$$f_{CSF}, f_{IVIM}$$$ and D are reported in Figure 2. $$$f_{CSF}$$$ was similarly estimated on ST and AS, as confirmed by the histogram showed in Figure 3. Conversely, $$$f_{IVIM}$$$ values were higher on ST, in-line with the flow-compensation of AS, especially in GM (Figure 3). D estimated on AS was larger than ST, with particular reference to the WM distributions shown in Figure 3.
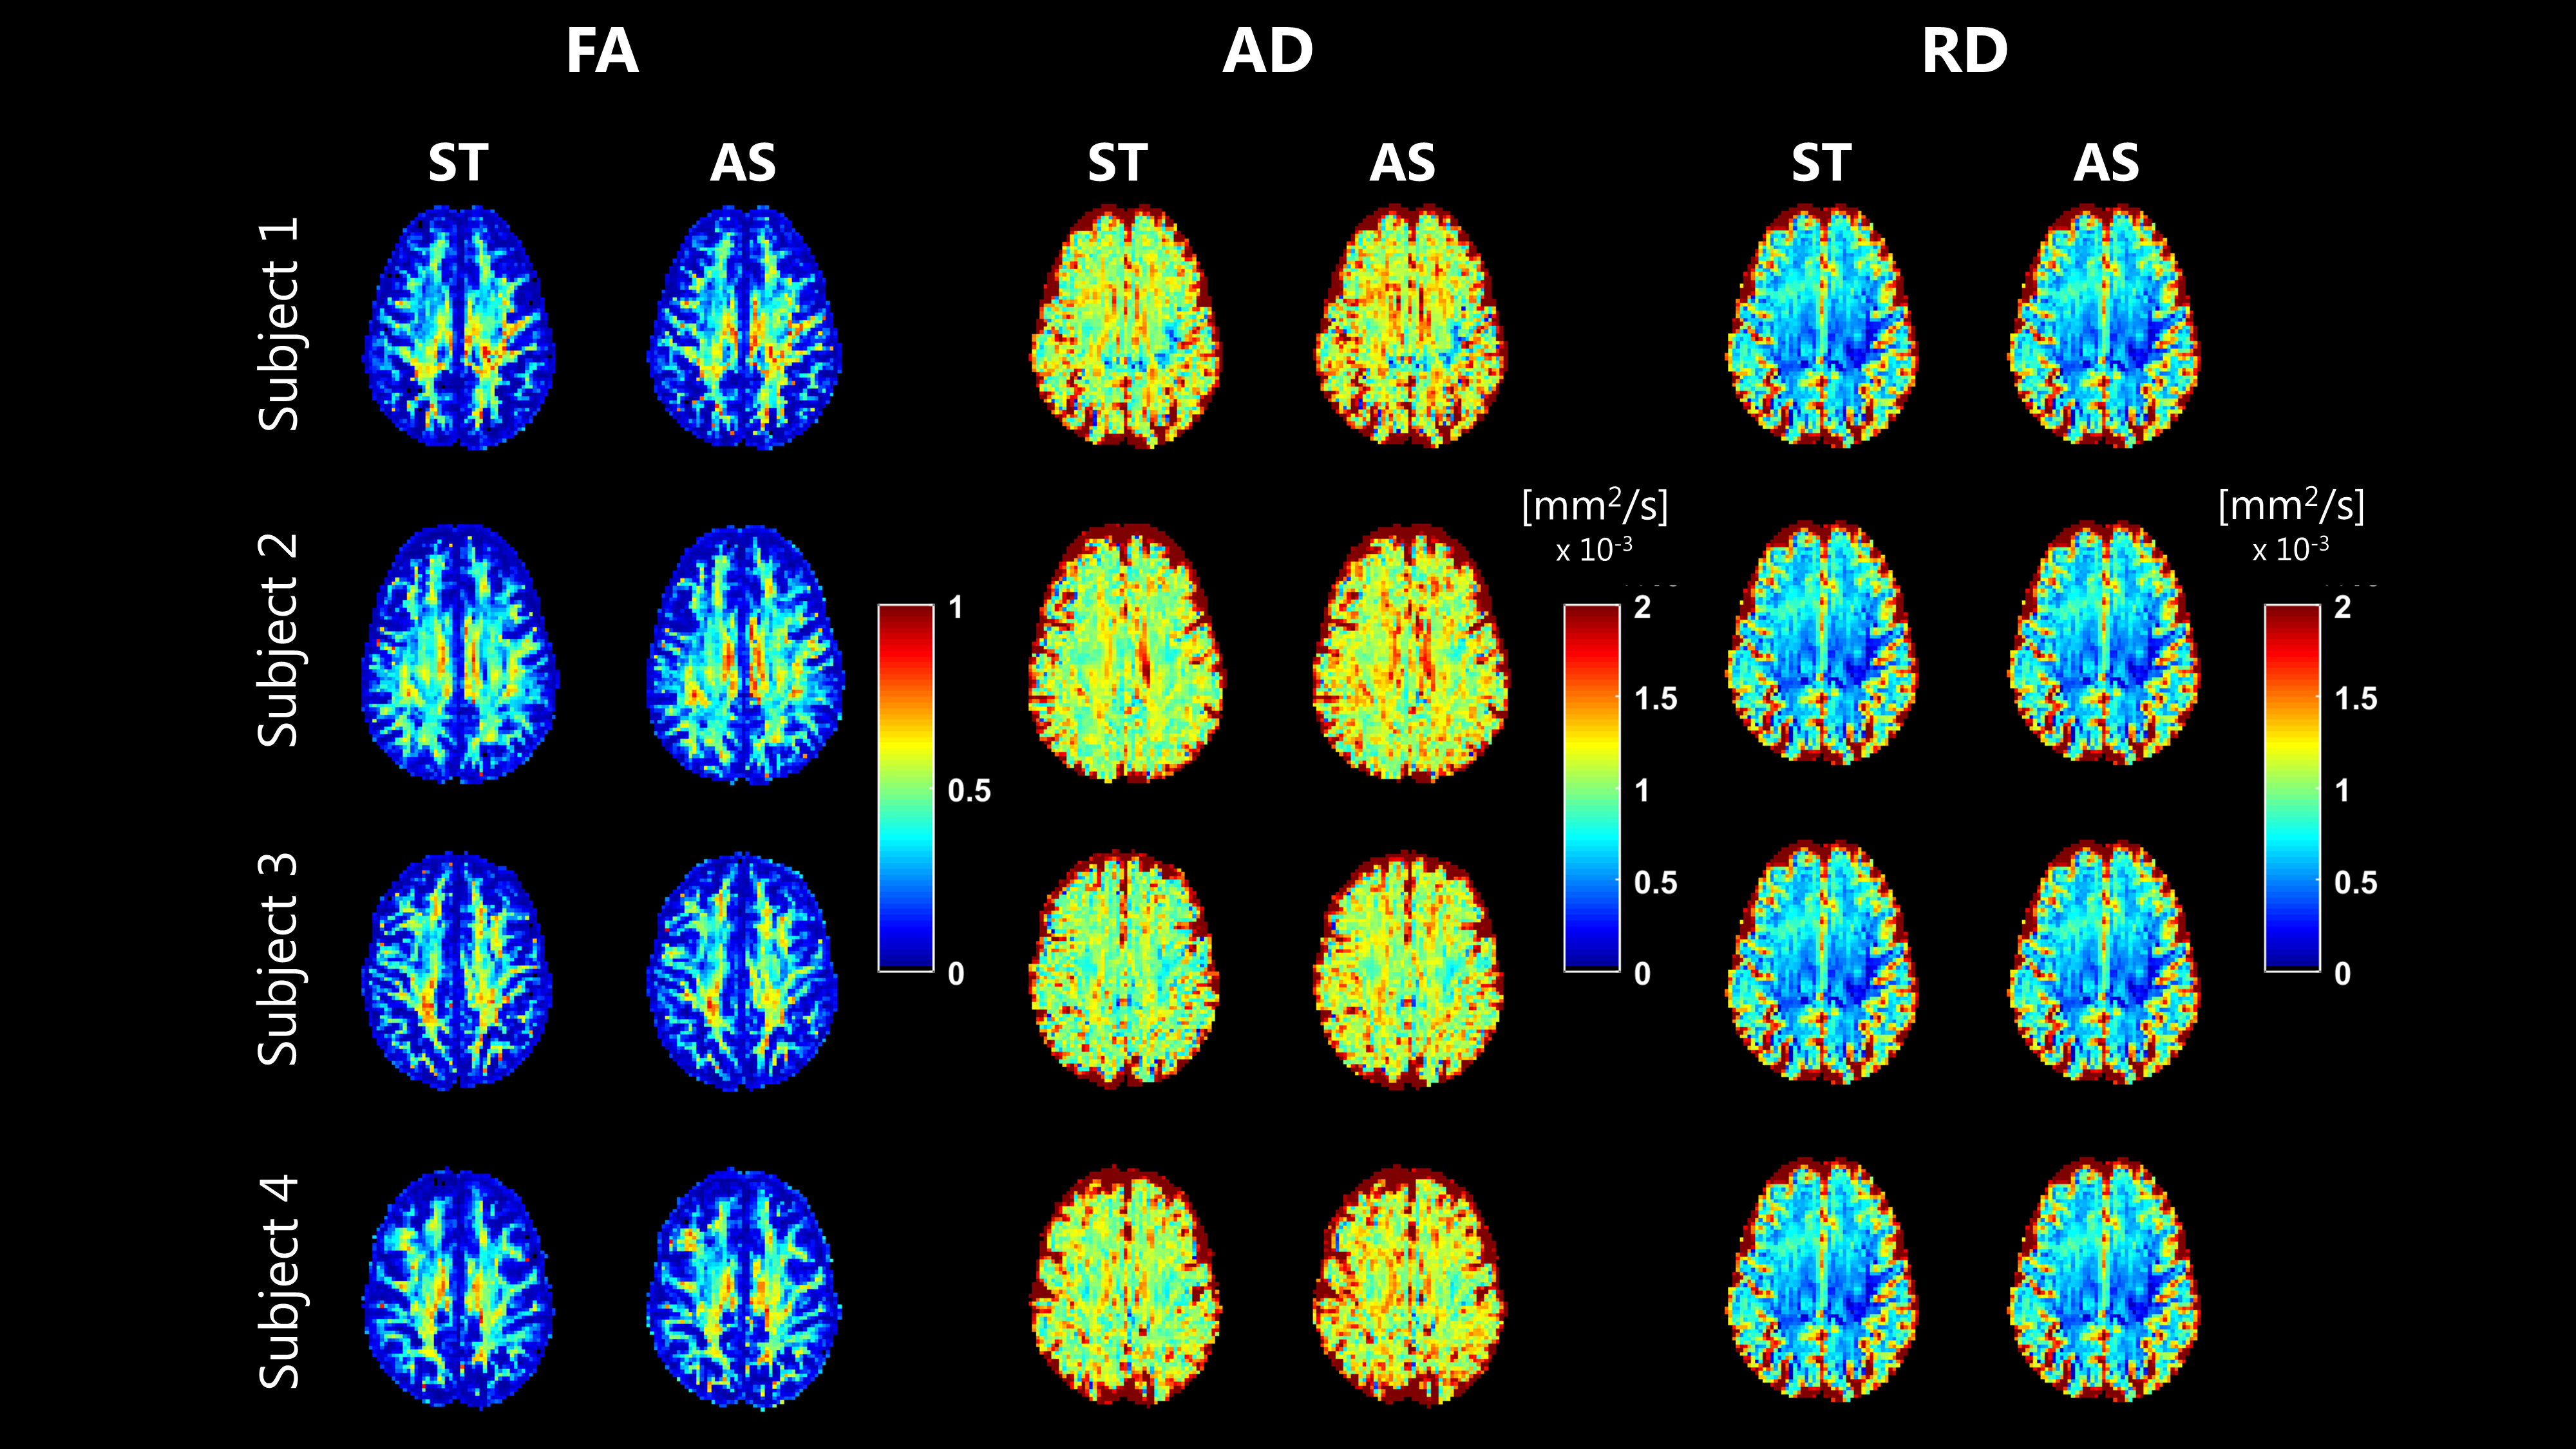
FA, AD and RD maps derived from the fit of b=0, 1000 s/mm2, which are shown in Figure 4, were highly comparable between ST and AS. FA and RD were the most consistent, while higher AD values were noticed on AS. The distribution of the same maps in GM, WM and CSF are shown in Figure 5. No observable differences where noticed for FA. Higher AD values were estimated on AS, especially in WM. In CSF, fit of AS data resulted in values much closer to that of free water at 37 degrees compared to ST.
Discussion
The dMRI signals measured with ST and AS gradients had different attenuation curves in different tissues. The largest differences were observed in CSF, due to flow-compensation of the moving CSF, and in WM, possibly due to the inherently different diffusion time. The multi-ADC fit resulted in lower $$$f_{IVIM}$$$ values for AS, but higher tissue diffusion coefficient. No noticeable differences were observed in $$$f_{CSF}$$$, which differs from a previous report(12). Results from the DTI derived metrics suggest a very high agreement of FA. However, AD and, to a lesser extent, RD of AS were consistently higher than ST, in line with the multi-ADC fit.
The results here presented should be interpreted under its limitation. The two sequences were tested on four subjects, which might suggest the need for a more extensive validation. The multi-ADC fit strategy assumed a mono-exponential diffusion regime at b<200s/mm2, which probably does not hold in practice. Finally, investigation of stronger diffusion weightings should be performed to assess whether the gradient wave-form might impact on non-Gaussian signal behaviour in WM.
Conclusions
Data acquired with Stejskal-Tanner and Asymmetric-Bipolar gradients at the same echo time yielded comparable metrics in both multi-ADC and DTI fit. However, systematic differences were observed for some parameters, especially diffusion coefficients, suggesting great care when comparing results achieved with different wave-forms.Acknowledgements
This research is supported by VIDI Grant 639.072.411 from the Netherlands Organisation for Scientific Research (NWO).References
1. Wetscherek A, Stieltjes B, Laun FB. Flow-compensated intravoxel incoherent motion diffusion imaging. Magn. Reson. Med. [Internet] 2015;74:410–9. doi: 10.1002/mrm.25410.
2. Froeling M, Strijkers GJ, Nederveen AJ, Luijten PR. Whole heart DTI using asymmetric bipolar diffusion gradients. J. Cardiovasc. Magn. Reson. [Internet] 2015;17:P15. doi: 10.1186/1532-429X-17-S1-P15.
3. Ohno N, Miyati T, Kobayashi S, Gabata T. Modified triexponential analysis of intravoxel incoherent motion for brain perfusion and diffusion. J. Magn. Reson. Imaging 2016;43:818–823. doi: 10.1002/jmri.25048.
4. Rydhög AS, Szczepankiewicz F, Wirestam R, Ahlgren A, Westin C-F, Knutsson L, Pasternak O. Separating Blood and Water: Perfusion and Free Water Elimination from Diffusion MRI in the Human Brain. Neuroimage [Internet] 2017. doi: 10.1016/j.neuroimage.2017.04.023.
5. Le Bihan D, Breton E, Lallemand D, Aubin ML, Vignaud J, Laval-Jeantet M. Separation of diffusion and perfusion in intravoxel incoherent motion MR imaging. Radiology [Internet] 1988;168:497–505. doi: 10.1148/radiology.168.2.3393671.
6. Basser PJ, Pierpaoli C. Microstructural and physiological features of tissues elucidated by quantitative-diffusion-tensor MRI. J. Magn. Reson. B 1996;111:209–219. doi: 10.1016/j.jmr.2011.09.022.
7. Smith SM. Fast robust automated brain extraction. Hum. Brain Mapp. [Internet] 2002;17:143–55. doi: 10.1002/hbm.10062.
8. Zhang Y, Brady M, Smith S. Segmentation of brain MR images through a hidden Markov random field model and the expectation-maximization algorithm. IEEE Trans. Med. Imaging [Internet] 2001;20:45–57. doi: 10.1109/42.906424.
9. Avants BB, Epstein CL, Grossman M, Gee JC. Symmetric diffeomorphic image registration with cross-correlation: Evaluating automated labeling of elderly and neurodegenerative brain. Med. Image Anal. 2008;12:26–41. doi: 10.1016/j.media.2007.06.004.
10. Leemans A, Jeurissen B, Sijbers J, Jones DK. ExploreDTI: a graphical toolbox for processing, analyzing, and visualizing diffusion MR data. In: International Society for Magnetic Resonance in Medicine. Hawaii; 2009.
11. Veraart J, Sijbers J, Sunaert S, Leemans A, Jeurissen B. Weighted linear least squares estimation of diffusion MRI parameters: Strengths, limitations, and pitfalls. Neuroimage [Internet] 2013;81:335–346. doi: 10.1016/j.neuroimage.2013.05.028.
12. Ahlgren A, Knutsson L, Wirestam R, Nilsson M, Ståhlberg F, Topgaard D, Lasič S. Quantification of microcirculatory parameters by joint analysis of flow-compensated and non-flow-compensated intravoxel incoherent motion (IVIM) data. NMR Biomed. 2016;29:640–649. doi: 10.1002/nbm.3505.
Figures