1612
Non-Gaussian diffusion restriction effects in intravoxel incoherent motion imaging acquired at b-values below 1000 $$$\tt s/mm^{2}$$$1Tohoku University School of Medicine, Sendai, Japan, 2Tohoku University Hospital, Sendai, Japan
Synopsis
To know how much the intravoxel incoherent motion (IVIM) parameters deduced by a bi-exponential model are affected by neglecting non-Gaussian diffusion restriction effects, we performed Monte-Carlo simulations: fitting the bi-exponential model to simulated data containing the diffusion restriction effects. The results showed that non-Gaussian diffusion restriction effects may considerably affect estimation of IVIM parameters even when data acquired with low b-values (b≤1000 s/mm2) are used. This should be taken into account when interpreting the results of IVIM analyses based on the bi-exponential model.
INTRODUCTION
Non-Gaussian diffusion restriction effects are not clearly visible when low b-values (b≤1000 s/mm2) are used in clinical MRI. Therefore, the restriction effects are usually neglected for intravoxel incoherent motion (IVIM) imaging with b-values less than 1000 s/mm2 and a simple bi-exponential signal decay model is used1:$$ S(b)=S(0)\left\{fe^{-bD^{*}}+(1-f)e^{-bD}\right\}, \quad (Equation\quad 1)$$ where S denotes the signal intensity; b, the b-value; f, the flowing blood (perfusion) fraction; D*, the pseudo-diffusion coefficient of vascular compartment; D, the apparent diffusion coefficient of non-vascular compartment. However, the accuracy of parameters (f, D, D*) estimated by fitting the bi-exponential model to IVIM data that contain non-Gaussian diffusion restriction effects has not been investigated systematically. The purpose of this study is to know how much the estimated parameters are affected by the non-Gaussian diffusion restriction effects.
METHODS
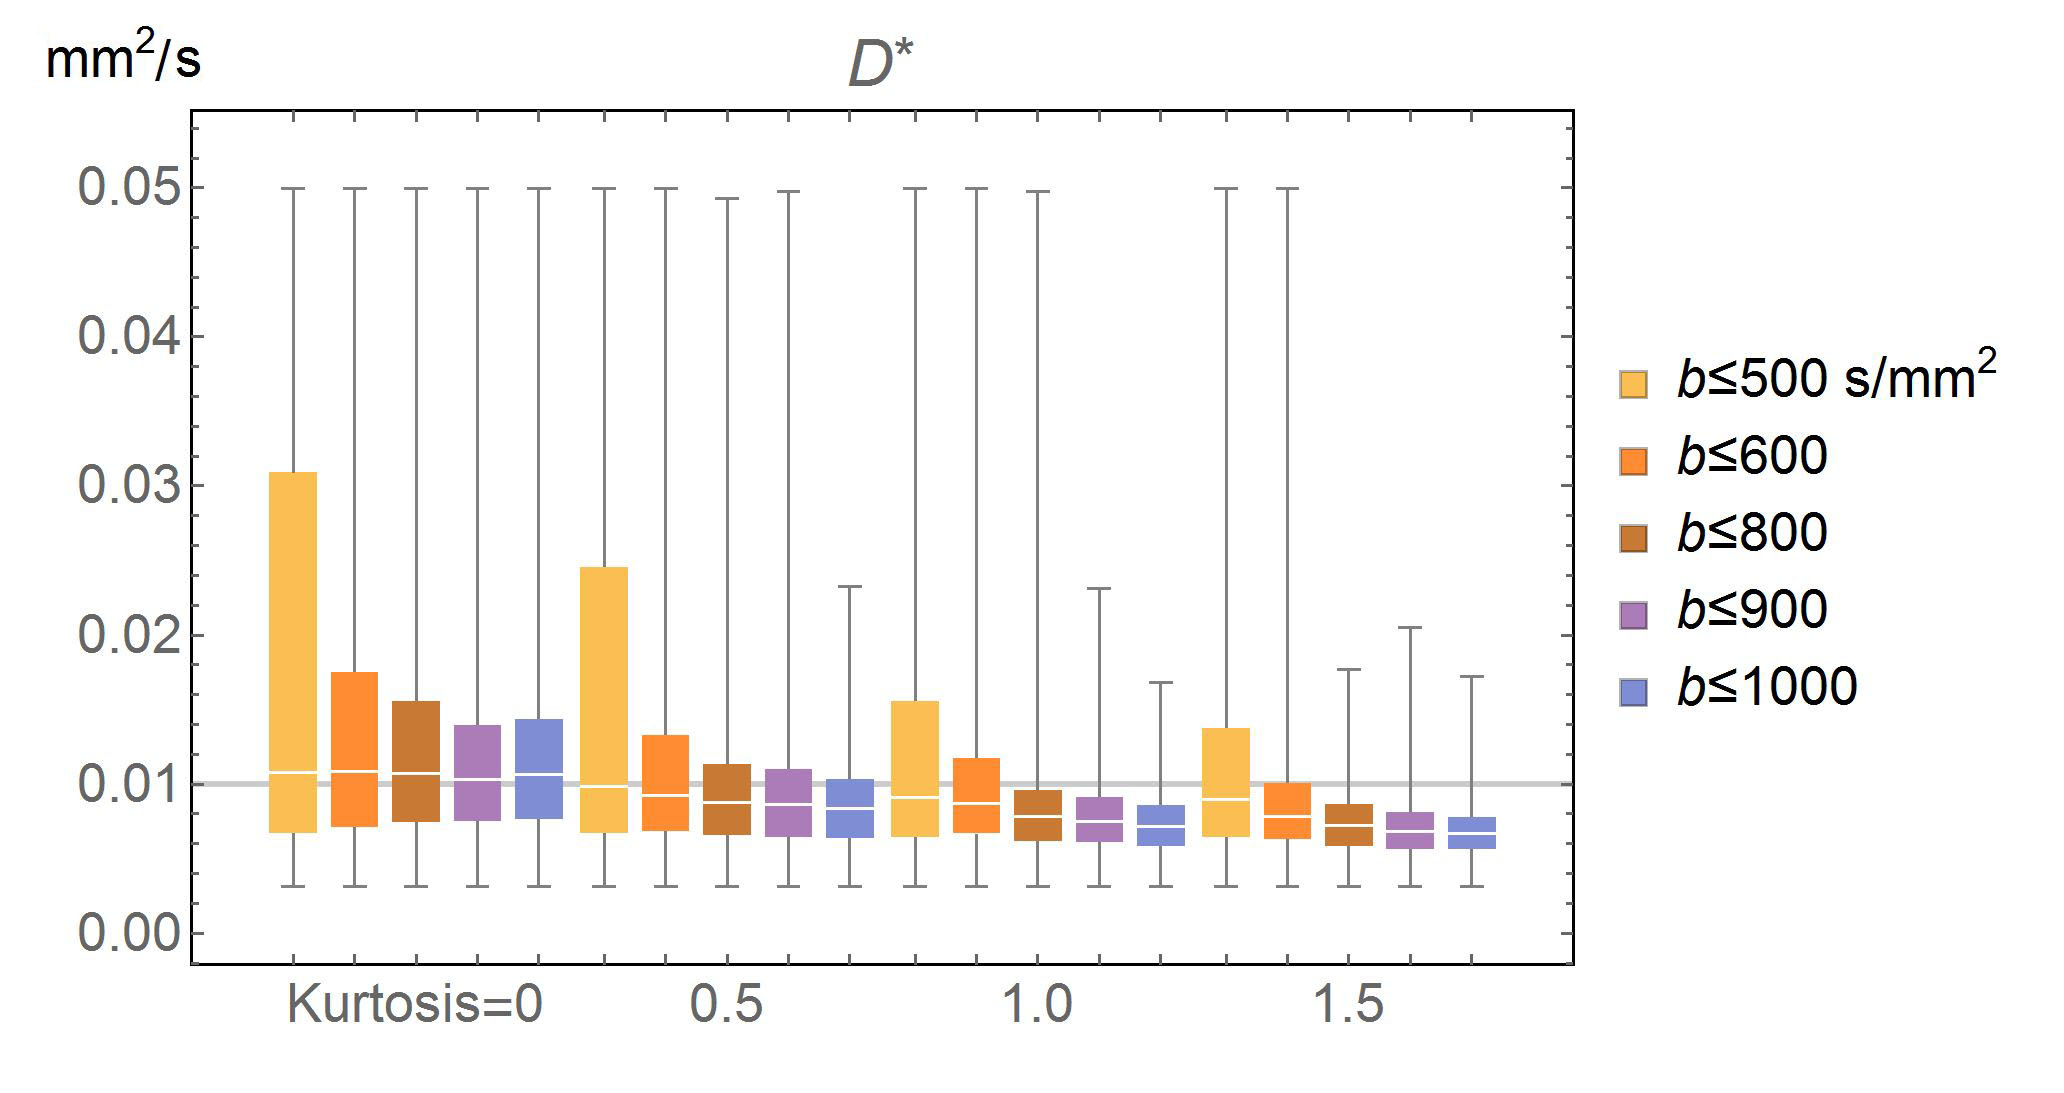
We numerically simulated IVIM data containing non-Gaussian diffusion restriction effects. We adopted the diffusion kurtosis as an indicator of the restriction effects. Theoretical IVIM signals were generated using the diffusion kurtosis model2:$$ S(b)=S(0)\left\{fe^{-bD^{*}}+(1-f)e^{(-bD+Kb^{2}D^{2}/6)}\right\}, \quad (Equation\quad 2)$$ where K denotes the diffusion kurtosis. The signal intensities were calculated for 10 b-values (b≤500-1000 s/mm2, Table 1) with ranges of parameters: K = 0-1.5, f = 0.03-0.1, D* = 6-20 µm2/ms, and D = 0.8-1.5 µm2/ms. S(b)'s were calculated 1024 times for each set of parameters with adding Rician noise randomly so that the signal-to-noise ratio was 100 for the signal at b = 0.
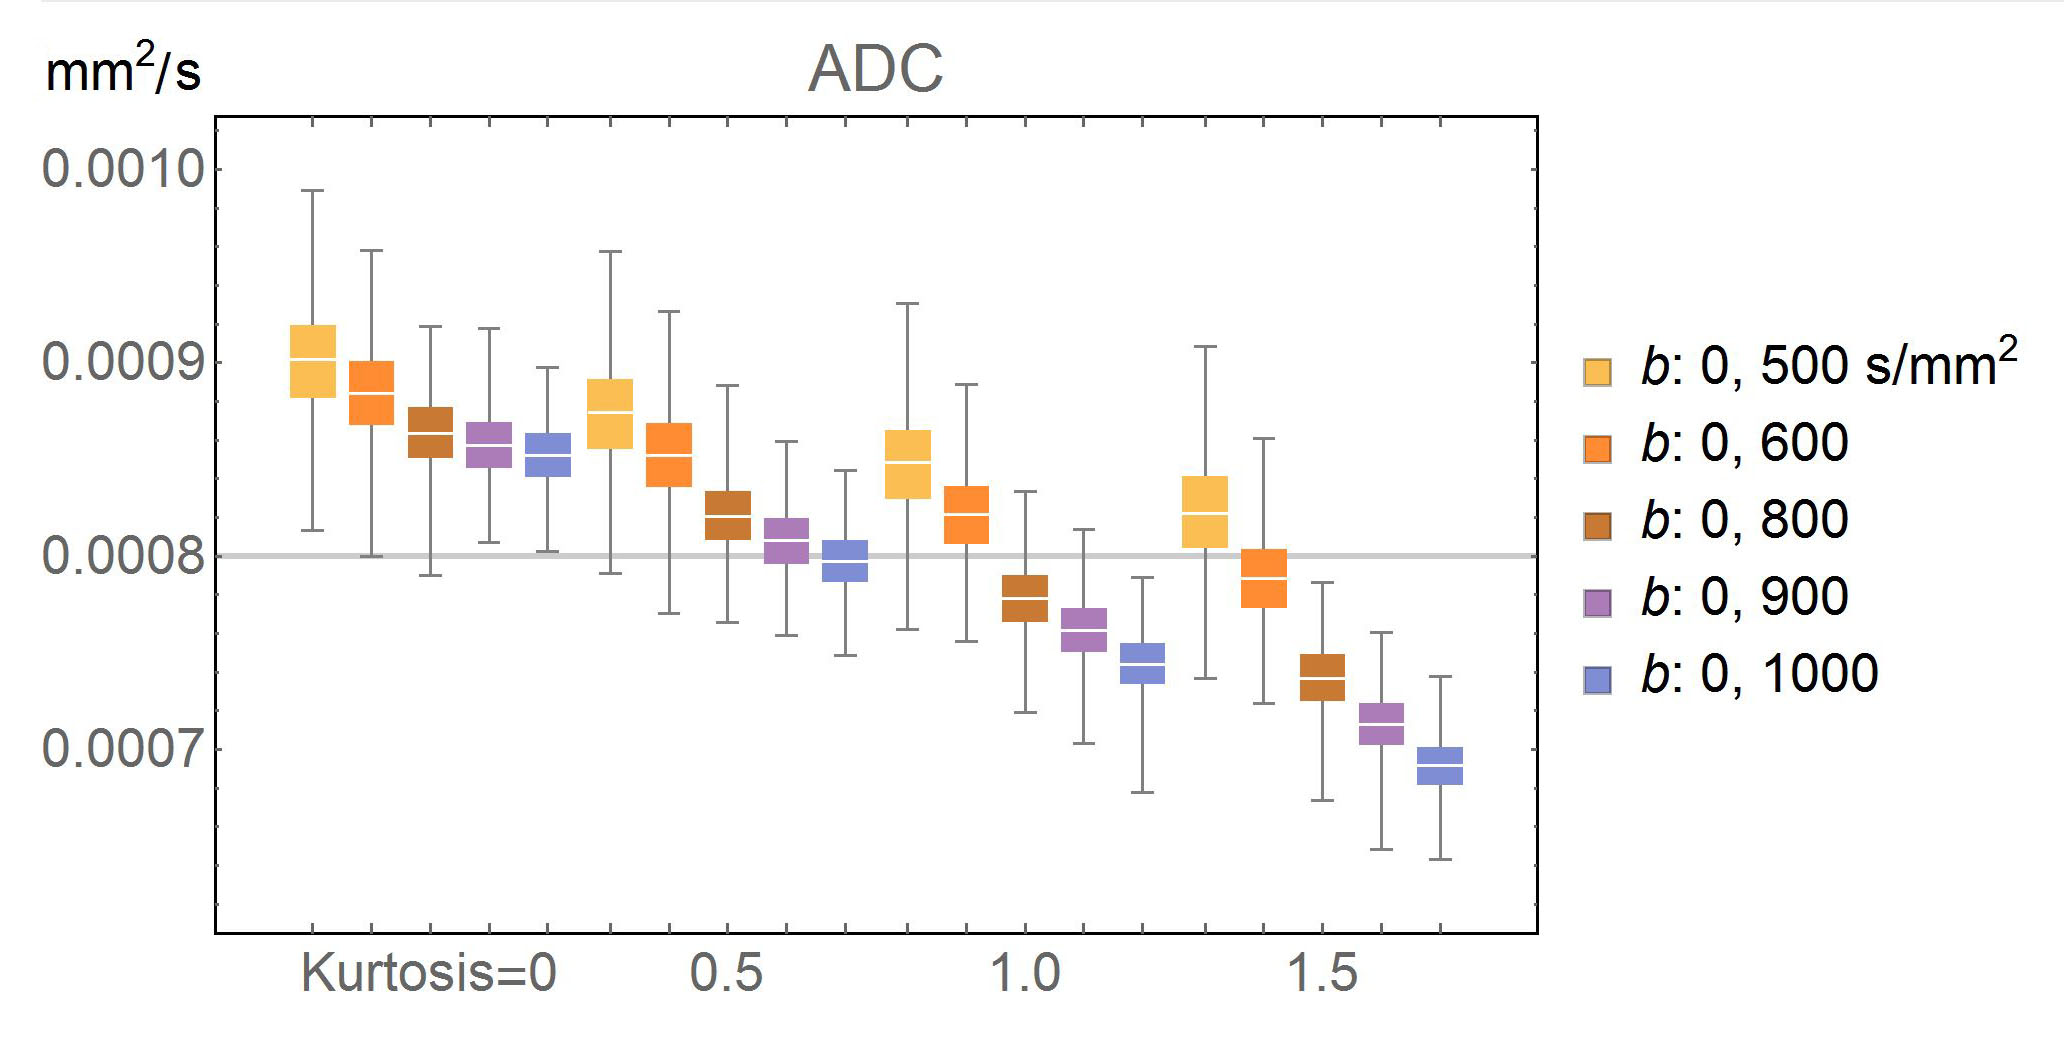
D was estimated by non-linear least squares using the simulated data of b≥400 s/mm2 where the first term in Equation 1 is assumed to be negligibly small. Then f and D* were calculated using the data of b≤80 s/mm2 and the estimated D above. f and D* were constrained as 0 < f < 0.5, and 3<D*<50 µm2/ms. We also calculated the apparent diffusion coefficient for a single-exponential decay model (ADC) as$$ADC = \log\left[S(0)/S(b_{max})\right]/b, \quad (Equation\quad 3)$$ where bmax is the maximum b in the set of 10 b-values.
The estimated parameters were compared with ground-truth values using box and whisker plots.
RESULTS
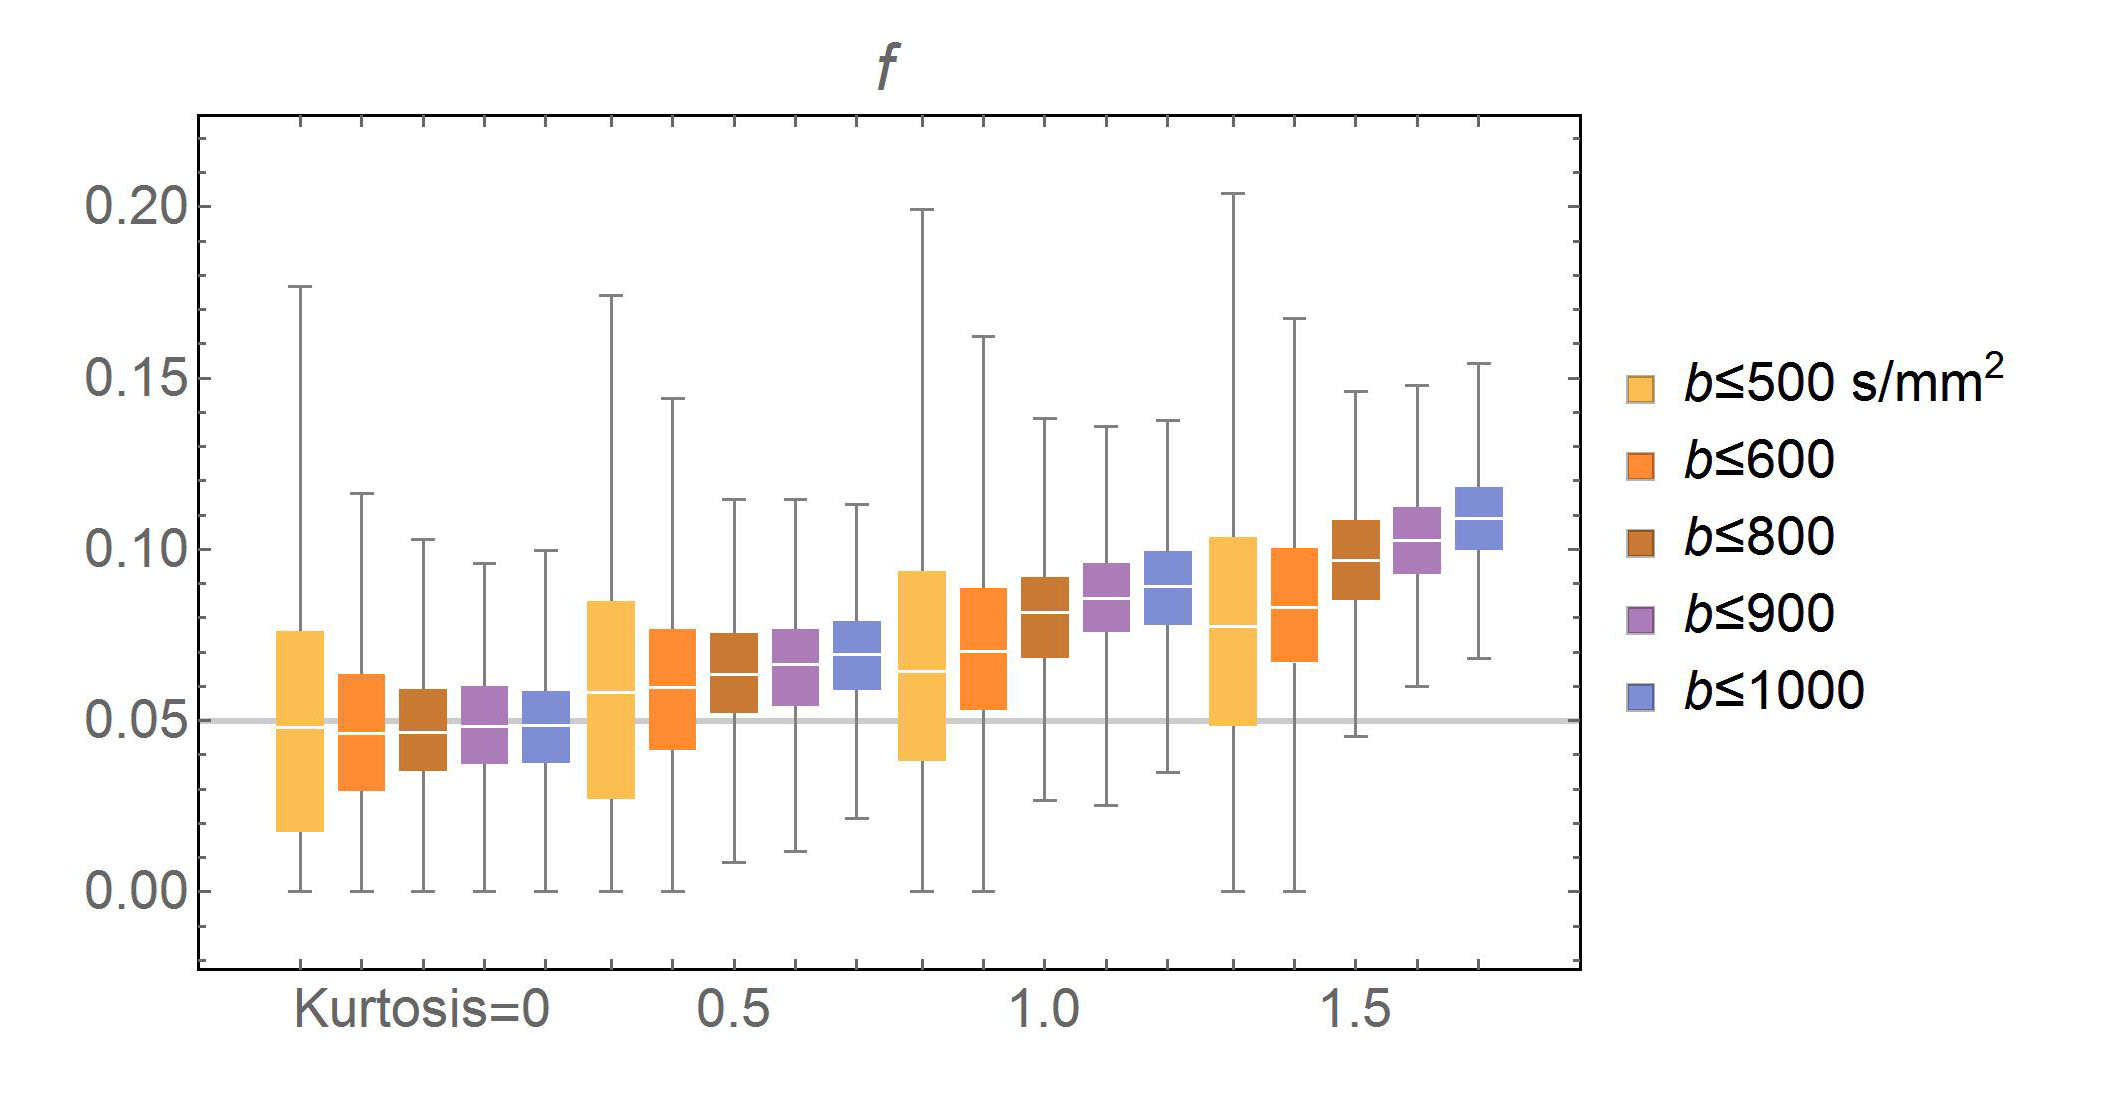
The estimated D decreased successively with both K and bmax. The estimated values were 0.66-0.82 of the ground truth at K = 1.0 and bmax = 1000 s/mm2 and 0.49-0.75 of the ground truth at K = 1.5 and bmax = 1000 s/mm2. Though the estimated D* showed the same tendency as D, the precision was poor. The estimated f increased successively with both K and bmax. The estimated values of f were 1.8-2.2 of the ground truth at K = 1.0 and bmax = 1000 s/mm2 and 2.1-4.9 of the ground truth at K = 1.5 and bmax = 1000 s/mm2. The estimated ADC showed both the perfusion (the first term of the bi-exponential model: Equation 1 or 2) and the restriction effects. Figure 1-3 show box and whisker plots of the estimated D, D* and f for D = 0.8 µm2/ms, D* = 10 µm2/ms, and f = 0.05. Figure 4 shows the box and whisker plot of estimated ADC for the same D, D* and f as above.DISCUSSION
The IVIM parameters estimated by fitting the bi-exponential model to the data generated with relatively low b-values (b≤1000 s/mm2) were shown to be considerably affected by non-Gaussian diffusion restriction effects (K =0.5-1.5) that have been reported on human tissue.3,4 Although decreasing bmax would alleviate the effects, precision of the estimated parameters are degraded for the smaller bmax. Because the K’s have been known to be greater for malignant tumors than for benign tumors,5,6 the D’s estimated with the bi-exponential model may be smaller for malignant tumors than for benign tumors even when the actual D’s are the same. Similarly, the f’s estimated based on the bi-exponential model may be larger for malignant tumors than for benign tumors even when the actual f’s are the same.CONCLUSION
Non-Gaussian diffusion restriction effects may considerably affect estimation of IVIM parameters even when low b-values (b≤1000 s/mm2) are used. D may be underestimated and f may be overestimated when using the bi-exponential model. This should be taken into account when interpreting the results of IVIM analyses based on the bi-exponential model.Acknowledgements
This work was supported by JSPS KAKENHI Grant Number 15K09914.References
1. Federau C. Intravoxel incoherent motion MRI as a means to measure in vivo perfusion: A review of the evidence. NMR in Biomed. 2017;e3780.
2. Iima M and Le Bihan D. Clinical Intravoxel Incoherent Motion and Diffusion MR Imaging: Past, Present, and Future. Radiology 2016;278(1):13-32.
3. Lätt J, Nilsson M, Wirestam R, et al. Regional values of diffusional kurtosis estimates in the healthy brain. J. Magn. Reson. Imaging 2013;37(3):610–618.
4. Wurnig M, Kenkel D, Filli L, et al. A Standardized parameter-free algorithm for combined intravoxel incoherent motion and diffusion kurtosis analysis of diffusion imaging data. Invest Radiol. 2016;51(3):203-210.
5. Cauter S, Veraart J, Sijbers J, et al. Gliomas: Diffusion kurtosis MR imaging in grading. Radiology 2012;263(2):492-501.
6. Iima M, Kataoka M, Kanao S, et al. Intravoxel incoherent motion and quantitative non-Gaussian diffusion MR imaging: evaluation of the diagnostic and prognostic value of several markers of malignant and benign breast lesions.Radiology 2017:162853. https://doi.org/10.1148/radiol.2017162853.
Figures