1610
Multi-platform reproducibility of advanced diffusion weighted MRI parameters in phantoms and healthy volunteers1Brain Sciences, Imperial College London, London, United Kingdom, 2Surgery and Cancer, Imperial College London, London, United Kingdom, 3CRUK and EPSRC Cancer Imaging Centre, Institute of Cancer Research, London, United Kingdom, 4Department of Imaging, Imperial Healthcare NHS Trust, London, United Kingdom, 5Centre for Clinical Brain Sciences, University of Edinburgh, Edinburgh, United Kingdom
Synopsis
Quantitative diffusion imaging has an evolving role in tumour characterisation and disease monitoring. Most clinical DWI sequences use ADC derived from two b-values. Multiple b-value acquisition allows further biologically-relevant diffusion components to be interrogated using bi-, multi- and stretched exponential models; these require validation for application in multicentre trials. This study compared the reproducibility of ADC, IVIM and stretched exponential parameters across MRI platforms in two phantoms and healthy volunteers. Our initial results suggest highly reproducibility of all measured parameters in phantoms, and of ADC and IVIM in healthy brains. Stretched exponential data appear less reproducible in vivo.
Introduction
DWI is increasingly used as an oncology biomarker for
tumour characterisation and therapeutic assessment [1]. Monoexponential ADC measures from two b-values (typically
0s/mm2 and 1000s/mm2) are robust and reproducible across multiple centres [2]. Diffusion signal in vivo is however multi-exponential,
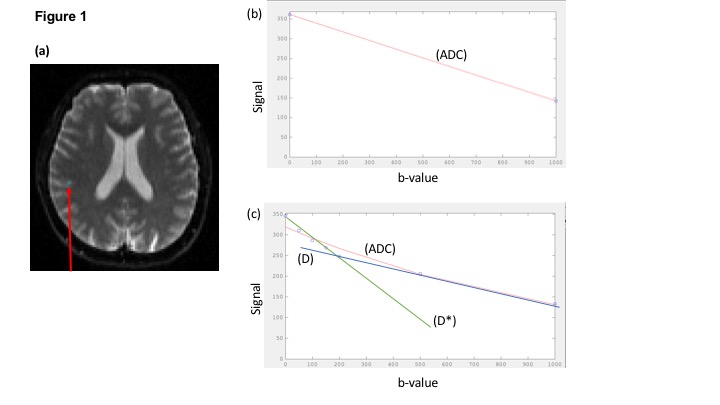
and reflects multiple diffusion processes within a single voxel, revealed by multiple
b-value acquisition (Fig 1) [3]. Low b-value components are dominated by perfusion
effects, whereas increasing b-values may reflect various interstitial and intracellular
diffusion processes[4]. The intravoxel incoherent (IVIM) model separates perfusion
and diffusion components using a bi-exponential fit [5]. The stretched exponential model provides an alternative
to multi-exponential fitting to noise-limited datasets, and considers signal as
a continuous distribution of components with different diffusion coefficients. The reproducibility of data from such advanced
diffusion models across harmonised sequences has not yet been established in a multi-institutional
setting.
Purpose
The purpose of this work was to compare reproducibility of DWI parameters from monoexponential, IVIM, and stretched models in ice water and biomimetic phantoms and the brains of healthy adult volunteers across multiple scanners.Methods
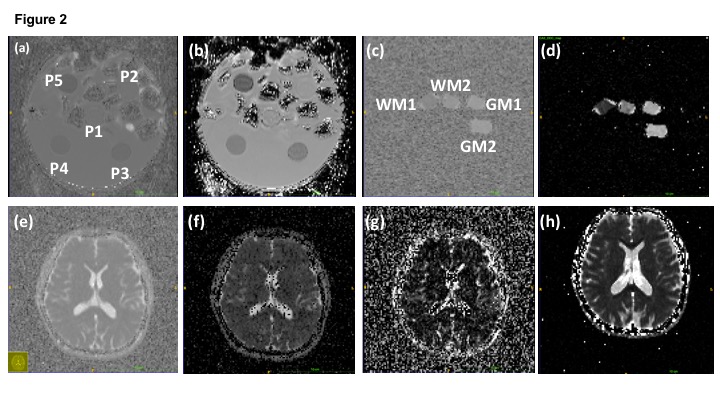
An ice water phantom comprising 5 tubes containing 0%, 0%, 10%, 10% and 20% sucrose solution at thermal equilibrium (Fig 2a-b) and custom biomimetic phantom comprising 4 tubes polycaprolactone (PCL) hollow microfibers, to simulate normal grey and white brain matter (fig 2c-d), were imaged twice on three MRI system. 3 healthy volunteers were imaged twice on two MRI system (Fig 2e-h).
Both phantoms were imaged on 3 MRI systems; Avanto (1.5T), Verio (3T) (Siemens, Erlangen, De) and Discovery 750 (3T) (GE Healthcare, Milwaukee, USA). Healthy volunteers were imaged on Avanto and Verio platforms. The protocol included ‘low b-value’ (b= 0s/mm2, 50s/mm2, 150s/mm2, 200s/mm2, 500s/mm2, 1000s/mm2, TR 6100ms, TE 85ms) from which ADC and IVIM parameters D*, D and f were calculated and ‘high b-value’ acquisitions (b=0 s/mm2, 500 s/mm2, 1000s/mm2, 1500s/mm2, 2000s/mm2, 2500 s/mm2, 3000s/mm2, 3500s/mm2, 4000s/mm2, TR 7800ms, TE 121ms) from which the stretched parameters, DDC and α were derived.
Mean DWI parameters were calculated from manually defined regions of interest (ROI) using ITK-snap software over the tubes to include only fluid in the ice water phantoms and PCL within the biomimetic phantoms. In healthy volunteers, whole grey matter and white masks were created from high resolution T1 sequences (in FSL). Mean values for DWI parameters in these regions were calculated by registering the b0 image to the high-resolution T1-weighted image, and subsequently applying the same transformation to ADC, D, D*, f and α.
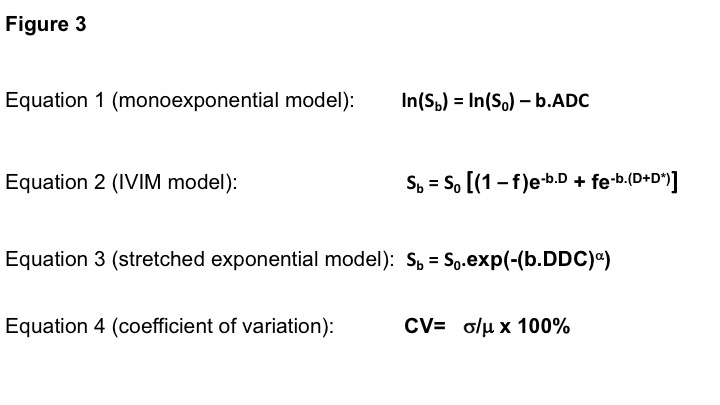
ADC was calculated from Equation 1 (Fig 3), using custom MATLAB scripts to determine the gradient ln(Sb/S0), using a linear fit through b= 0s/mm2, 500s/mm2 and 1000s/mm2. IVIM parameters and stretched-exponential parameters were estimated by fitting equations 2 and 3 (Fig 3) to the multiple b-value data using non-linear least-squares with simplex minimisation.
Coefficient of variation (CV) was calculated as defined by equation 4 (Fig 3), using the group and standard deviation of each individual DWI parameter in each phantom and volunteer.
Results
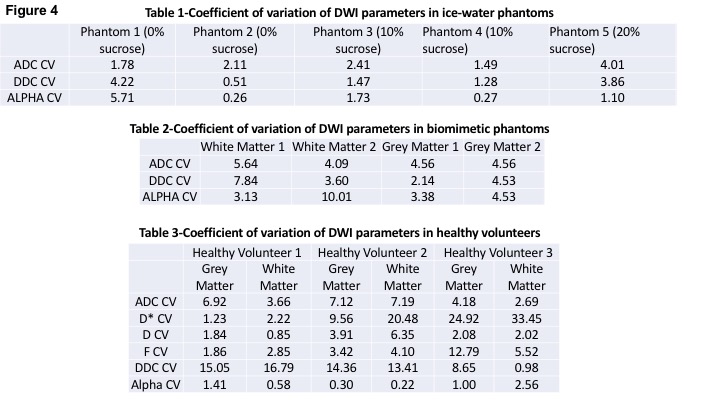
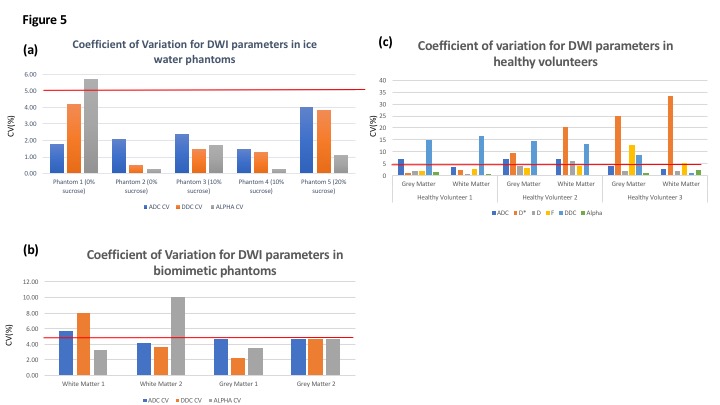
In ice water phantoms, ADC values were highly reproducible with CV ranging from 1.40% to 4.01% across the 5 phantoms with differing concentrations of sucrose. The DDC was equally reproducible with the CV ranging from 0.51% to 4.22% (fig 4-table 1). The group mean α values were close to 1, ranging from 0.86 in Phantom 1(0% sucrose) to 0.99 in phantom 2 (0% sucrose). In biomimetic data (fig 4-table 2), the ADC was again reproducible with the CV’s <5.64% across all phantoms. The highest DDC CV was in WM1 (7.84%) but the remaining phantoms had CV <5%. In vivo (fig 4-Table 3) the CV of the DDC in grey and white matter ranged from 13.41%-16.79% in volunteers 1 and 2.Discussion
DDC measures in phantoms show good reproducibility similar to ADC, and accord with previous studies of ADC variability across centres and acquisition platforms; as might be expected given the predicted monoexponential relationship in free water. Slightly higher CV in vivo, where biological heterogeneity in tissue and segmentation errors will also contribute to variability, also accords with published ADC data. The generally poorer reproducibility of DDC compared with monoexponential and IVIM parameters may reflect influence of more complex diffusion components sampled over a wider range of b-values and lower signal to noise ratio in the longer TE ‘high b-value protocol’.Conclusion
Ice water and biomimetic phantoms provide useful assessment of cross-platform variability, however further study of spatially-heterogeneous systems with multiple intravoxel diffusion components are important for realistic evaluation of in vivo reproducibility of parameters from complex diffusion models.Acknowledgements
This work was funded by the Brain Tumour Charity, the Brain Tumour Research Campaign and an educational grant from Bayer Schering (DAIG08003).
References
[1] C. Reischauer, R. Patzwahl, D.-M. Koh, J. M. Froehlich, and A. Gutzeit, “Non-Mono-Exponential Analysis of Diffusion-Weighted Imaging for Treatment Monitoring in Prostate Cancer Bone Metastases.,” Sci. Rep., vol. 7, no. 1, p. 5809, Jul. 2017.
[2] M. Grech-Sollars et al., “Multi-centre reproducibility of diffusion MRI parameters for clinical sequences in the brain,” NMR Biomed., vol. 28, no. 4, pp. 468–485, 2015.
[3] T. C. Kwee et al., “Comparison of apparent diffusion coefficients (ADC) and distributed diffusion coefficients (DDC) in high-grade gliomas,” J. Magn. Reson. Imaging, vol. 31, no. 3, pp. 531–537, Mar. 2010. [4] C. A. Clark and D. Le Bihan, “Water diffusion compartmentation and anisotropy at high b values in the human brain.,” Magn. Reson. Med., vol. 44, no. 6, pp. 852–859, Dec. 2000.
[5] D.-M. Koh, D. J. Collins, and M. R. Orton, “Intravoxel Incoherent Motion in Body Diffusion-Weighted MRI: Reality and Challenges,” Am. J. Roentgenol., vol. 196, no. 6, pp. 1351–1361, Jun. 2011.
Figures