1607
Return-to-the-origin probability calculation in single shell acquisitions1Universidad de Valladolid, Valladolid, Spain, 2AGH University of Science and Technology, Kraków, Poland
Synopsis
One of the problems of estimating q-space scalar measures is the need of a high number of samples in the q-space in order to properly reconstruct the diffusion signal without aliasing. In this work we propose an alternative method to estimate the return-to-origin probability (RTOP) from a single shell acquisition using a prior assumption over the diffusion signal. The method provides significant structural information even for single shell acquisitions with moderate b-values.
Diffusion signal and q-space measures
In Diffusion Imaging, the probability density function of the displacement of water molecules in a given direction is related to the signal at each image location E(q):
$$P({\bf R}|\Delta) = \int_{V} E({\bf q})\exp\left(-2\pi j {\bf q}^T {\bf R}\right)d{\bf q}.$$
The inference of the exact information would require the sampling of the whole q-space to use the Fourier relationship, which is a common practice in DSI. However, in order to obtain a closed form solution from a reduced number of DWIs, simplifications are usually adopted, as the tensor model $$${\cal{D}}$$$ (Gaussian diffusion):
$$P({\bf R}|\Delta)=\frac{1}{\sqrt{|{\cal{D}}|(4\pi\Delta)^3}}\exp\left(\frac{-{\bf R}^T{\cal{D}}^{-1}{\bf R}}{4\Delta}\right).$$
Different scalar measures can be derived from the DWIs and q-space information, being the FA and MD the most popular ones in clinical research. Measures directly derived from the q-space [Wu08] can add relevant structural information and meaningful descriptive maps of the white matter. Among these measures we can highlight the probability of zero displacement (or return-to-origin probability, RTOP), the mean-squared displacement (MSD), Q-space-inverse-variance (QIV) and the return-to-plane and return-to-axis probabilities (RTPP, RTAP) [Hosseinbor12,Wu08,Ning15]. One of the challenges in estimating these measures is the high number of q-space samples needed to accurately reconstruct the diffusion signal without aliasing. In this work we propose a method to efficiently estimate the RTOP from a single shell acquisition using a prior assumption over the diffusion signal.
RTOP estimation
The probability of zero displacement, related to the probability of water molecules that minimally diffuse within the diffusion time $$$\Delta$$$, is a measure known to provide relevant information of the white matter structure [Assaf00,Hosseinbor12,Wu08]. It is related to the value of $$$P({\bf R}|\Delta)$$$ in the origin: $$$P({\bf 0})=\int_{V} E({\bf q}) d{\bf q}.$$$ Assuming a Gaussian diffusion model:
$$P({\bf 0})=\frac{1}{\sqrt{|{\cal{D}}|(4\pi\Delta)^3}}.\ \ (1)$$
Alternatively, to avoid the use of the diffusion tensor, we can consider a generic diffusion $$$D({\bf q})$$$:
$$P({\bf 0}) = \int_0^{2\pi} d\theta \int_0^{\pi} d\phi \int_0^{\infty} dq_0 \exp\left(-4\pi^2\tau\cdot q_0^2\cdot D(\theta,\phi)\right) q_0^2 \sin\theta$$
with $$$q_0=\|{\bf q}\|$$$. If we assume that the diffusion $$$D({\bf q})=D(\theta,\phi)$$$ does not depend on the radial direction, we can use a Spherical Harmonics (SH) decomposition to obtain:
$$P({\bf 0}) = \frac{\sqrt{\pi}}{4(4\pi^2\tau)^{3/2}} \int_S\left(D(\theta,\phi)\right)^{-3/2} dS=\frac{1}{(4\pi)^2\tau^{3/2}} Y_0\left((D(\theta,\phi))^{-3/2}\right)\ \ (2)$$
where $$$Y_0\left((D(\theta,\phi))^{-3/2}\right)$$$ is the zero-order coefficient of a SH decomposition of the signal $$$(D(\theta,\phi))^{-3/2}$$$.
Results and discussion
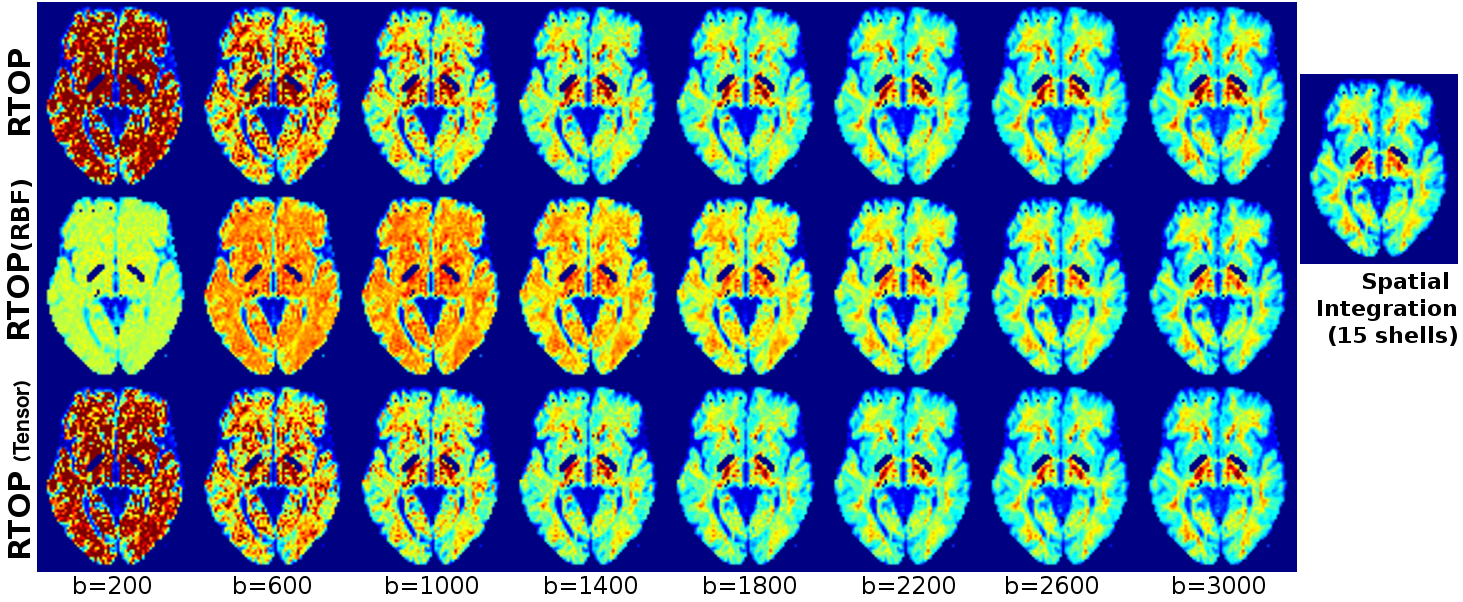
Results for two different datasets are shown in Fig. 1 and 2. Data in Fig. 1 corresponds to a public dataset for Kurtosis Imaging [Hansen16] with 33 gradient directions and 15 shells (from b=200 to b=3000). The RTOP is calculated for every single shell using: (1) the proposed method in eq. (2) (top row), (2) numerical spatial integration via a radial basis function (RBF) decomposition (middle row) and (3) the tensor approach in eq. (1) (bottom row). In addition, to be used as a reference, the RTOP is also estimated from all the shells using spatial integration. Note that, in this case, our proposal and the tensor approach show very similar results, much better than using a simple integration via RBF. This is motivated by the inclusion of a prior model in the equation. For moderate b values (b=1400) we have results very similar to those obtained using the whole q-space. In addition, results from 1400 to 3000 are very similar so, in this case, proper estimation can be obtained with smaller b values.
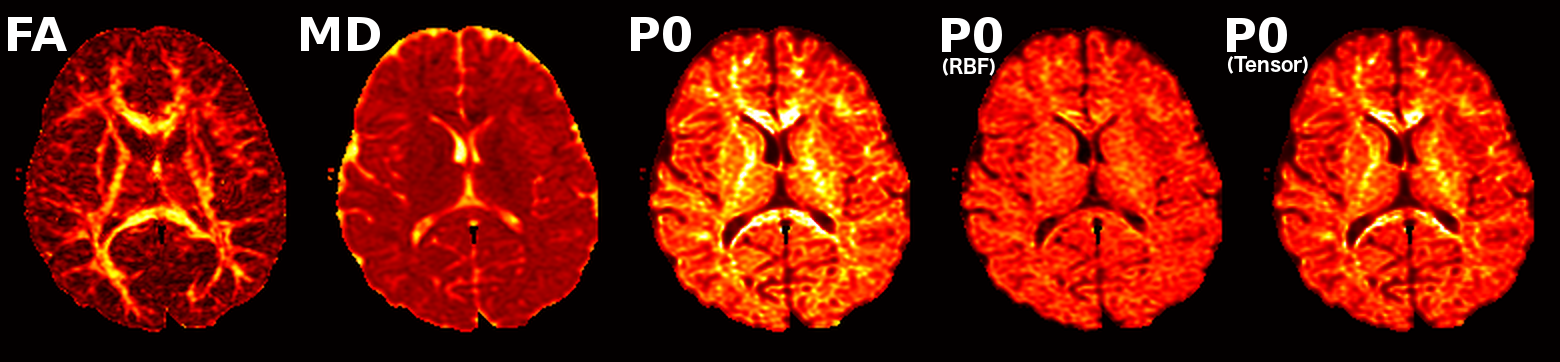
In Fig. 2 results from a 1.5T acquisition are shown. We compare with FA and MD to point out that the RTOP shows a complementary information to those common measures. In addition, note that we can have an approximation with relevant structural information even for a non-HARDI single shell acquisition: in this case, b=1000 and 25 gradient directions were employed.
The method here proposed provides a way to estimate the RTOP using both a tensor approach or a SH decomposition. For low b-values, we can only have a rough approximation, related to the fact that we really need longer times to properly measure q-space features. However, relevant structural information of the white matter can be extracted even for those low b-values. For those cases, the information provided may not correspond exactly to the RTOP but some related feature that also has significant information.
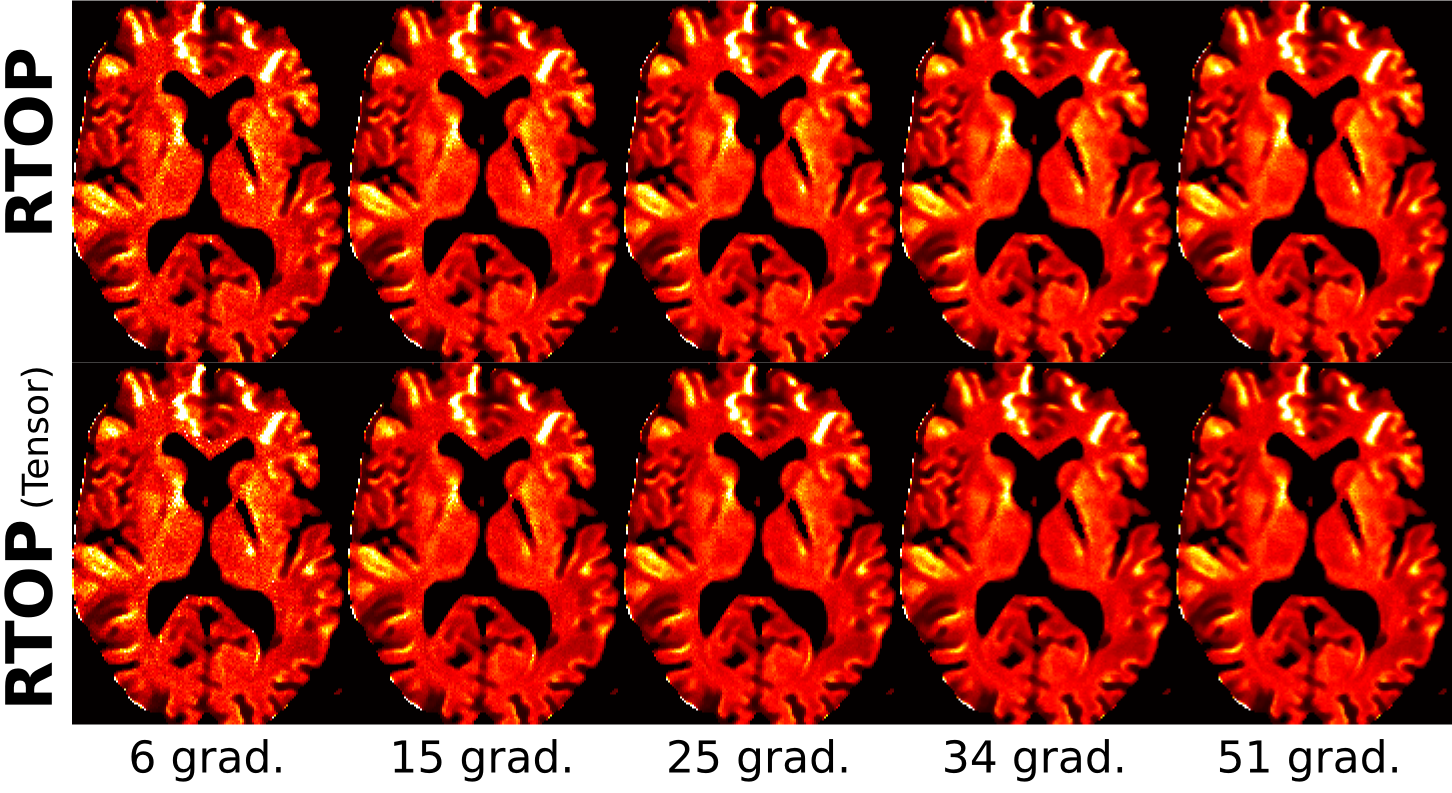
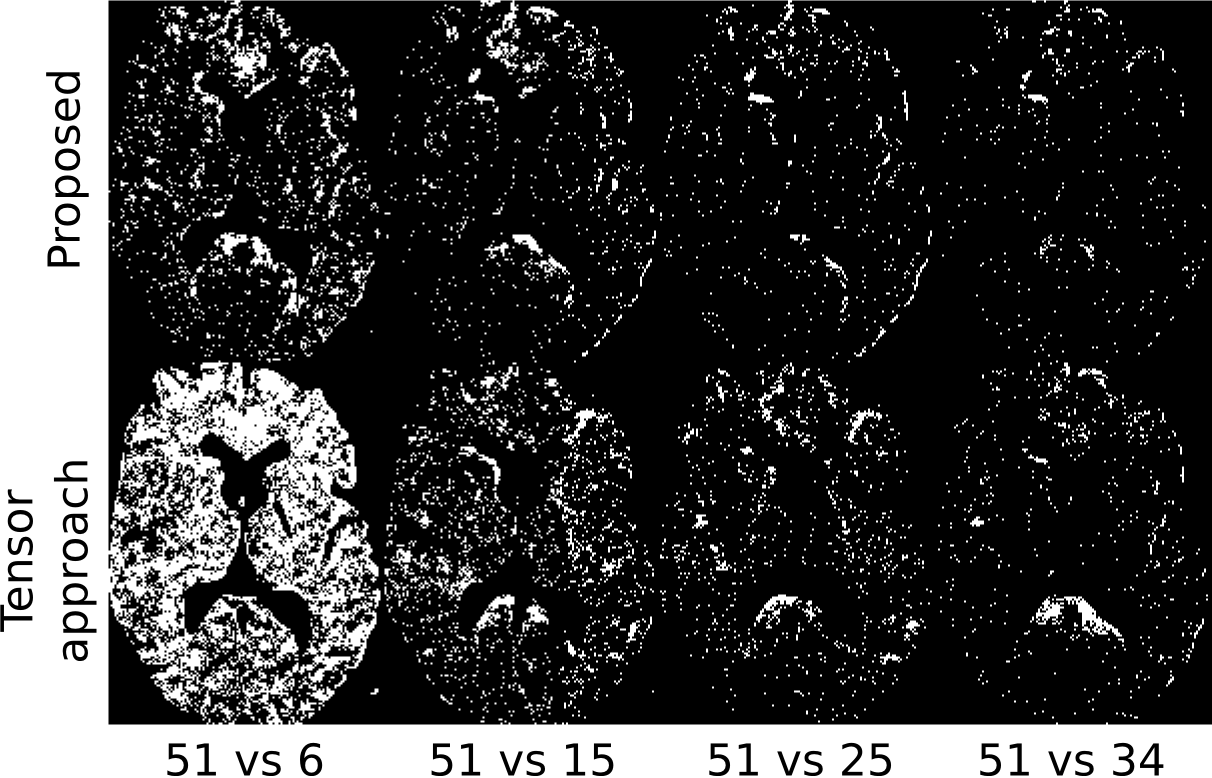
Finally, to test the robustness of the method, a pseudo-synthetic phantom is used (Fig. 3). 50 realizations with different number of gradient directions are considered. Results are compared to the 51-gradient estimation using a T-test. Results in Fig. 4 show (in white) those points with significant differences (p<0.01). Although visually (Fig. 3) the proposed method and the tensor may seem similar, Fig. 4 shows more consistent results when acquisition parameters change.
Acknowledgements
This work was supported by MICIN (Spain) research grant TEC2013-44194-P.References
[Assaf00] Assaf, Displacement imaging of spinal cord using q-space DWMRI, MRM 44(5) 2000.
[Hansen16] Hansen, Data for evaluation of fast kurtosis strategies, Scientific data, 3 (2016).
[Hosseinbor12] Hosseinbor, Extracting quantitative measures from EAP, MICCAI, LNCS 7511, 2012
[Ning15] Ning, Estimating diffusion propagator and its moments using directional FBFs, IEEE-TMI 34, 2015.
[Tristan09] Tristán-Vega, Design and construction of a realistic DWI phantom for filtering performance assessment, MICCAI, LNCS 5761, 2009.
[Wu08] Wu, Computation of Diffusion Function Measures in q-space using MRHDI, IEEE Tr. MI 27(6) 2008.
Figures