1604
Quantitative Comparison of Multiple High Angular Resolution Diffusion Imaging Techniques for Myocardium1Key Laboratory of Intelligent Medical Image Analysis and Precise Diagnosis of Guizhou Province, School of Compute Science and Technology, Guizhou University, Guiyang, China, 2Department of Radiology, Guizhou Provincial People's Hospital, Guiyang, China, 3Univ.Lyon, INSA-Lyon, Université Claude Bernard Lyon 1, UJM-Saint Etienne, CNRS, Inserm, CREATIS UMR 5220, U1206, F-69621, Lyon, France
Synopsis
We compared quantitatively three commonly used HARDI schemes for describing the myocardium structure in a unified frame-work. One pig heart was firstly scanned with 256 diffusion directions, and then the diffusion ODFs of q-ball imaging (QBI), diffusion spectrum imaging (DSI) and generalized q-space imaging (GQI) were reconstructed respectively, from which the myocardiac fiber orientations and the diffusion metrics were finally extracted and compared. The results show that the cardiac fiber crossing locations, crossing numbers, and the generalized fractional anisotropy detected by three schemes are totally different.
BACKGROUND
Myocardium architecture is significant for cardiac function and can be measured noninvasively with multiple diffusion magnetic resonance imaging (dMRI) schemes 1. For mapping the orientation of cardiac fiber bundles accurately, numerous high angular resolution diffusion imaging techniques (HARDI) have been proposed 2. However, the information of myocardium architecture obtained by different HARDI schemes and the mutual differences between them have not yet been reported quantitatively in a unified frame-work. In the present study, we compared the myocardium structures of one pig heart which were acquired with same condition and reconstructed with three commonly used HARDI techniques, namely Q-ball imaging (QBI) 3, diffusion spectrum imaging (DSI) 4 and generalized q-sampling imaging (GQI) 5,6. The difference in diffusion metrics, the fiber bundle orientations, the fiber crossing numbers at different AHA zones were analyzed in detail.METHODS
The diffusion weighted images of one in vitro pig heart was acquired using a 2D EPI diffusion sequence with the following parameters: TE is 83 ms, TR is 10 s, b-value is 1000 s/mm2, the number of diffusion directions is 256, the in-plane resolution is 2.4 mm, and the slice thickness is 3.1 mm. In DSI, the diffusion weighted (DW) images was smoothed firstly by a Hanning filter with a window size of 10, and then the diffusion orientation distribution function (ODF) was reconstructed by Fourier transform of the DW images and sharpened using a deconvolution method with a regularization parameter of 7. In QBI, the diffusion ODF was reconstructed using a spherical deconvolution method with Laplace-Beltrami regularization, the order of spherical harmonic was 8 and the regularization parameter was 0.8. In GQI, spin distribution function (SDF) was reconstructed with a diffusion sampling length of 1.25, from which the diffusion ODF is calculated and sharpened using deconvolution with a regularization parameter of 0.3. After the reconstruction, the streamline based tracking algorithm was used for visualizing the myocardium architecture.
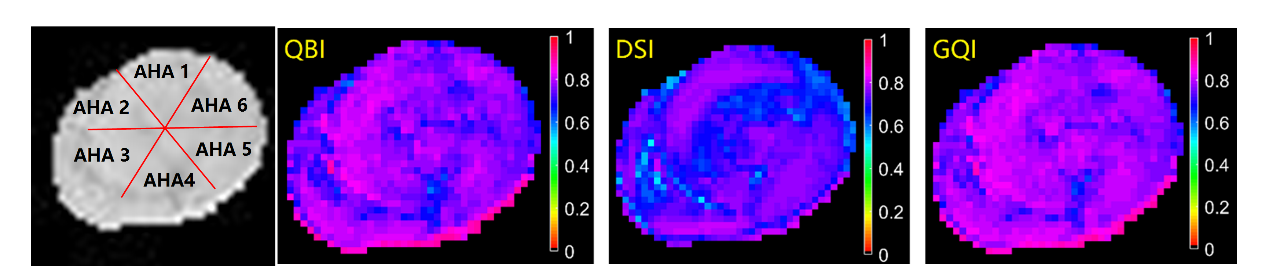
For quantitatively comparing the difference of three schemes, we divided one slice of heart into six AHA zones and calculated correspondingly the fiber orientations, fiber crossing number and the mean±std of the generalized diffusion anisotropy at each zone.
RESULTS
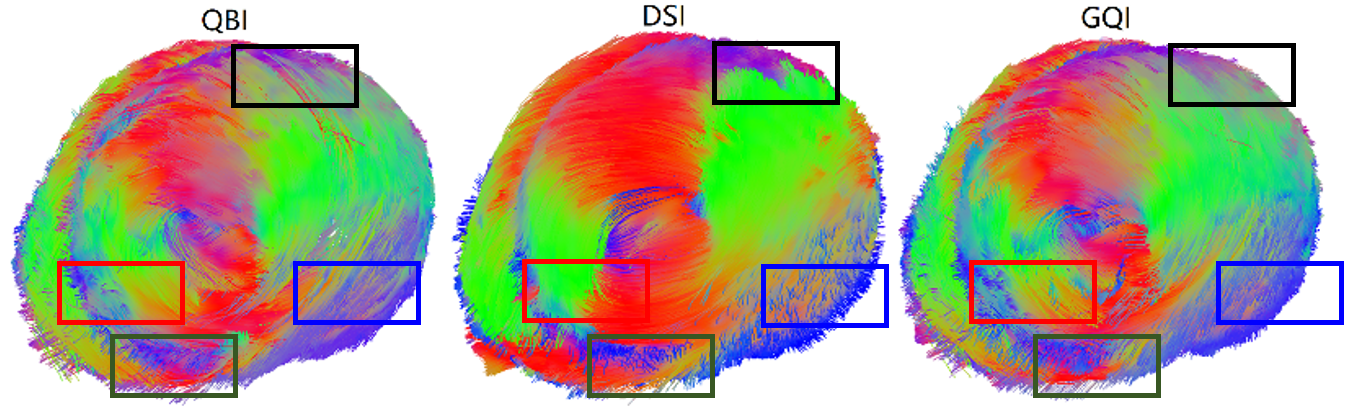
The cardiac fiber tracking result derived by QBI, DSI and GQI were given in Fig. 1. It can be seen that the main differences between them located at the anterolateral, inferoseptal, inferior and inferolateral zones, which corresponded respectively to the black, red, green and blue rectangle windows in Fig. 1.
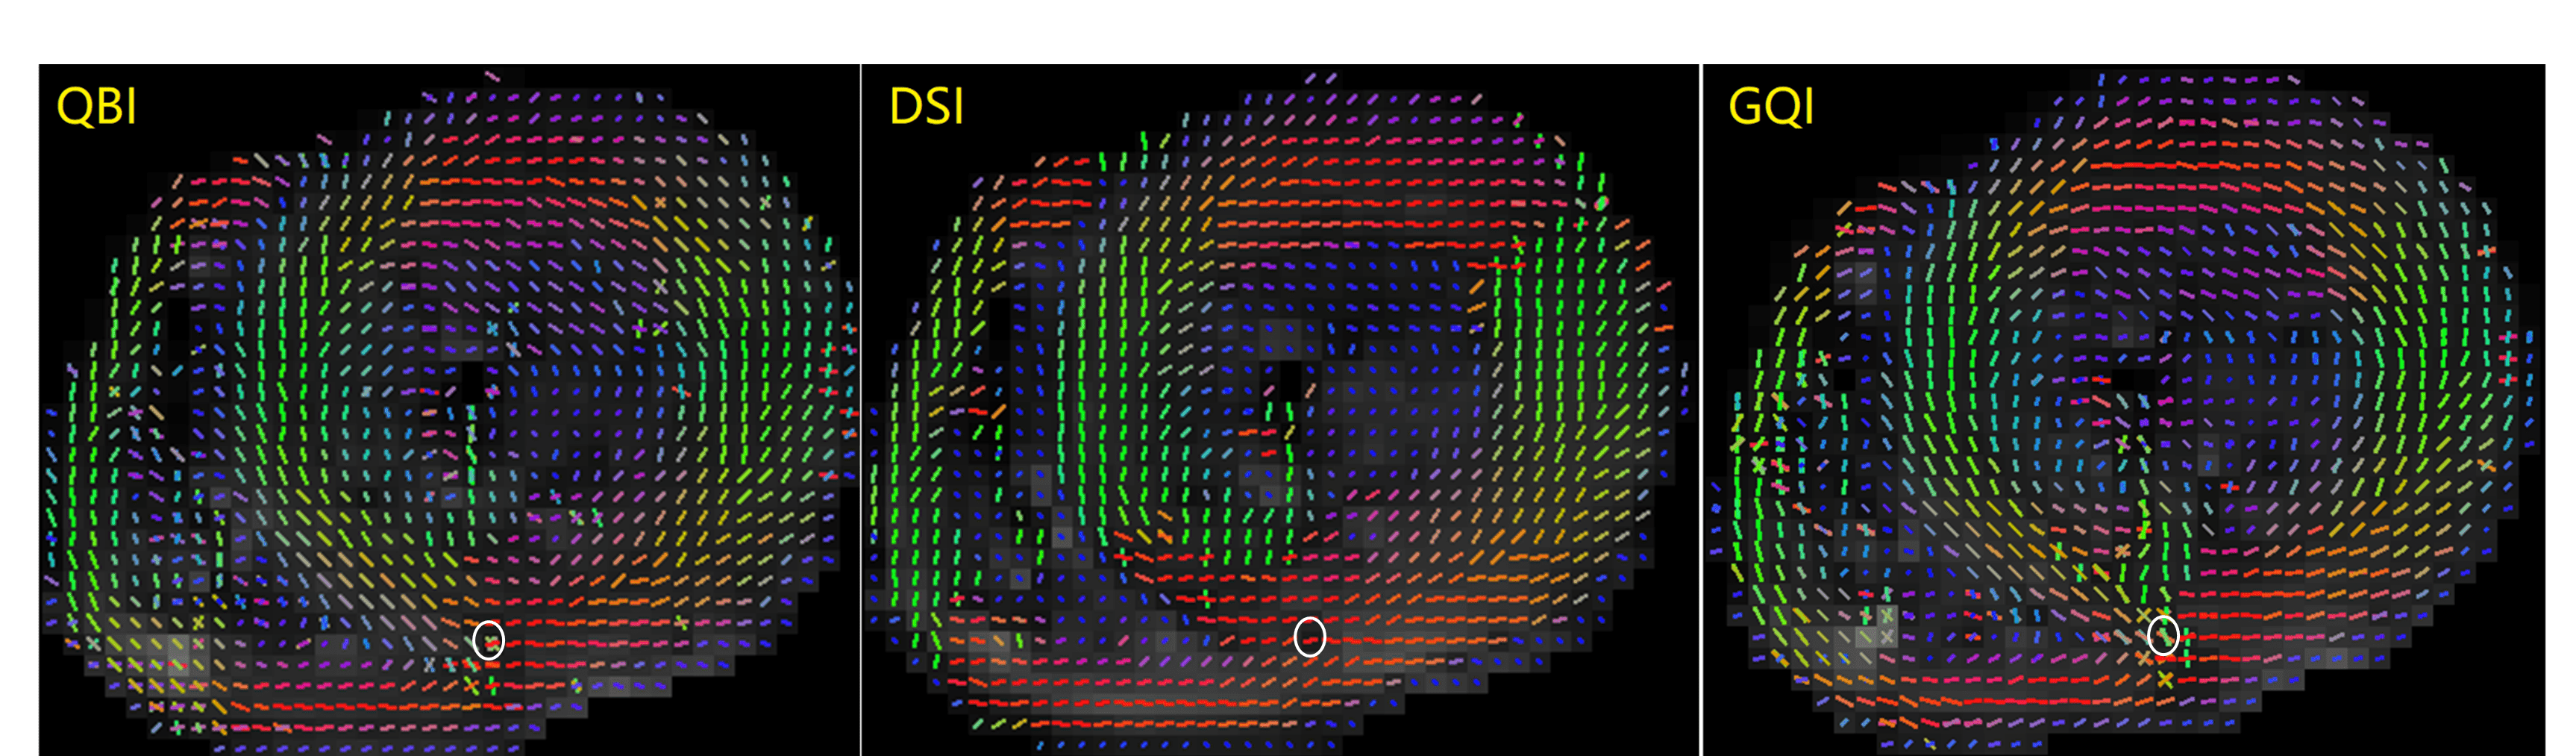
To further demonstrate such differences, the reconstructed fiber orientations for one slice was shown in Fig. 2. We observed that QBI, DSI and GQI are capable of detecting the fiber crossing, however, the number, the location and the angle of the crossing were greatly different. The fiber crossing detected by DSI mainly appeared at the anterolateral and inferoseptal zones, but that detected by QBI occurred at the inferior and inferolateral zones, and that detected by GQI emerged at inferior, inferoseptal and inferolateral zones. For illustration, the difference in the number of fiber crossing was outlined by a white circle in Fig. 2, where the crossing numbers measured by QBI, DSI and GQI are 3, 1, and 2 respectively.
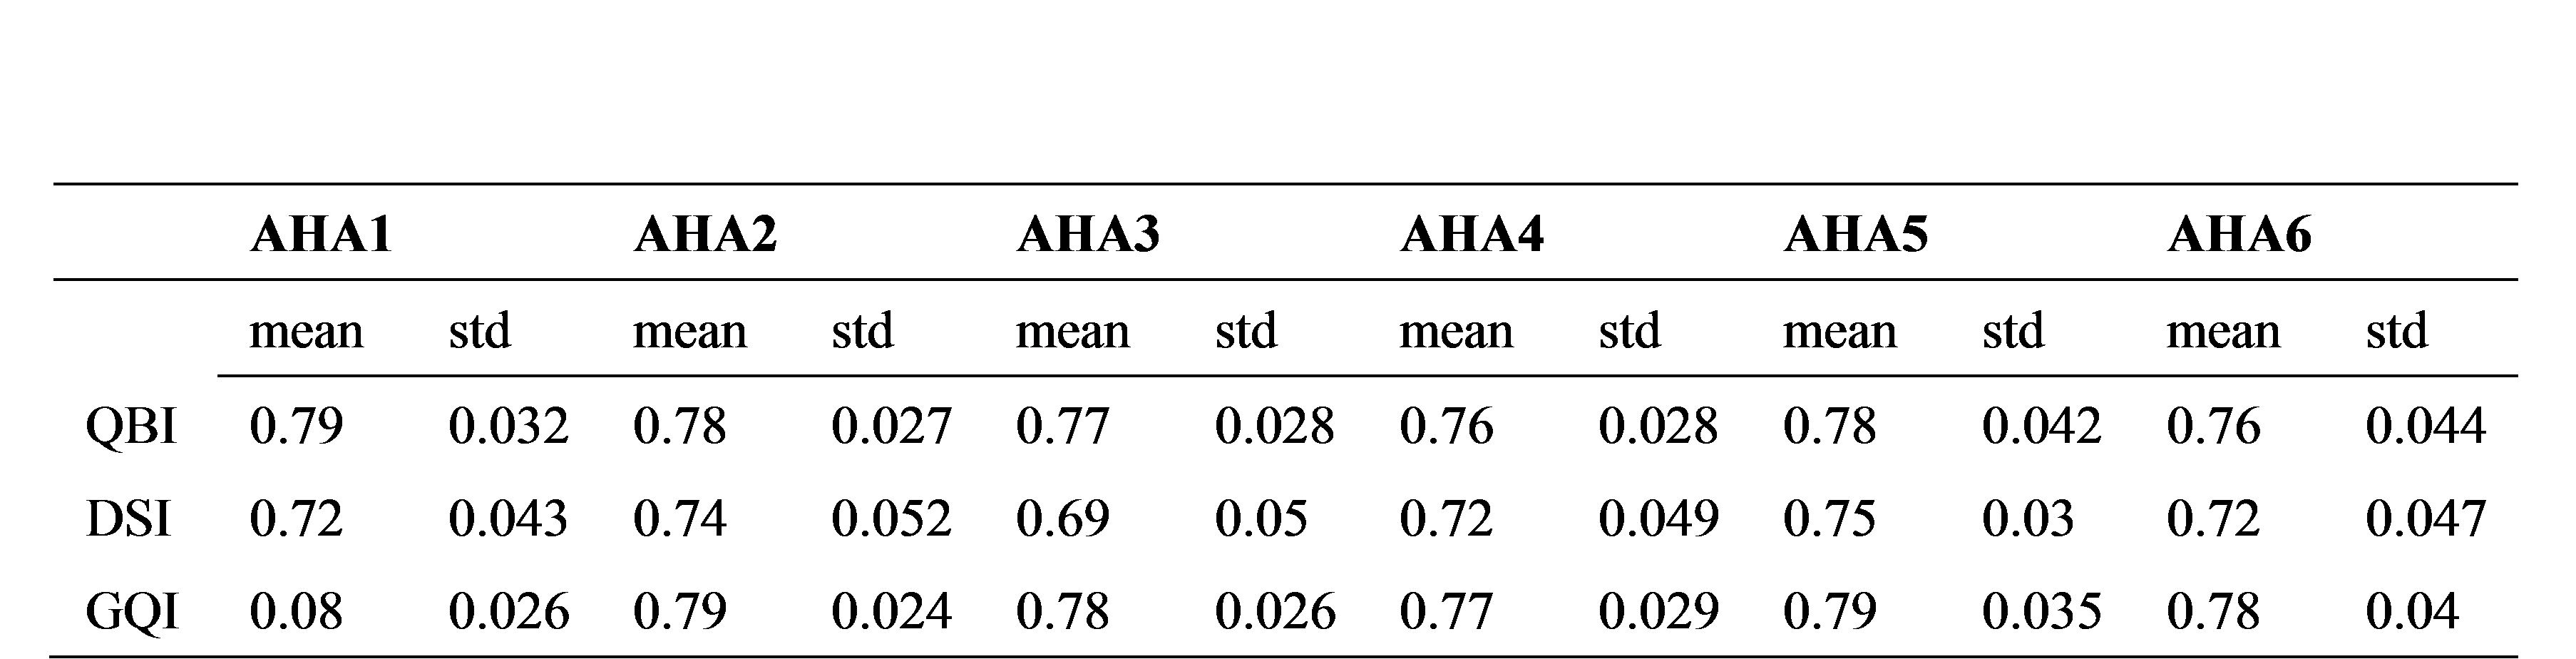
Besides the orientations, the generalized fractional anisotropy (GFA) maps of the same slice obtained by different schemes were also calculated, as shown in Fig. 3. We observed that the GFA obtained by DSI was obvious lower than that derived by QBI and GQI. The quantitative comparison at six AHA zones was given in Table. 1.
The mean GFA value detected by GQI was the greatest but the standard variance was almost the smallest, corresponding to less fiber crossing phenomenon, just being opposite to DSI.
DISCUSSION
In the present work, we investigated the differences among QBI, DSI and GQI for mapping the myocardium architectures. Such differences were analyzed quantitatively from the point of view of fiber crossing location, crossing numbers and the diffusion metrics. However, we analyzed them use only one heart which may bring some bias, in the future work, we will construct the HARDI atlas to compare different schemes more precisely and find the most appropriate ones for describing the myocardium structure.CONCLUSION
Our results indicates that the fiber crossing detected by the different HARDI schemes are totally different in the crossing location, crossing numbers and crossing angles. DSI are able to generate more fiber orientations and the corresponding diffusion anisotropy is lower than that of QBI and GQI.Acknowledgements
This work was supported by the National Nature Science Foundations of China (Grant No. 61661010), the Funds for Talents of Guizhou University (No. 2013(33)), the Nature Science Foundation of Guizhou province (Qiankehe J No.20152044, 20157115, 20161069) and the French ANR (MOSIFAH ANR-13-MONU-0009-01).References
1. Le Bihan D. Looking into the functional architecture of the brain with diffusion MRI. Int Congr Ser. 2006;1290:1-24.
2. Tuch DS, Reese TG, Wiegell MR, Makris N, Belliveau JW, Van Wedeen J. High angular resolution diffusion imaging reveals intravoxel white matter fiber heterogeneity. Magn Reson Med. 2002;48(4):577-582.
3. Aganj I, Lenglet C, Sapiro G. ODF reconstruction in Q-ball imaging with solid angle consideration. In: Proceedings - 2009 IEEE International Symposium on Biomedical Imaging: From Nano to Macro, ISBI 2009:1398-1401.
4. Wedeen VJ, Hagmann P, Tseng WYI, Reese TG, Weisskoff RM. Mapping complex tissue architecture with diffusion spectrum magnetic resonance imaging. Magn Reson Med. 2005;54(6):1377-1386.
5. Yeh FC, Wedeen VJ, Tseng WYI. Generalized q-sampling imaging. IEEE Trans Med Imaging. 2010;29(9):1626-1635.
6. Wang Y, Zhang H, Wang Y, et al. Differences between generalized q-sampling imaging and diffusion tensor imaging in the preoperative visualization of the nerve fiber tracts within peritumoral edema in brain. Neurosurgery. 2013;73(6):1044-1053.
Figures