1603
Comparison of intravoxel incoherent motion DWI, diffusion kurtosis imaging, and conventional DWI in predicting the chemotherapeutic response of colorectal liver metastases: preliminary experience1Department of Radiology, Fudan University Shanghai Cancer Center; Department of Oncology, Shanghai Medical College, Fudan University, Shanghai, China, 2Department of Medical Oncology, Fudan University Shanghai Cancer Center; Department of Oncology, Shanghai Medical College, Fudan University, Shanghai, China, 3MR Application Predevelopment, Siemens Healthcare, Erlangen, Germany, 4APPL, Siemens Shenzhen Magnetic Resonance Ltd., Shenzhen, China, 5MR Collaboration NE Asia, Siemens Healthcare, Shanghai, China
Synopsis
The aim of this study was to compare the performance of pre-treatment intravoxel incoherent motion DWI (IVIM-DWI), diffusion kurtosis imaging (DKI), and conventional DWI for predicting the chemotherapeutic response in patients with colorectal liver metastases (CRLMs). The results indicates that they are all potentially useful for predicting the chemotherapeutic response of CRLMs, with mean diffusion derived from DKI having the best performance.
Background and Purpose
A few previous studies have reported that IVIM-DWI has potential value for assessing the treatment response of CRLMs, 1-4 and there has been no reported research regarding the role of DKI in CRLMs until recently. Our study aimed to assess the usefulness and performance value of pre-treatment IVIM-DWI, DKI, and conventional DWI for predicting the chemotherapeutic response in CRLMs.
Methods
Twenty-three consecutive patients with unresectable CRLMs who underwent the standard first-line chemotherapy regimen were prospectively collected. Informed consent was obtained from all the participants. All the patients underwent baseline and a secondary MRI after receiving two cycles of chemotherapy on a MAGNETOM Skyra 3T MR scanner (Siemens Healthcare, Erlangen, Germany). An axial IVIM sequence was performed using a free-breathing, single-shot, echo-planar prototype sequence with the following imaging parameters: TR/TE = 5700/54 ms; FOV = 380 x 308 mm2; slice thickness = 5 mm; slice gap = 20%; scan matrix (interpolated) = 256 x 208; bandwidth = 2298 Hz/Px; b values = 0, 20, 40, 60, 100, 150, 200, 500, and 800 s/mm2; averages = 5, iPAT factor = 2; and total scan time = 4 min, 35 s. Axial DKI had the same parameters as IVIM, except the b values = 0, 100, 700, 1400, and 2100 s/mm2, averages = 6, TR/TE =8600/64 ms, and total scan time = 4 min, 30 s. The pixel-wise IVIM parameter map, including the perfusion fraction (PF), pseudodiffusion coefficient (D*), true diffusion coefficient (Dslow), and DKI parameter map, including mean diffusion (D) and kurtosis (K), were calculated by using the prototype post-processing software, Body Diffusion Toolbox (Siemens Healthcare, Erlangen, Germany). The conventional ADC map was calculated inline from the IVIM DWI data after acquisition on the scanner. The response was assessed by Response Evaluation Criteria In Solid Tumors (RECIST Version 1.1) after receiving two cycles of chemotherapy. The mean values of the pre-treatment parameters were compared between the responding group (complete and partial response, n = 9) and non-responding group (stable and progressive disease, n = 14). Receiver operator characteristics (ROC) analyses were further performed for the significant parameters.Results
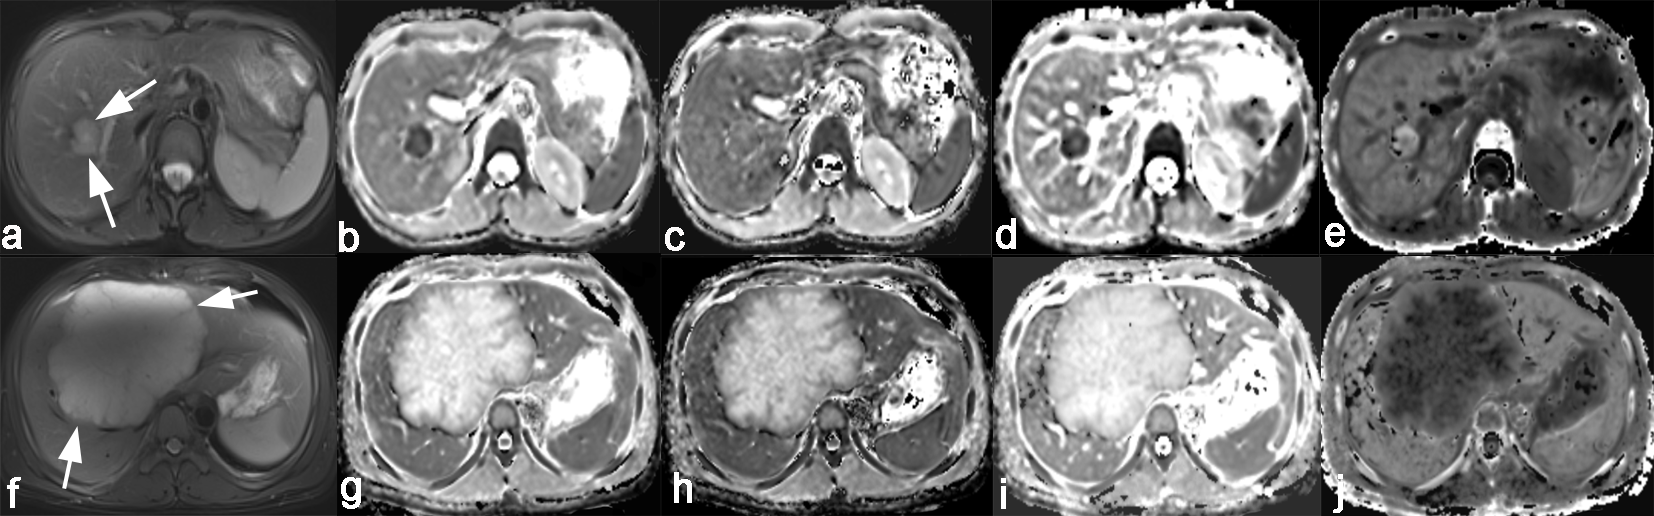
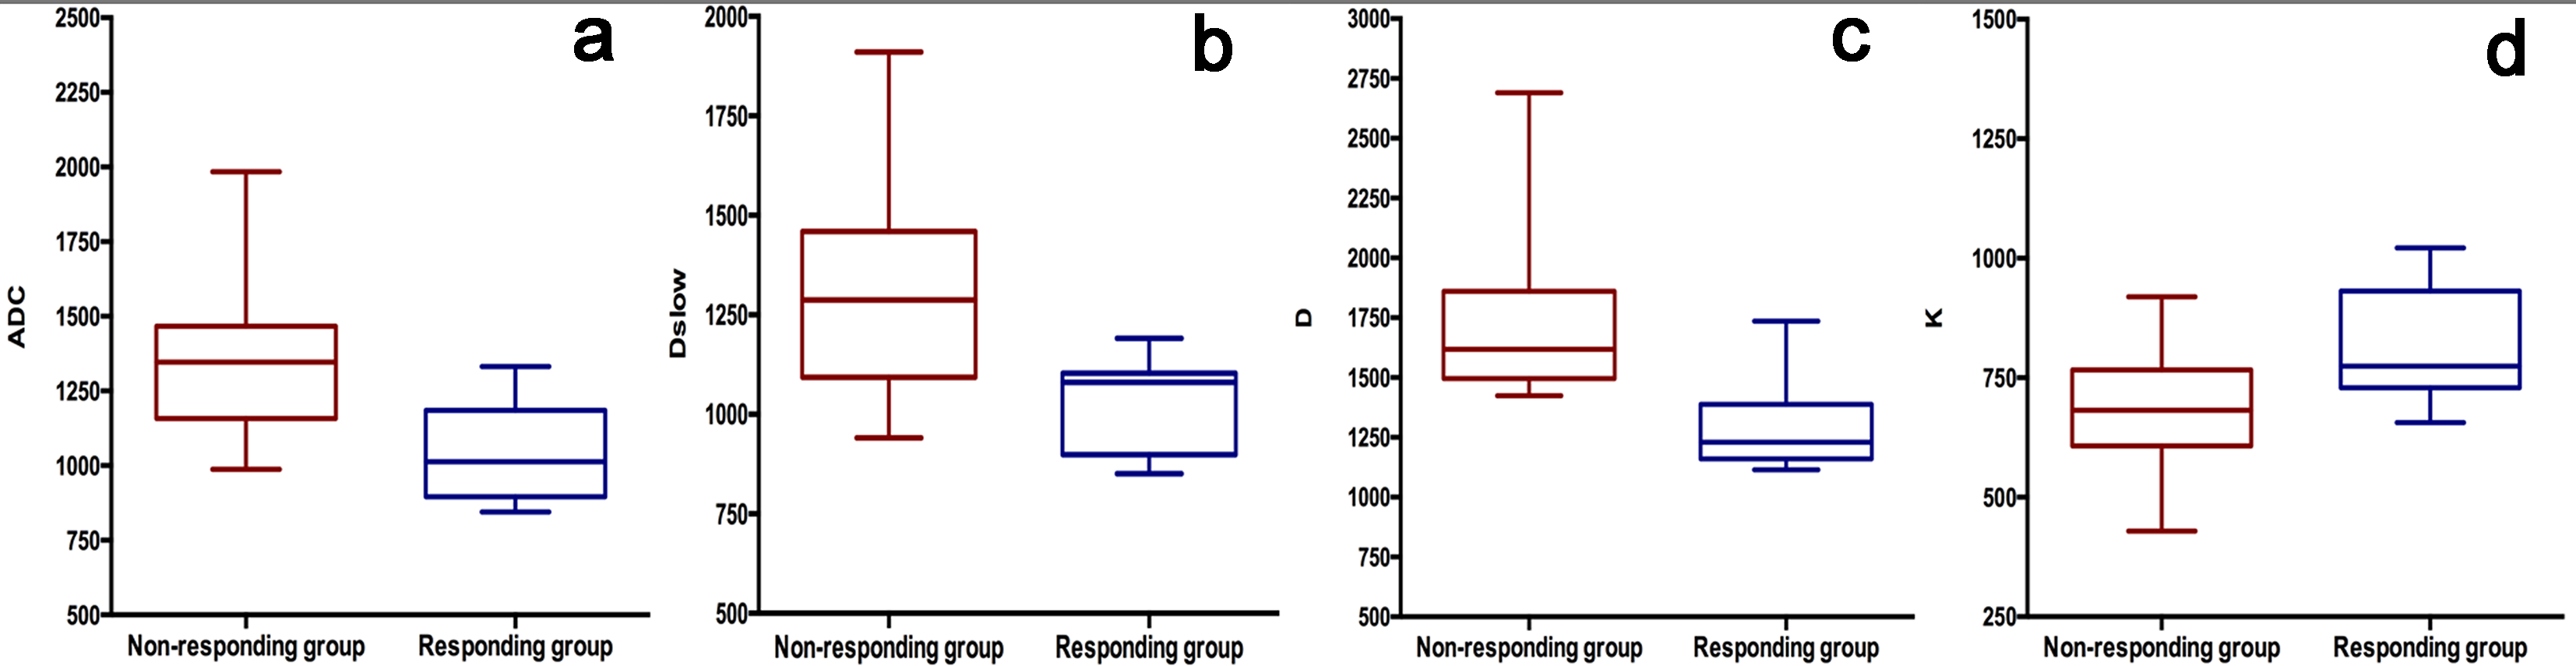
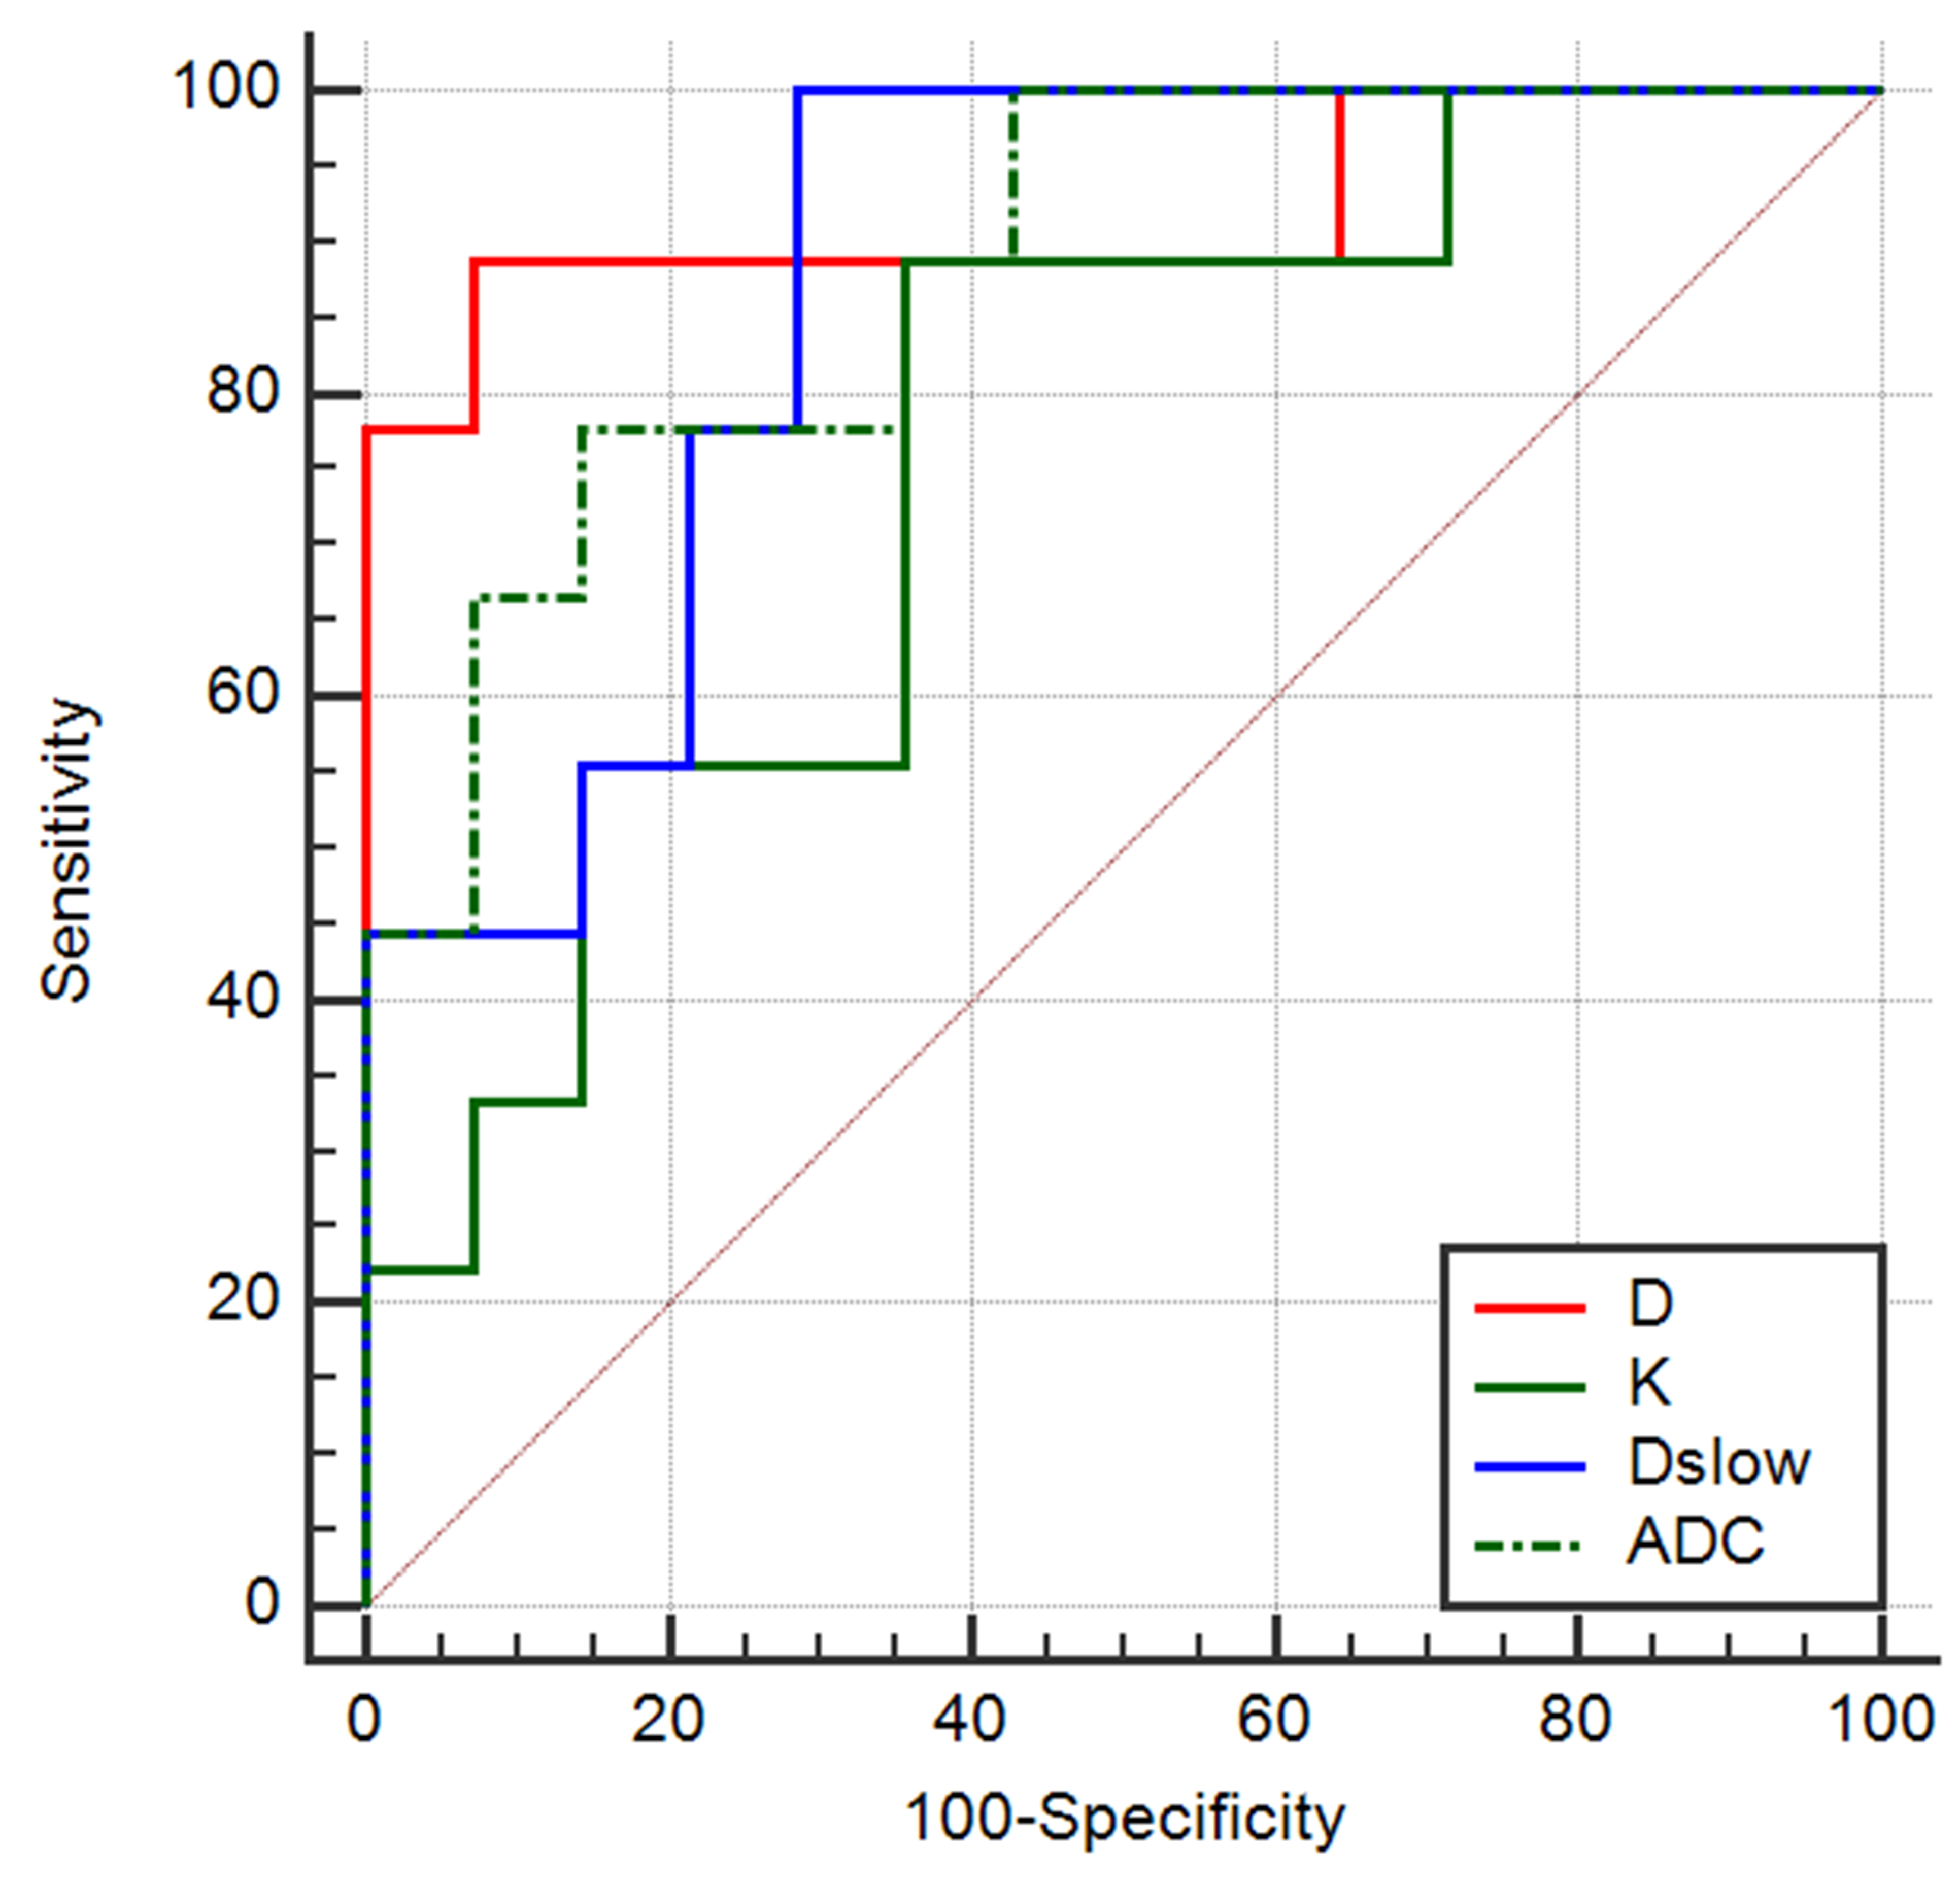
Lower ADC, Dslow, D (P = 0.002, 0.002, <0.001 respectively) and higher K (P = 0.039) were independently associated with a good response to chemotherapy with area under the ROC curves (AUCs) of 0.881, 0.873, 0.921, and 0.762, respectively. However, PF (P = 0.781) and D* (P = 0.201) did not show a significant difference. The best predictive parameter was D, derived from the DKI value (AUC = 0.921, sensitivity = 88.89%, specificity = 92.86% and cutoff value ≤ 1443.2 x 10-6 mm²/s). Figure 1 shows image examples from 2 patients, Figure 2 and 3 show the boxplot distribution and ROC curves of the significant parameters.Discussion and Conclusion
Our study showed that pre-treatment IVIM-DWI (Dslow), DKI (D and K), and conventional DWI (ADC) all demonstrate good to excellent diagnostic performance in predicting the chemotherapeutic response of patients with CRLMs. Moreover, the D value derived from DKI outperforms the other two methods, yielding the highest sensitivity and specificity, which indicates that DKI might provide additional information for predicting the response of CRLMs. Multicenter trials with larger sample sizes are needed to confirm our findings.Acknowledgements
This study was supported by the National Natural Science Foundation of China (Grant No. 81501437).References
[1] DE BRUYNE S, VAN DAMME N, SMEETS P, et al. Value of DCE-MRI and FDG-PET/CT in the prediction of response to preoperative chemotherapy with bevacizumab for colorectal liver metastases [J]. Br J Cancer, 2012, 106(12): 1926-1933.
[2] O’CONNOR J P, ROSE C J, JACKSON A, et al. DCE-MRI biomarkers of tumour heterogeneity predict CRC liver metastasis shrinkage following bevacizumab and FOLFOX-6 [J]. Br J Cancer, 2011, 105(1): 139-145.
[3] COENEGRACHTS K, BOLS A, HASPESLAGH M, et al. Prediction and monitoring of treatment effect using T1-weighted dynamic contrast-enhanced magnetic resonance imaging in colorectal liver metastases: potential of whole tumour ROI and selective ROI analysis [J]. Eur J Radiol, 2012, 81(12): 3870-3876.
[4] HIRASHIMA Y, YAMADA Y, TATEISHI U, et al. Pharmacokinetic parameters from 3-Tesla DCE-MRI as surrogate biomarkers of antitumor effects of bevacizumab plus FOLFIRI in colorectal cancer with liver metastasis[J]. Int J Cancer, 2012, 130(10) : 2359-65.
Figures