1599
Where's my water? Untangling the diffusion signal using the phasor representation1Center for Image Sciences, UMC Utrecht, Utrecht, Netherlands, 2Department of Biomedical Engineering, Eindhoven University of Technology, Eindhoven, Netherlands
Synopsis
The recently proposed phasor representation and associated unmixing method allow separation of multi-exponentially decaying signals. This method has achieved promising results on diffusion MRI data and boasts sub-second analysis of full datasets on regular desktop PCs. This work investigates the noise propagation properties of this method and the influence of misplacing the vertex of a component in phasor space when performing unmixing. Results indicate that the phasor method is feasible and that the influence of component misplacement is systematic, but smaller than the errors due to noise at regular diffusion MR signal-to-noise-ratio levels.
Purpose
Recently, Vergeldt et al. proposed the use of the phasor representation for multi-component separation of decaying signals in quantitative MRI.1-4 The formulation of the phasor representation is general and can therefore be applied to any one-dimensional signal with components decaying with different decay constants.5,6
As Vergeldt et al. suggested, the phasor representation can be applied to multi b-value (multi-shell) diffusion weighted images (DWI).1 Due to a fully analytical description and efficient implementation using fast Fourier transforms (FFT) the phasor transformation is very fast. However, phasor analysis only allows to separate three components and noise propagation from source DWIs into component estimates is presently unknown. In this work, we therefore investigate the influence of component (mis)placement and noise on the accuracy of phasor analysis.
Theory
Briefly, the phasor representation is created by taking the Fourier transform of a signal and dividing that by the sum of the same signal:$$$\frac{\mathcal{F}(s(t))}{{\int}s(t)dt}$$$. If the input is an exponential function of time t with lifetime $$$\tau$$$ ($$$s(t)=e^{-t/\tau}$$$), the Fourier transform at frequency ω is the Lorentz function: $$$D(\omega)=\frac{1}{1+j{\omega}t}$$$. Plotting the real part of this function against the imaginary part for a fixed frequency ω for all possible lifetimes $$$\tau$$$ produces a semicircle with radius 0.5 and center (0.5, 0).
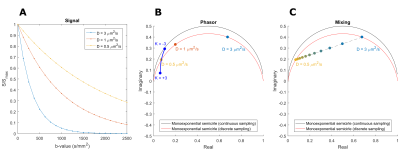
For discrete sampling, the Fourier transform is approximated using the discrete FFT and the semicircle deforms into an ellipse with known dimensions.5 Figure 1 schematically shows a phasor plot of a diffusion signal with various values for diffusivity (D) and kurtosis (K).
A mixed signal containing 2 components (i.e. bi-exponential decay) is located on a line connecting the locations of the two pure components in phasor space. The location of the signal on the line is determined by the relative weight of each component. Analogously, mixes of more components are located inside a polygon defined by the pure component vertices.5 Knowing the locations of the pure components, the contribution of each component per voxel can be estimated, i.e. unmixing.6
Methods
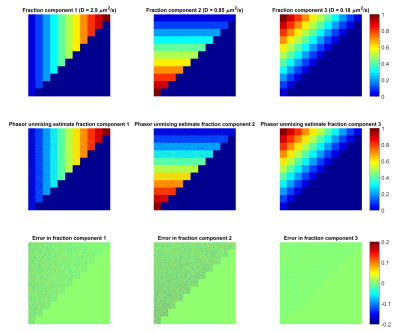
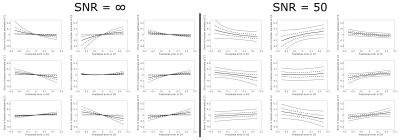
First, a digital phantom (Figure 3, top row) was constructed consisting of three components with diffusivity values: D1= 2.9, D2=0.85, D3=0.18 μm2/s, respectively. The phantom contains component fractions from 0 to 1 in steps of 0.1, resulting in 66 fraction combinations summing to 1. DWI images were simulated with 21 equally spaced b-values between 0 and 2500 s/mm2. Gaussian noise was added with a signal-to-noise-ratio (SNR) level of 50. The influence of misplacing component vertices was investigated by unmixing the simulated images with different base-diffusivities, varied from 0.75*Dtrue-1.25*Dtrue in steps of 0.05*Dtrue.
Secondly, a diffusion dataset of one healthy male volunteer (aged 25) was obtained with the same b-values. For each b-value, three orthogonal gradient directions were measured and subsequently averaged. To determine the location of the unmixing triangle’s vertices in phasor space, the average signal of the whole brain was fitted to a triple exponential: $$S=S_{0}(F_1e^{-b{\cdot}D_1}+F_2e^{-b{\cdot}D_2}+(1-F_1-F_2)e^{-b{\cdot}D_3+\frac{1}{6}{\cdot}b^2{\cdot}D_3^2{\cdot}K}),$$ where S is the measured MR signal, S0 a scaling constant, Fx component x’s signal fraction, b the b-value, Dx component x’s diffusivity and K the kurtosis which was allowed only for the most strict component.
Results
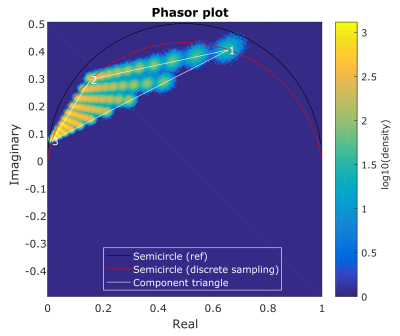
Figure 2 shows the phasor representation of the digital phantom data at SNR=50. The spacing between increments in fraction is nonlinear and the effect of noise seems to differ per component. Figure 3 demonstrates that the amount of noise propagating into the fraction estimations is largest for D2: the standard deviation of the error was 0.047, 0.060 and 0.022 for D1,D2 and D3 respectively. Figure 4 shows the errors due to vertex misplacement, both with and without noise. The maximum interquartile range due to a 10% error in diffusivity was 0.033, the maximum range due to noise (without misplacement error) was 0.080.
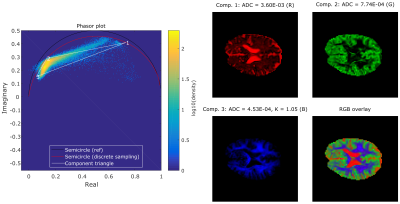
Figure 5 shows the results of the fit and 3-component unmixing on in-vivo data. Applying the phasor transform and unmixing the entire brain dataset took less than one second. The values for D and K, and the fraction maps seem physiologically plausible.
Discussion
Although the influence of noise is noticeable, accurate phasor unmixing is feasible at regular diffusion SNR levels. Component vertex misplacement seems to cause a systematic bias in fraction estimation, though this bias is generally smaller than the effect of noise at SNR=50. The in-vivo results show fraction maps that may represent free water, hindered and restricted diffusion compartments, however further studies are needed.Conclusion
Phasor representation allows fast (sub-second) unmixing of decay components in diffusion datasets. The choice of component placement prior to unmixing can cause systematic errors, but these are smaller than the effect of noise at regular SNR levels.Acknowledgements
This work is part of the IMDI research program with project number 104003019, which is (partly) financed by the Netherlands Organization for Scientific Research (NWO).References
1. Vergeldt F J, Prusova A, Fereidouni F, et al. Multi-component quantitative magnetic resonance imaging by phasor representation. Sci Rep. 2017;7.
2. Clayton A H A, Hanley Q S, and Verveer P J. Graphical representation and multicomponent analysis of single-frequency fluorescence lifetime imaging microscopy data. Journal of Microscopy-Oxford. 2004;213:1-5.
3. Redford G I, and Clegg R M. Polar plot representation for frequency-domain analysis of fluorescence lifetimes. Journal of Fluorescence. 2005;15(5):805-815.
4. Digman M A, Caiolfa V R, Zamai M, et al. The phasor approach to fluorescence lifetime imaging analysis. Biophys J. 2008;94(2):L14-L16.
5. Fereidouni F, Esposito A, Blab G A, et al. A modified phasor approach for analyzing time-gated fluorescence lifetime images. J Microsc. 2011;244(3):248-258.
6. Fereidouni F, Bader A N, and Gerritsen H C. Spectral phasor analysis allows rapid and reliable unmixing of fluorescence microscopy spectral images. Opt Express. 2012;20(12):12729-12741.
Figures
