1594
A novel method for the detection of the number of compartments in diffusion MRI data1Physical Sciences for Health Doctoral Training Centre, University of Birmingham, Birmingham, United Kingdom, 2Institute of Cancer and Genomic Sciences, University of Birmingham, Birmingham, United Kingdom, 3Department of Oncology, Birmingham Children's Hospital, Birmingham, United Kingdom, 4School of Computer Science, University of Birmingham, Birmingham, United Kingdom
Synopsis
There is a need for a method that can detect the number of components within multi b-value diffusion-weighted imaging. In particular, this would aid in the identification and correction of partial volume effects (PVE) within the brain. A PVE model was simulated to contain varying ratios of cerebrospinal fluid and white matter. Multi-exponential fitting methods were applied and found to be unsuccessful in identifying the number of components within the model. A novel fitting method, the Autoregressive Discrete Acquisition Points Transformation, was applied to simulations. Following manipulation through the discrete Z-domain, the number of components were correctly identified.
Introduction
The most common multi-exponential model for the fitting of multi b-value diffusion-weighted MRI data is the bi-exponential IVIM model1. Use of the IVIM model in the brain requires cautious interpretation due to partial volume effects between the cerebrospinal fluid (CSF) and cerebral cortex. The high value of the diffusion coefficient in CSF results in the incorrect detection of a large perfusion value within the cerebral cortex2. Hence there is a need for a model that can detect the number of compartments within the data, enabling the assessment and correction of partial volume effects. The addition of another component (CSF) to the brain matter signal suggests that an additional exponential term within the fitting model is needed. However, tri-exponential models have to make several prior assumptions and risk overfitting. It is hypothesised that the number of exponential terms within diffusion data cannot be determined with current exponential fitting methods.
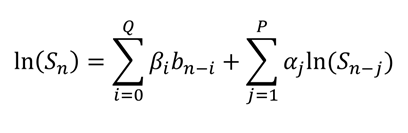
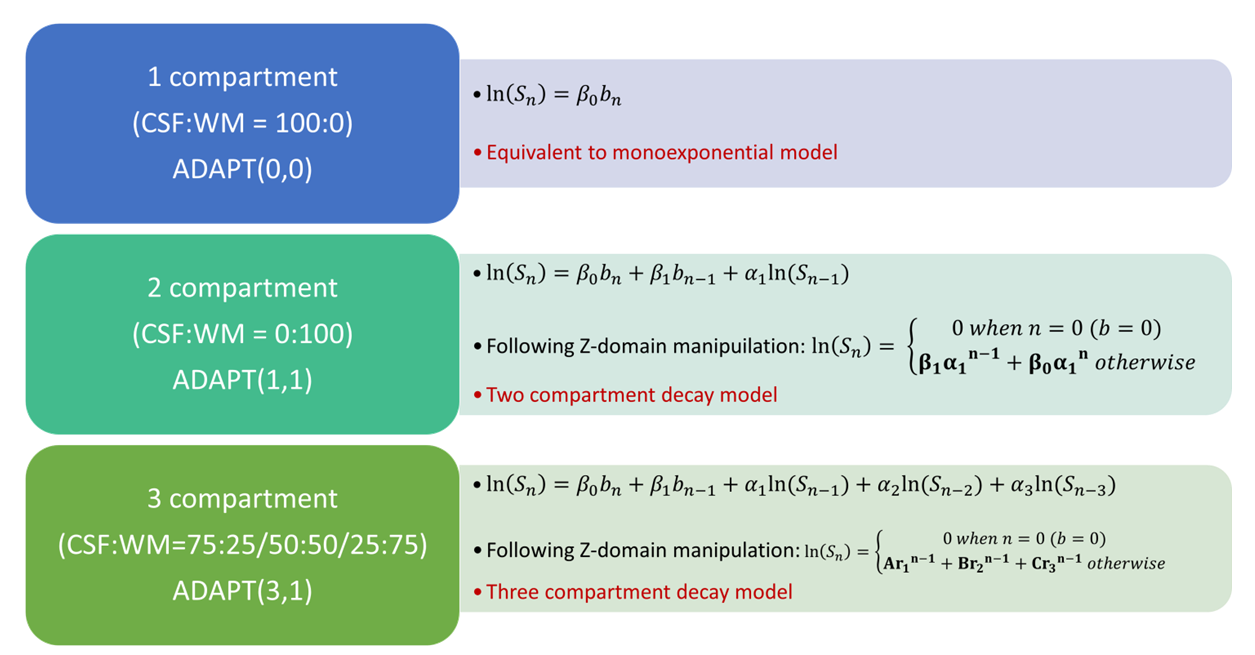
The study aim was to develop a new fitting method, named the autoregressive discrete acquisition points transformation (ADAPT), (Figure 1) which can detect the number of components in the signal. The ADAPT method treats the diffusion signal as a function of discrete acquisition points (n)3. In this study the performance of the ADAPT method was compared to exponential fitting methods.
Methods
Diffusion-Weighted MR data was simulated (SNR ≈ 80) to create both a CSF and white matter (WM) model. The diffusion coefficient of CSF was assumed to be that of free water at 37°C (DCSF= 3 × 10⁻³mm2), and the WM model parameters were taken from averaged values previously reported in a volunteer study (fCSF=0.07; DWM=3 × 10⁻³mm2/s; D*WM=3 × 10⁻³mm2/s)4. A partial volume effect (PVE) model was created as a summation of the CSF and WM model such that
$$Signal=f_{CSF}e^{(-bD_{CSF})} + (1-f_{CSF})(f_{WM}e^{(-bD_{WM})}+(1-f_{WM})e^{(-bD*_{WM})})$$
Where fCSF indicated the fraction of the signal that was contributed by the CSF compartment. The model was created using a range of exponentially spaced b-values between 0 and 1000 [0,20,40,80,110,140,170,200,300,500,1000]. A range of PVE models were created with varying CSF:WM ratios. Mono-, Bi-, and Tri-exponential fitting methods were applied to each PVE model and the optimum fit, inferring the number of compartments in the data, was selected by assessing the Akaike Information Criterion for finite data (AICc)5. The relative significance of the optimum fit was justified with the use of Bayes Factors6. The bi-exponential fitting method was assessed using non-linear least squares minimisation, with the Levenberg-Marquardt algorithm and a constrained 2-parameter fitting method7. The triexponential fitting method used the same minimisation technique and a constrained 4-parameter fitting method. The ADAPT method enables the diffusion signal to be represented as a linear summation of previous Signal(n) and b-values(n). The number of lagged terms included was varied from (0,0) to (3,3). The transfer function of the optimum model was then manipulated to the z-domain. An inverse z-transform was then performed to remove the lag and the number of components established.
Results
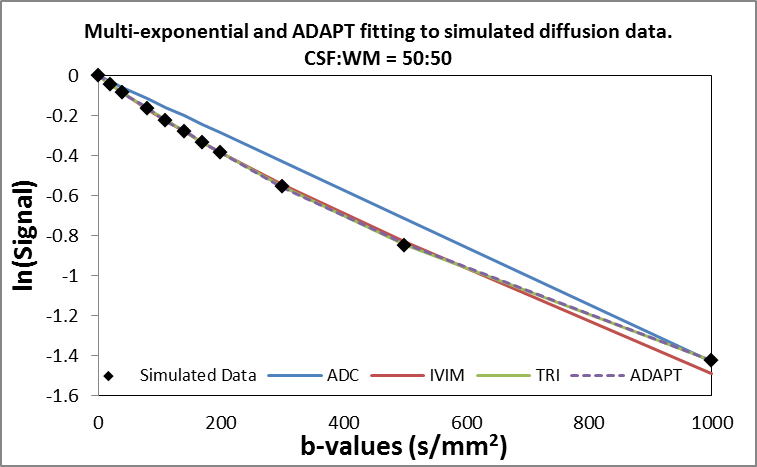
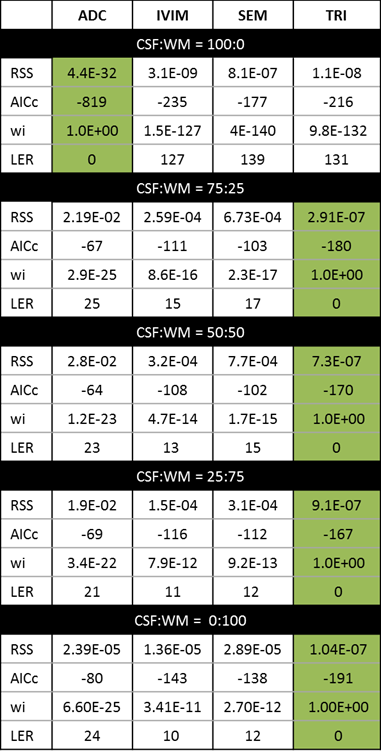
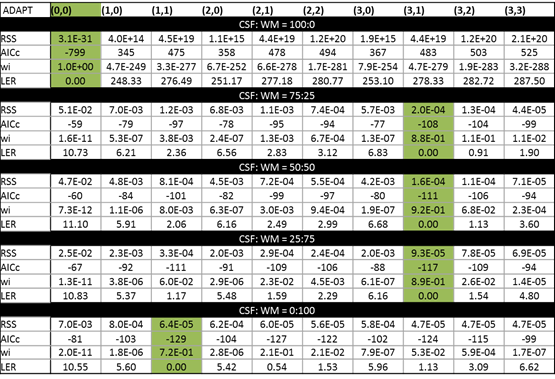
The multi-exponential fitting methods were applied to the PVE models (Figure 2), based on the AICc the number of detected compartments did not correspond to the number of exponential terms present in the signal (Table 1). In particular, a tri-exponential model was found to best represent both 2 and 3 compartment models. When the ADAPT method was applied a distinct number of terms were found to be able to distinguish between compartment models (Table 2). The 1, 2 and 3 compartment models were found to be best fitted by ADAPT orders (0,0), (1,1) and (3,1) respectively- no other orders were found to be significant. The ADAPT(0,0) fit for the 1 compartment model was found to be equivalent to the monoexponential model. Upon performing the inverse z transform, ADAPT(1,1) was found to contain two decay terms and ADAPT(3,1) three decay terms (Figure 3).Discussion
It has been demonstrated that the number of components with diffusion-weighted data is hard to determine with current exponential fitting methods. The ADAPT method can make this distinction, even when the third component is more subtle. i.e CSF:WM ratio is 25:75. The ADAPT method can therefore be exploited to reveal the fundamental nature of the diffusion data. Further investigations are needed to manipulate the ADAPT components into exponential terms.Conclusion
The ADAPT method has shown that it can distinguish between multi-exponential diffusion data containing different numbers of compartments. This is something which cannot be done with current exponential fitting methods. Such a novel method will allow for the identification of different compartments within diffusion data and, with further work, enable the detection and correction of partial volume effects.Acknowledgements
This work was funded by the Engineering and Physical Sciences Research Council (EPSRC) through a studentship from the Sci-Phy-4-Health Centre for Doctoral Training (EP/L016346/1), the National Institute for Health Research (NIHR) via a research professorship (13-0053), the Paediatric Experimental Cancer Medicine Centre and Free Radio in conjunction with Help Harry Help Others (HHHO).References
1. D. Lebihan et al., Radiology, v161, p401-7 (1986)
2.C. Federau. NMR Biomed v30(11) (2017)
3.S.D. Stearns Digital Signal Processing with examples in MATLAB, CRC Press (2003)
4.WC WU et al. Eur Radiol v25(8) p2485-2492 (2015)
5.H. Akaike IEE-TAC v19(6) p716-723 (1974)
6.R. Kass & A.Raftery J.Am.Stat Assoc v90 p773-795 (1995)
7.E. Meeus et al.,J Magn Reson Imaging,(2016)
Figures