1593
Characterization and Correction of Abnormally Low Mean Kurtosis Values1Harvard Medical School, Boston, MA, United States
Synopsis
Diffusion kurtosis imaging (DKI) often yields abnormally low mean kurtosis (MK) values that are physically and/or biologically implausible. We aim to characterize the relationship between abnormally low MK and baseline (b0) values. We show that too low b0 signals explain abnormally low MK values. We propose an automatic and threshold free approach for the identification of low MK voxels, along with a correction strategy based on adaptive smoothing. Our results suggest that modifying the b0 is sufficient to resolve the vast majority of low MK values, and is preferred over two other popular correction methods.
INTRODUCTION
Diffusion kurtosis imaging (DKI) 1 extends diffusion tensor imaging (DTI) 2 by characterizing non-Gaussian water molecule diffusion, providing important microstructural information reflecting restricted diffusion 3,4. However, kurtosis tensor estimation in DKI requires the acquisition of multiple b-values, reaching to higher b-values, which are more sensitive to artifacts such as noise and motion 5,6. Often, the estimation yields mean kurtosis (MK) values that are physically and/or biologically implausible, i.e., negative or very low comparing with neighboring voxels 5 (Figure-1a).
Previous attempts to resolve low MK values include imposing positivity constraints 5, and performing signal denoising 6. However, the proposed approaches are not always effective, and are applied on the entire image, which also affects voxels where the MK values do not require altering.
We aim to characterize the relationship between abnormally low MK and baseline (b0) values. We show that too low b0 signals explain abnormally low MK values. We propose an automatic approach for low MK identification, along with a correction strategy using adaptive smoothing.
METHODS
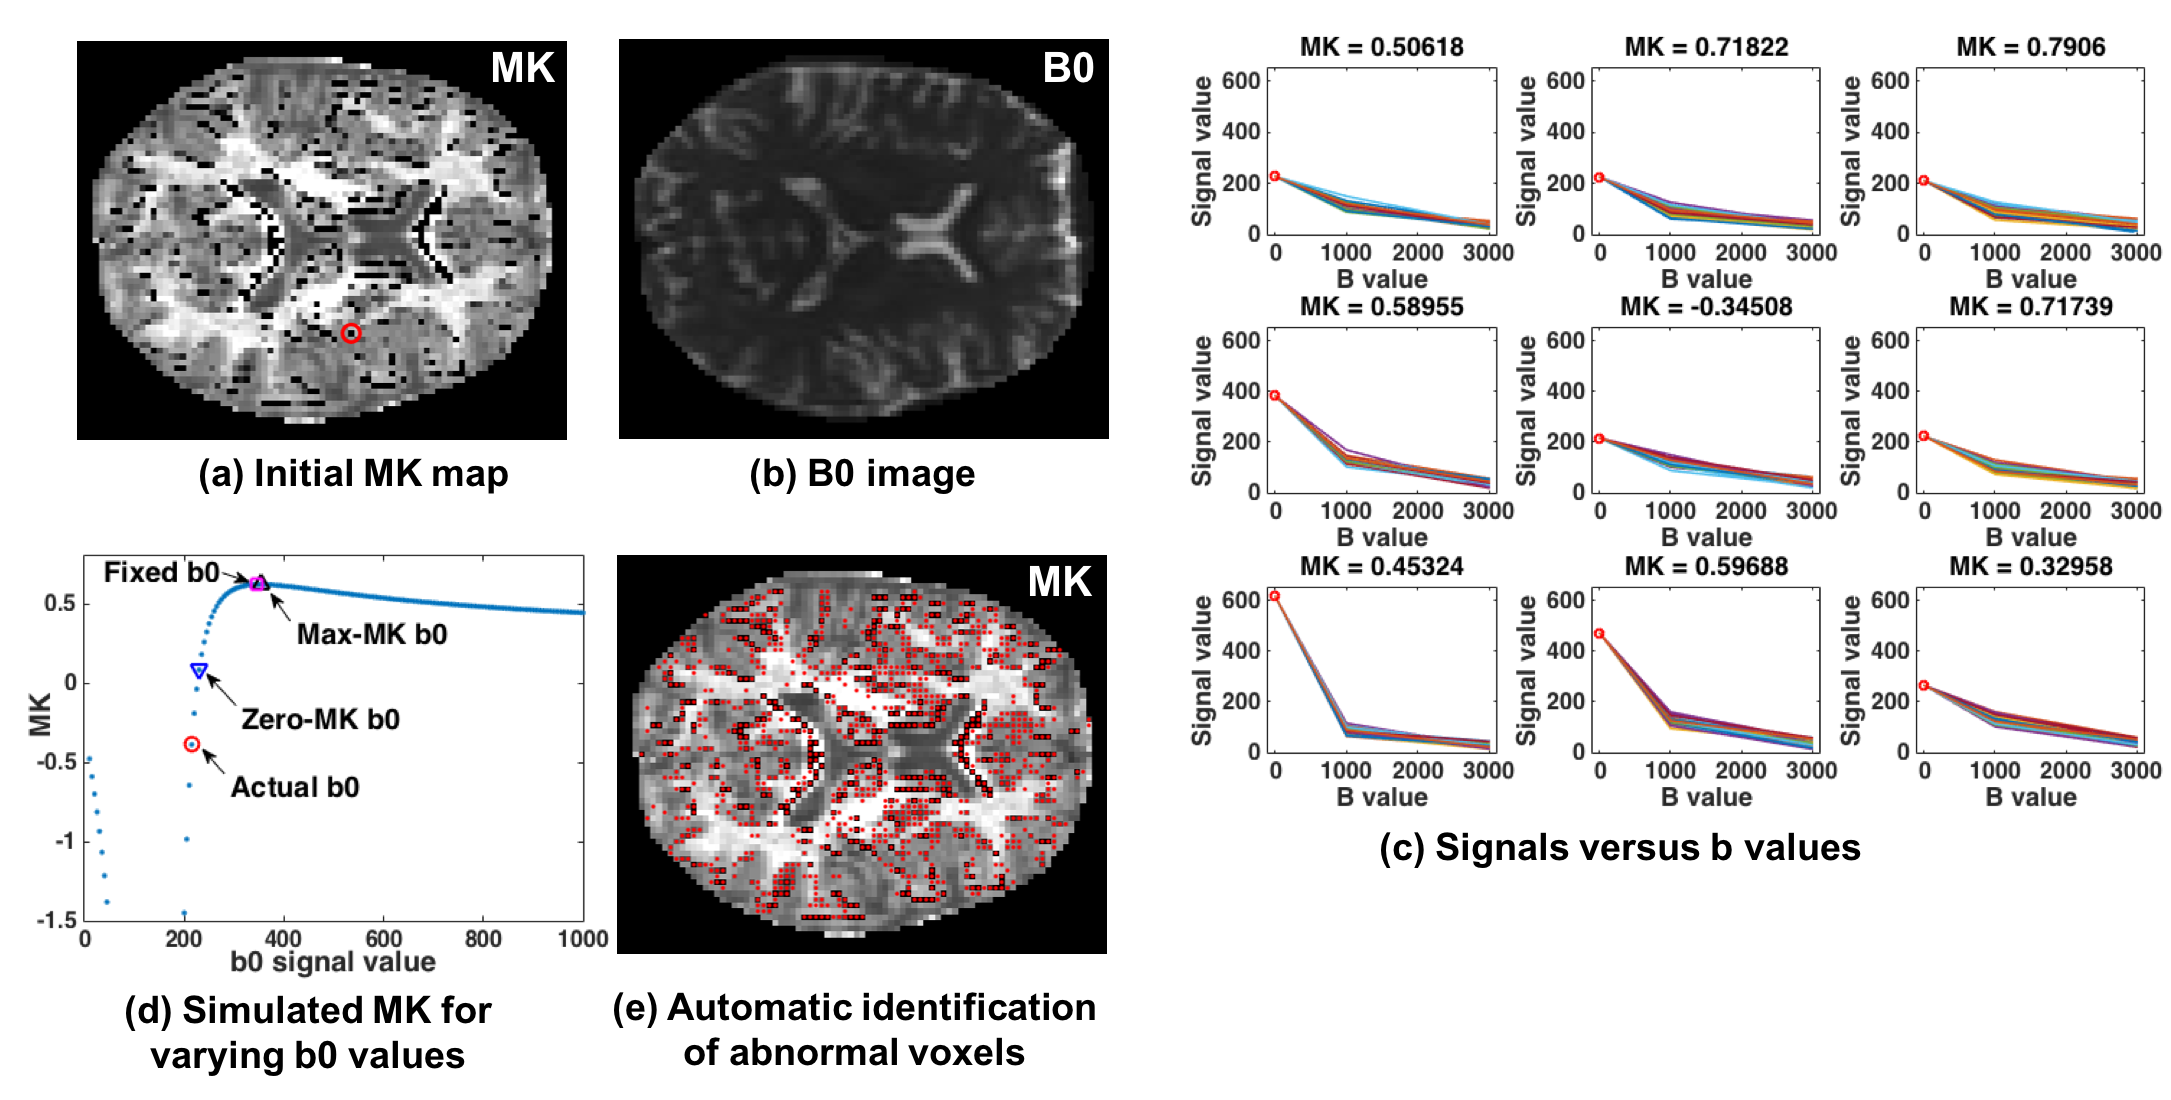
We collected multi-shell 3T diffusion MRI (b=0/1000/3000 s/mm2, same 30 directions in each shell, 5 b=0, TE/TR=109/15800 ms, 2x2x2 mm3), and compared with a Human Connectome Project (HCP) 7 dataset (b=0/1000/2000/3000 s/mm2, 270 directions, 18 b=0, TE/TR=89.5/5520 ms and 1.25x1.25x1.25 mm3). To investigate the effect of the b0 value on MK, for each voxel, we generated synthetic datasets by replacing the actual b0 images with values in the range of 0.1 to 10 times of the average b0 over the volume. The diffusion weighted signal was not altered. We estimated MK using a weighted linear least square (WLLS) fitting 8 for each synthetic dataset resulting in a curve of MK versus b0 signal (Figure-1c). The MK curves have similar shape across voxels. In each MK curve we detected two points of interest, the lowest b0 value yielding MK=0 (zero-MK b0), and the b0 yielding maximal MK (max-MK b0). Voxels with predicted unusual MK values were detected as average b0 signals which were closer to the zero-MK value than to the max-MK value (Figure-1d). We propose to correct low MK signals by an adaptive smoothing process, replacing the b0 of an identified voxel with the average b0 signal of neighboring voxels that have higher b0 signal than the identified voxel. We compared the proposed approach with two approaches that are currently used in leading DKI implementation packages: 1) Gaussian smoothing 6 (Dipy) 9 and 2) constrained fit 5 to kurtosis>0 (NYU-DKI) 10. For all methods, the WLLS fitting was used 8.RESULTS
Figure-1a shows an example MK map with abnormally low values. Voxels with abnormally low MK values had low b0 values compared with neighboring voxels. However, these subtle differences were not apparent in the average b0 image (Figure-1b). This can be seen in an example low MK voxel along with its neighbors (Figure-1c). The MK versus b0 signal curve of this example voxel is shown in Figure-1d. We note that all voxels had similarly shaped curves, from which zero-MK and max-MK b0 values were extracted. The detected abnormal voxels using these features are presented in Figure-1e, visually coinciding with the apparent low values.
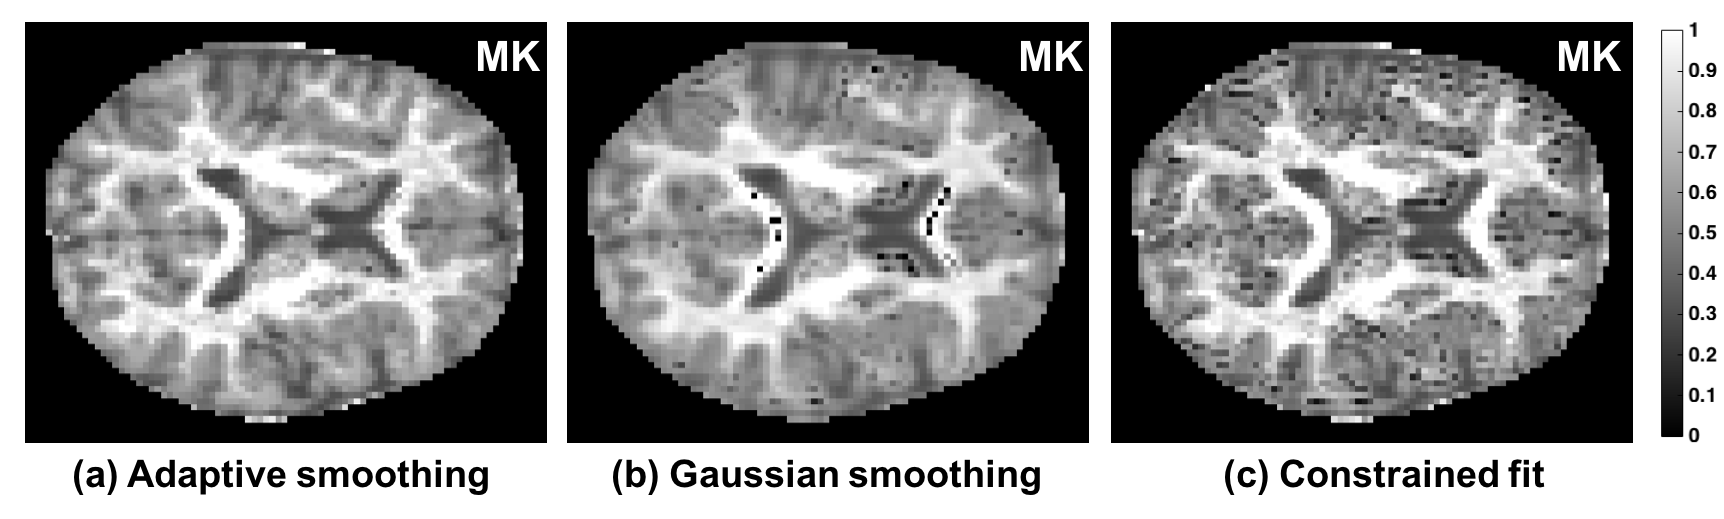
Following the application of our proposed adaptive smoothing (Figure-2a) there were no longer apparent low MK voxels. In comparison, Gaussian smoothing (Figure-2b), fixed most but not all low MK voxels. Constrained fit (Figure-2c) increased the MK values, however they were still abnormally low.
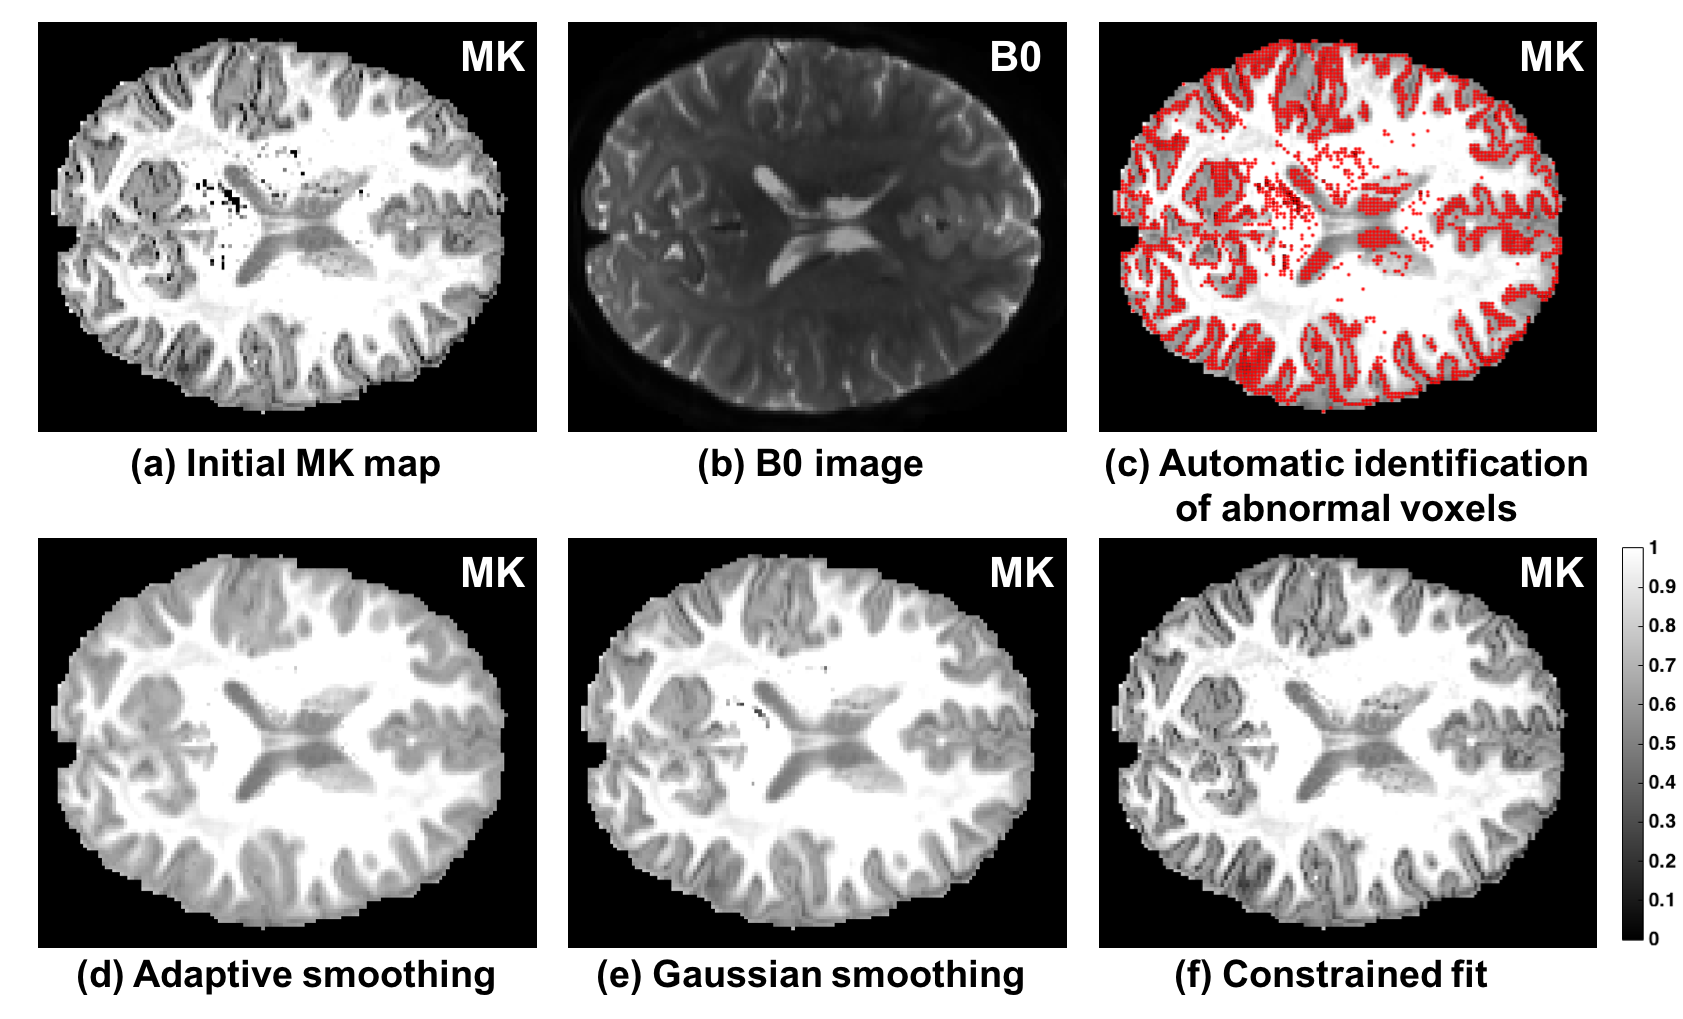
In the high quality HCP data (Figure-3) we see fewer abnormal voxels in deep white matter, but the entire gray/white matter interface is now identified as abnormal (Figure-3c). Following the adaptive smoothing correction these abnormalities are no longer apparent, whereas some voxels still appear low following Gaussian smoothing, and most gray/white matter interface is still apparently low following the constrained approach (Figures-3d to -3f).
DISCUSSION
Noise in any diffusion weighted image may cause abnormally low MK, however our results suggest that modifying the b0 is sufficient to resolve these abnormalities. The MK versus b0 curve provides accurate automatic and threshold free detection of abnormal voxels. Most abnormalities are on tissue interfaces, suggesting partial volume effects. We show that modifying the b0 in affected voxels is better than smoothing the entire data and corrects most low values. Analytic identification of max-MK may speed up the identification, as well as provide a potentially meaningful novel image contrast.CONCLUSION
We demonstrate a clear relation between b0 signal and abnormally low MK. Our proposed detection method and adaptive b0 smoothing are successful in correcting abnormally low MK values, which is important for improved DKI parameter estimation.Acknowledgements
NIH R01MH108574; NIH R01MH085953; NIH P41EB015902; NIH U01CA199459References
1. Jensen, J. H., Helpern, J. A., Ramani, A., Lu, H. & Kaczynski, K. Diffusional kurtosis imaging: the quantification of non-gaussian water diffusion by means of magnetic resonance imaging. Magn. Reson. Med. 53, 1432–1440 (2005).
2. Basser, P. J., Mattiello, J. & LeBihan, D. MR diffusion tensor spectroscopy and imaging. Biophys. J. 66, 259–267 (1994).
3. Cheung, M. M. et al. Does diffusion kurtosis imaging lead to better neural tissue characterization? A rodent brain maturation study. Neuroimage 45, 386–392 (2009).
4. Steven, A. J., Zhuo, J. & Melhem, E. R. Diffusion kurtosis imaging: an emerging technique for evaluating the microstructural environment of the brain. AJR Am. J. Roentgenol. 202, W26–33 (2014).
5. Tabesh, A., Jensen, J. H., Ardekani, B. A. & Helpern, J. A. Estimation of tensors and tensor-derived measures in diffusional kurtosis imaging. Magn. Reson. Med. 65, 823–836 (2011).
6. Shaw, C. B. & Jensen, J. H. Recent Computational Advances in Denoising for Magnetic Resonance Diffusional Kurtosis Imaging (DKI). J. Indian Inst. Sci. 1–14 (2017).
7. Human Connectome Project. Available at: https://www.humanconnectome.org/.
8. Veraart, J., Sijbers, J., Sunaert, S., Leemans, A. & Jeurissen, B. Weighted linear least squares estimation of diffusion MRI parameters: strengths, limitations, and pitfalls. Neuroimage 81, 335–346 (2013).
9. Reconstruction of the diffusion signal with the kurtosis tensor model. Available at: http://nipy.org/dipy/examples_built/reconst_dki.html.
10. NYU-DiffusionMRI/Diffusion-Kurtosis-Imaging. Available at: https://github.com/NYU-DiffusionMRI/Diffusion-Kurtosis-Imaging.
Figures