Ying Zhao1, Ailian Liu1, Lihua Chen1, Lizhi Xie2, and Ye Li1
1Department of Radiology, The First Affiliated Hospital of Dalian Medical University, Dalian, China, 2MR Research, GE Healthcare, Beijing, China
Synopsis
Diffusion tensor imaging (DTI) is an imaging modality that detects the microstructural and pathological changes of organisms according to the diffusive characteristics of water molecules in the tissues. MR histogram analysis reflects the tumor heterogeneity. In the current study, histogram analysis of DTI was demonstrated to be capable to differentiate mass-forming cholangiocarcinoma and solitary hypovascular hepatic metastases, which can provide quantitative information for further clinical diagnosis.
Purpose
To investigate the application of whole-tumor histogram analysis of apparent diffusion coefficient(ADC) and fractional anisotropy(FA) signal intensity derived from diffusion tensor imaging(DTI) in differentiating mass-forming cholangiocarcinoma(IMCC) and solitary hypovascular hepatic metastases(SHHM) on 1.5T MR system.
Introduction
Intrahepatic cholangiocarcinoma is the second most common primary liver tumor, meanwhile, liver is one of the most predilection sites of metastases. The differentiation between IMCC and SHHM represents a diagnostic challenge due to many overlapping MRI features
[1], especially for lacking of typical signs such as intrahepatic duct dilatation and hepatic capsular retraction. It is of significance to differentiate these two types of lesions because the carcinoma and metastases require different treatments. The recently developed DTI is a functional magnetic resonance imaging tool, which can non-invasively and quantitatively probe microstructural and pathological changes of organisms by using ADC and FA measurements. Routine ADC and FA measurements provide restricted information on mean values, which do not account for the underlying spatial distribution. On the other hand, MR histogram analysis can quantify the distribution of signal intensity of voxels within the tumor to reflect tumor heterogeneity. Moreover, three-dimension Regions of interest(ROI) set across the entire lesion can lead to a more accurate diagnosis
[2]. Therefore, whole-tumor histogram analysis of DTI was introduced in the present study to evaluate its clinical application performance on differentiating IMCC and SHHM.
Material and Methods
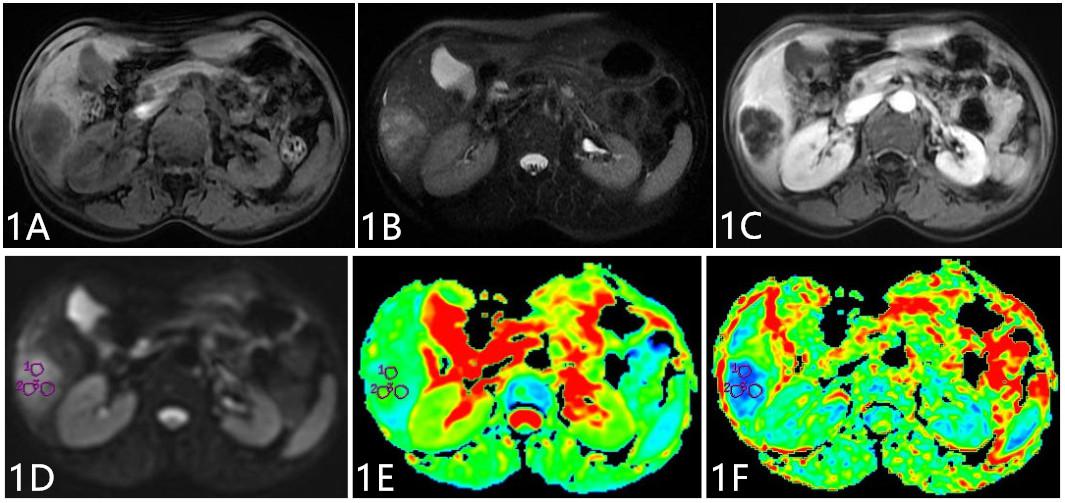
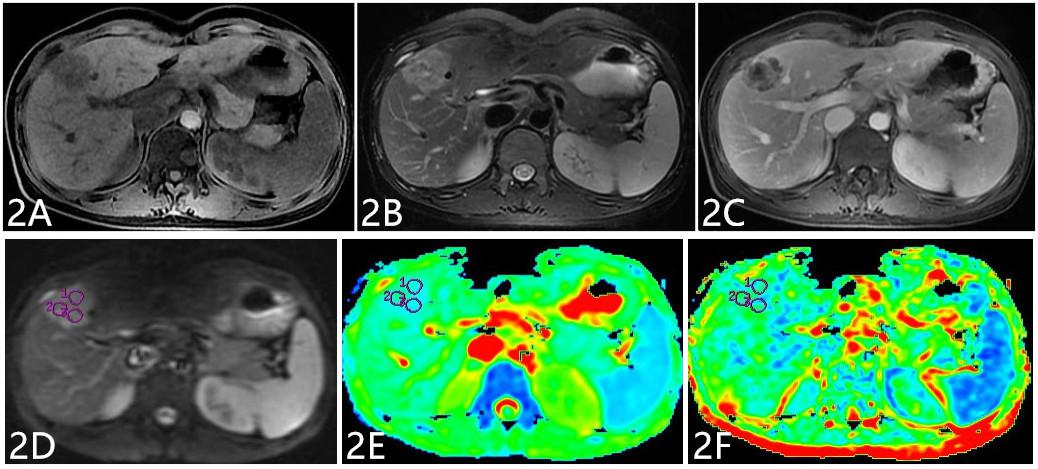
Twenty-four IMCCs and Twenty-nine SHHMs patients were enrolled in this retrospective study, IMCCs were pathologically confirmed, and SHHMs were confirmed by clinical history and follow-up imaging. All subjects underwent examinations on a 1.5T MR system(GE Signa HDXT) with routine scanning(T
1WI, T
2WI, and dynamic contrast-enhanced MR imaging) sequence and additional DTI sequence (b value=0, 600(s/mm
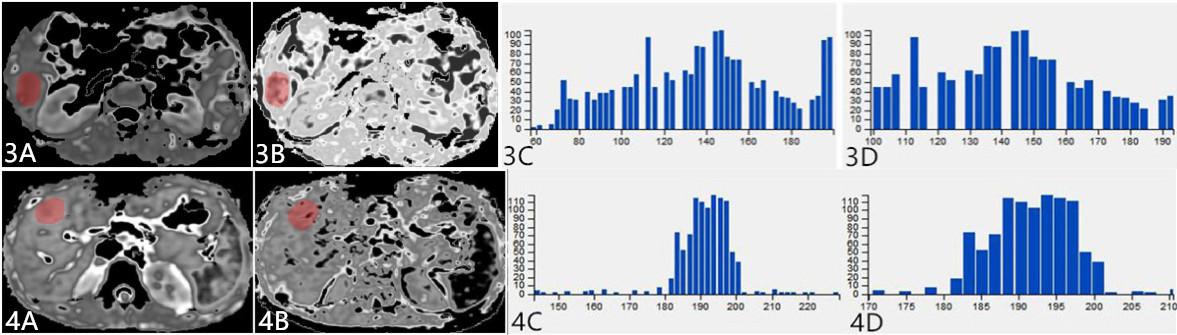
2), in 6 directions, NEX=2). ADC and FA maps were derived using Functool software on GE AW4.6 workstation, where ADC and FA values were measured. ADC and FA maps were transferred to Omni-Kinetics software (GE Healthcare), and ROIs covering the entire tumor were drawn on each slice of ADC and FA signal intensity maps. Histogram related parameters based on ADC and FA signal intensity, including min intensity, max intensity, mean value, the 10th, 25th, 50th, 75th and 90th percentiles, standard deviation, mean deviation, relative deviation, skewness, and kurtosis, were generated automatically after 3D ROIs covering the whole tumor were sketched by the readers. Data analyses were performed using SPSS17.0 statistical software. Inter-group difference was investigated for routine ADC and FA value using independent sample
t test, and
Mann-Whitney U test was used for investigating ADC and FA histogram parameters. Receiver operating characteristic(ROC) curves were plotted to analyze diagnostic efficiency.
Results
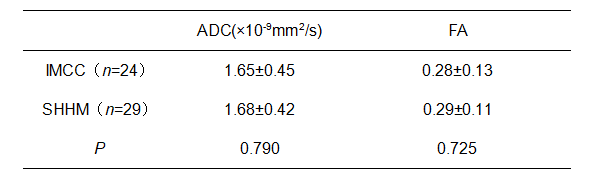
The routine ADC and FA values between IMCC and SHHM groups were not statistically different(
P>0.05,
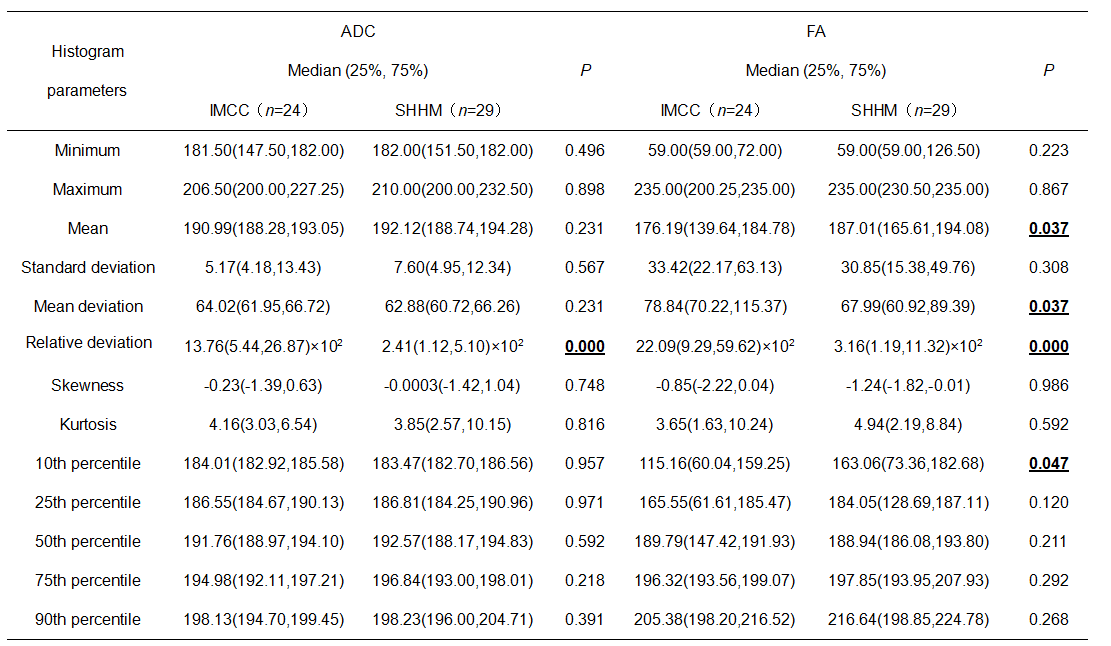
Table 1). There was a significant difference in relative deviation of ADC signal intensity between the IMCC (13.76(5.44,26.87)×10
2) and SHHM (2.41(1.12,5.10)×10
2) groups (
P<0.05,
Table 2). Moreover, a significant difference was observed in mean deviation and relative deviation of FA signal intensity between the IMCC (78.84(70.22,115.37) and 22.09(9.29,59.62)×10
2) group and SHHM (67.99(60.92,89.39) and 3.16(1.19,11.32)×10
2) group (
P<0.05,
Table 2). The mean value and 10th percentile of FA signal intensity between the two groups were statistically different(
P<0.05,
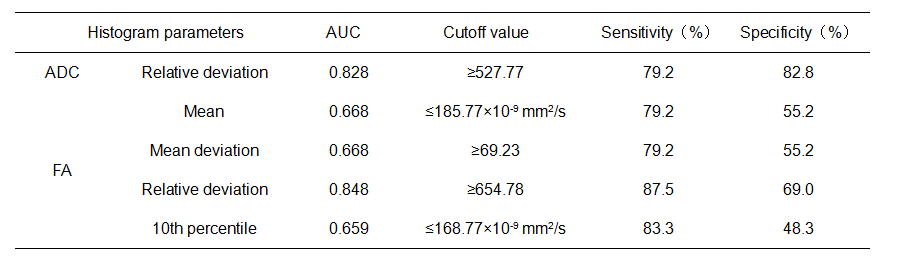
Table 2). The remaining parameters were not statistically different between two groups. The area under ROC curve of relative deviation of ADC and FA signal intensity were 0.828 and 0.848, respectively. The sensitivity/specifcity of ADC and FA were 79.2%(82.8%) and 87.5%(69.0%), respectively(
Table 3).
Discussion
Mean deviation is defined as average of the distances of each image value away from the mean of all values in ROI. Relative deviation refers to the mean deviation divided by the mean, which evaluates the degree of dispersion in a more sensitive way. The higher the relative deviation is, the lower the material homogeneity is, and the more complex the material composition is. The observed higher relative deviation in IMCC group may be due to the heterogeneous composition of IMCC, which contains cancerous cells and many fiber components. The mean value and 10th percentile of FA signal intensity in SHHM group were higher compared to IMCC group. One convincing explanation is that SHHM are poorly differentiated adenocarcinoma and mucinous adenocarcinoma in the current study, which are mainly composed of solid cancer nests and mucus ingredients, thus, this restrains the motions of water molecules in the same direction.
Conclusion
Routine ADC and FA values of DTI are not efficient for identifying IMCC and SHHM. However, whole-tumor histogram analysis method based on ADC and FA signal intensity can provide multiple quantitative parameters for differentiating IMCC and SHHM, and thus, is a more promising method for tumor differentiation in clinic.
Acknowledgements
No acknowledgement found.References
[1]Qian H, Li S, Ji M, et al. MRI characteristics for the differential diagnosis of benign and malignant small solitary hypovascular hepatic nodules. Eur J Gastroenterol Hepatol. 2016, 28(7): 749-56.
[2]Moriya T, Saito K, Tajima Y, et al. 3D analysis of apparent diffusion coefficient histograms in hepatocellular carcinoma: correlation with histological grade. Cancer Imaging, 2017, 17(1): 1.