1587
Diffusion exchange spectroscopic imaging of the spinal cord1Section on Quantitative Imaging and Tissue Sciences, National Institutes of Health, Bethesda, MD, United States, 2Center for Neuroscience and Regenerative Medicine, The Henry M. Jackson Foundation for the Advancement of Military Medicine, Bethesda, MD, United States
Synopsis
Diffusion exchange spectroscopy (DEXSY) is successfully used in conjunction with imaging on the spinal cord, and with excellent prospects for preclinical and clinical applications. DESXY is a model-free approach to measure water migration between and among distinct microenvironments. The time dependency of water migration from the intra- and extracellular microdomains indicates that different regions within gray or white matter exhibit different exchange kinetics, and points to the importance of the spatial scale of this heterogeneity.
Introduction
Water is distributed among multiple microenvironments within heterogeneous biological tissue, and specifically, in brain tissue. In addition to providing local microscopic information, nuclear magnetic resonance (NMR) can be used to probe dynamic migration of water from one domain to another, referred to as molecular exchange.1-3 Such molecular exchange between microenvironments is directly related to cell membrane permeability and active transport processes, which are essential in understanding and assessing cellular functionality and viability. In the brain, water passes across cell membranes, either directly through the lipid bilayers or via channels, such as aquaporins (AQP), whose ability to facilitate water transport is implicated in pathological conditions such as cancer and neuroinflammation.4 Cell membrane permeability and active transport processes in healthy and diseased tissue are only partially understood, and currently cannot be directly measured noninvasively and in vivo, without imposing restricting assumptions.5
Introduced almost 15 years ago, diffusion exchange spectroscopy (DEXSY) is a diffusion-based, model-free approach to measure exchange between and among distinct microenvironments.6 This approach explores the local diffusive dynamics and is therefore able to easily separate between the extra- and intra-cellular components. As opposed to 1D diffusion measurements, DEXSY relies on correlating the successive diffusional motion of molecules along collinear directions, and computing a 2D map that describes these correlations. Despite its great potential, DEXSY has been used in a relatively small number of NMR studies since its introduction,7-8 and in only one MRI study,9 likely because of to the requirements for large amounts of data that leads to exceptionally long scan times. Taking a step towards using DEXSY MRI clinically, here we apply a recently proposed method to vastly reduce the number of required acquisitions.10
Materials and Methods
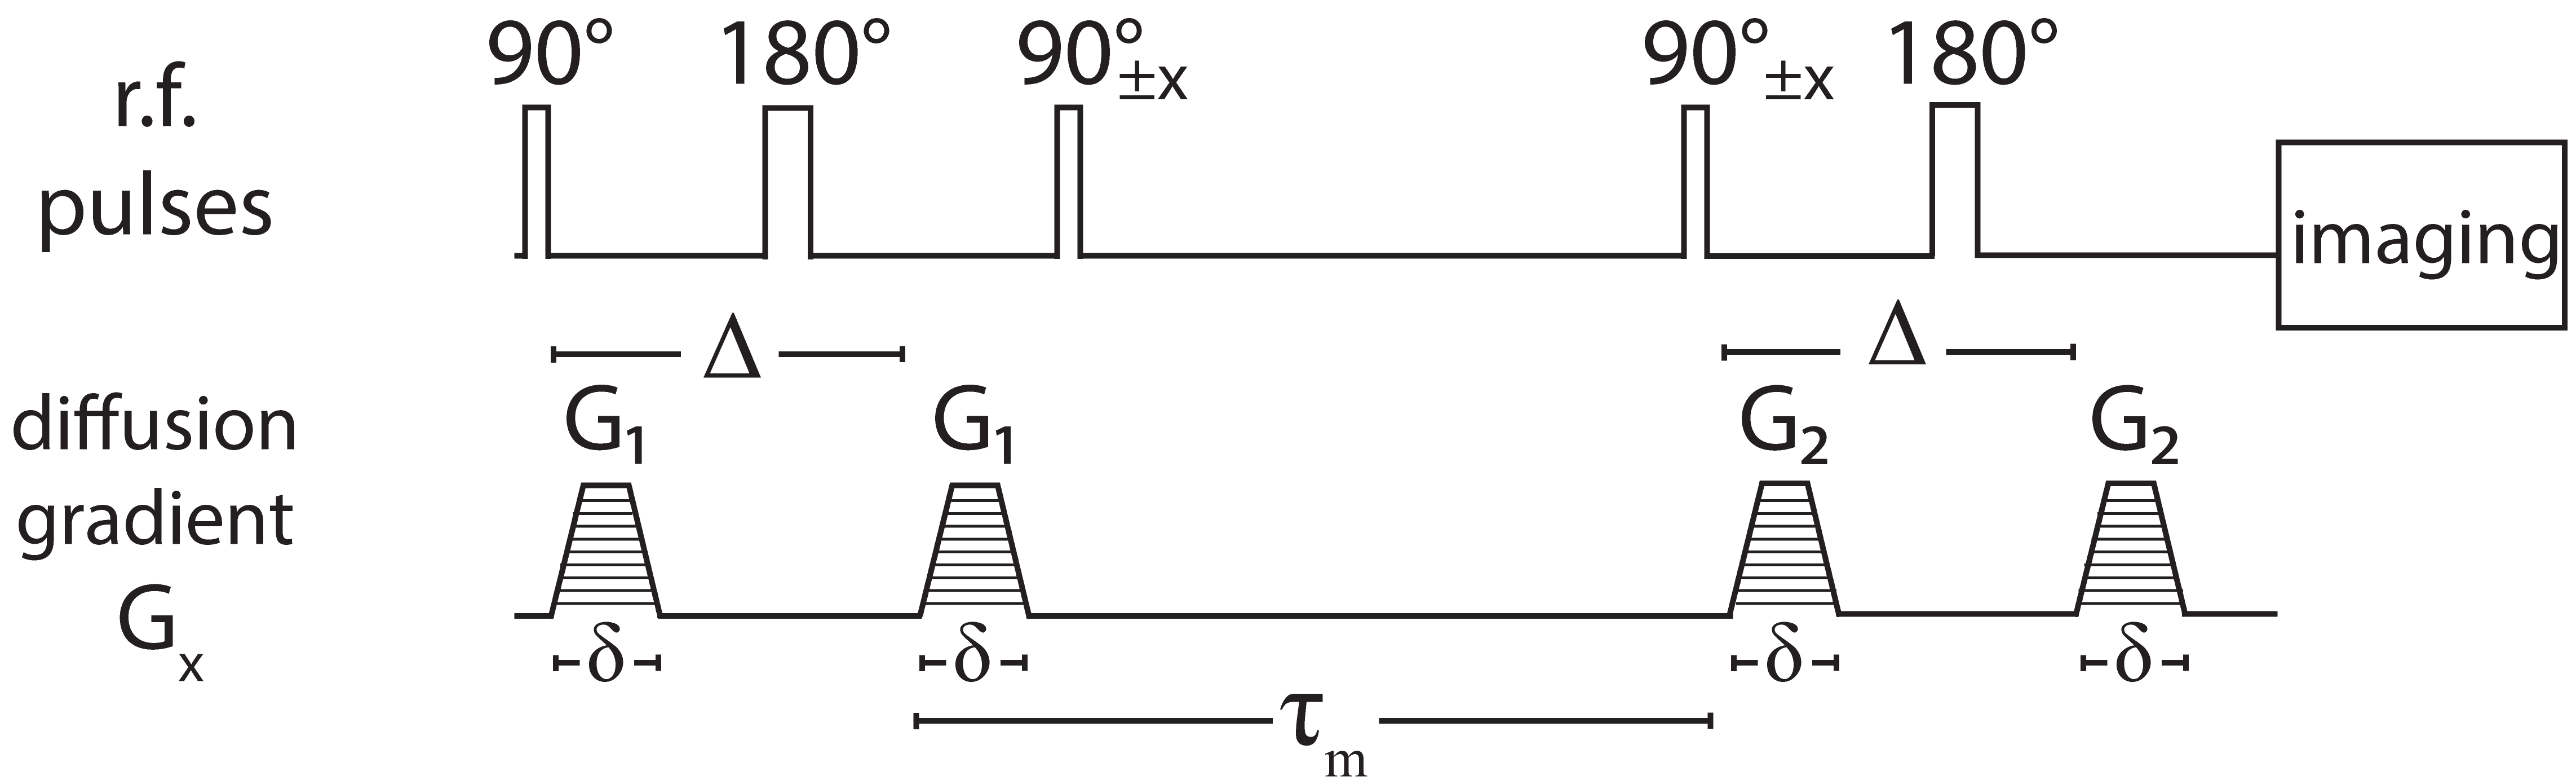
DEXSY MRI was applied on a fixed ferret spinal cord specimen because its microstructure and organization are well known and highly ordered. MRI data were collected on a 7T Bruker wide-bore vertical magnet with an AVANCE III MRI spectrometer equipped with a Micro2.5 microimaging probe and three GREAT60 gradient amplifiers. DEXSY-filtered MRI data were acquired by applying the sequence in Fig. 1 followed by a 2D spin echo MRI sequence, with the diffusion gradients, G1 and G2, applied in the same direction (perpendicular to the spinal cord axis of symmetry). The 1D distributions of diffusivities, D, was first estimated by linearly increasing G2 while keeping G1=0, and with mixing time, τm=10ms, using a total of 20 acquisitions.10 The marginal distribution constrained optimization (MADCO) framework11 was then used with the a priori obtained 1D distribution as constraints to estimate the D-D exchange spectrum, using only 16 additional acquisitions for each of the acquired mixing times: τm=10,30,100,150ms. For all types of acquisitions, TR =4s. A single 2.5mm axial slice with in-plane resolution of 101x101μm2 was acquired.
Results and Discussion
Using the framework described elsewhere,10 diffusion exchange spectra were obtain on a voxelwise basis. An example of such a spectrum from a single white matter (WM) voxel is shown in Fig. 2. One can observe two distinct exchanging microenvironments in this particular voxel: intra- and extracellular, labeled as with the letters I, and E, respectively. The existence of exchange effects is clearly indicated by the presence of off-diagonal peaks in the DEXSY spectrum, whose position and shape give a signature for the underlying dynamics. The volume fraction of water that remains in the intracellular/extracellular domain after the mixing time is III/IEE and the volume that diffuses from one pool to the other and vice versa is IIE/IEI. As the mixing time increases the exchanging water population increases, until the diagonal peak of the extracellular component completely vanishes.
Integrating over the spectral peaks in each of the voxels would result in quantitative images of the exchanging and stationary water populations. Such images are presented in Fig. 3. It is evident that the volume fraction of the exchanging population increases as a function of the mixing time across the spinal cord. Because different regions within gray matter (GM) or WM exhibit different exchange kinetics, the spatial scale of this heterogeneity is likely to be important.
Conclusion
In this demonstration of molecular diffusion exchange spectroscopic MRI on the spinal cord no models were used to determine the number of exchange processes. With the MADCO framework, the images were generated using only 84 diffusion-weighted MRI (DWI) acquisitions (compared to 1024 DWIs using the conventional approach9), which is comparable to the number of DWIs used in standard in vivo diffusion MRI studies.12 Since AQPs' function is only partially understood, studying the water exchange rate across the cell membrane could clarify their role.
Acknowledgements
This work was supported by funds provided by the Intramural Research Program of the Eunice Kennedy Shriver National Institute of Child Health and Human Development (NICHD).References
1. Lee JH, Labadie C, Springer CS, et al. Two-dimensional inverse Laplace transform NMR: altered relaxation times allow detection of exchange correlation. J Am Chem Soc. 1993;115(17):7761–7764.
2. Quirk JD, Bretthorst GL, Duong TQ, et al. Equilibrium water exchange between the intra- and extracellular spaces of mammalian brain. Magn Reson Med. 2003;50(3):493–499.
3. Washburn KE, Callaghan PT. Tracking Pore to Pore Exchange Using Relaxation Exchange Spectroscopy. Phys Rev Lett. 2006;97:175502.
4. Agre P, King LS, Yasui M, et al. Aquaporin water channels - from atomic structure to clinical medicine. J Physiol. 2002;542:3–16.
5. Tofts PS, Kermode AG. Measurement of the blood-brain barrier permeability and leakage space using dynamic MR imaging. 1. Fundamental concepts. Magn Reson Med. 1991;17(2):357–67.
6. Callaghan PT, Furo I. Diffusion-diffusion correlation and exchange as a signature for local order and dynamics. J Chem Phys. 2004;120:4032.
7. Qiao Y, Galvosas P, Adalsteinsson T, et al. Diffusion exchange NMR spectroscopic study of dextran exchange through polyelectrolyte multilayer capsules. J Chem Phys. 2005;122:214912.
8. Hubbard PL, McGrath KM, Callaghan PT. Evolution of a Lamellar Domain Structure for an Equilibrating Lyotropic Liquid Crystal. J Phys Chem B. 2006;110:20781–20788.
9. Siow B, Hubbard PL, d’Esposito A, et al. Diffusion-diffusion Exchange Spectroscopic Imaging (DEXSI) MRI in a rat corpus callosum. In: Proceedings of the 12th International Conference on Magnetic Resonance Microscopy, Cambridge, UK, August 25–29, 2013.
10. Benjamini D, Komlosh ME, Basser PJ. Imaging Local Diffusive Dynamics Using Diffusion Exchange Spectroscopy MRI. Phys Rev Lett. 2017;118(15):158003.
11. Benjamini D, Basser PJ. Use of marginal distributions constrained optimization (MADCO) for accelerated 2D MRI relaxometry and diffusometry. J Magn Reson. 2016;271:40–45.
12. Avram AV, Ozarslan E, Sarlls JE, et al. In vivo detection of microscopic anisotropy using quadruple pulsed-field gradient (qPFG) diffusion MRI on a clinical scanner. Neuroimage. 2013;64:229–239.
Figures

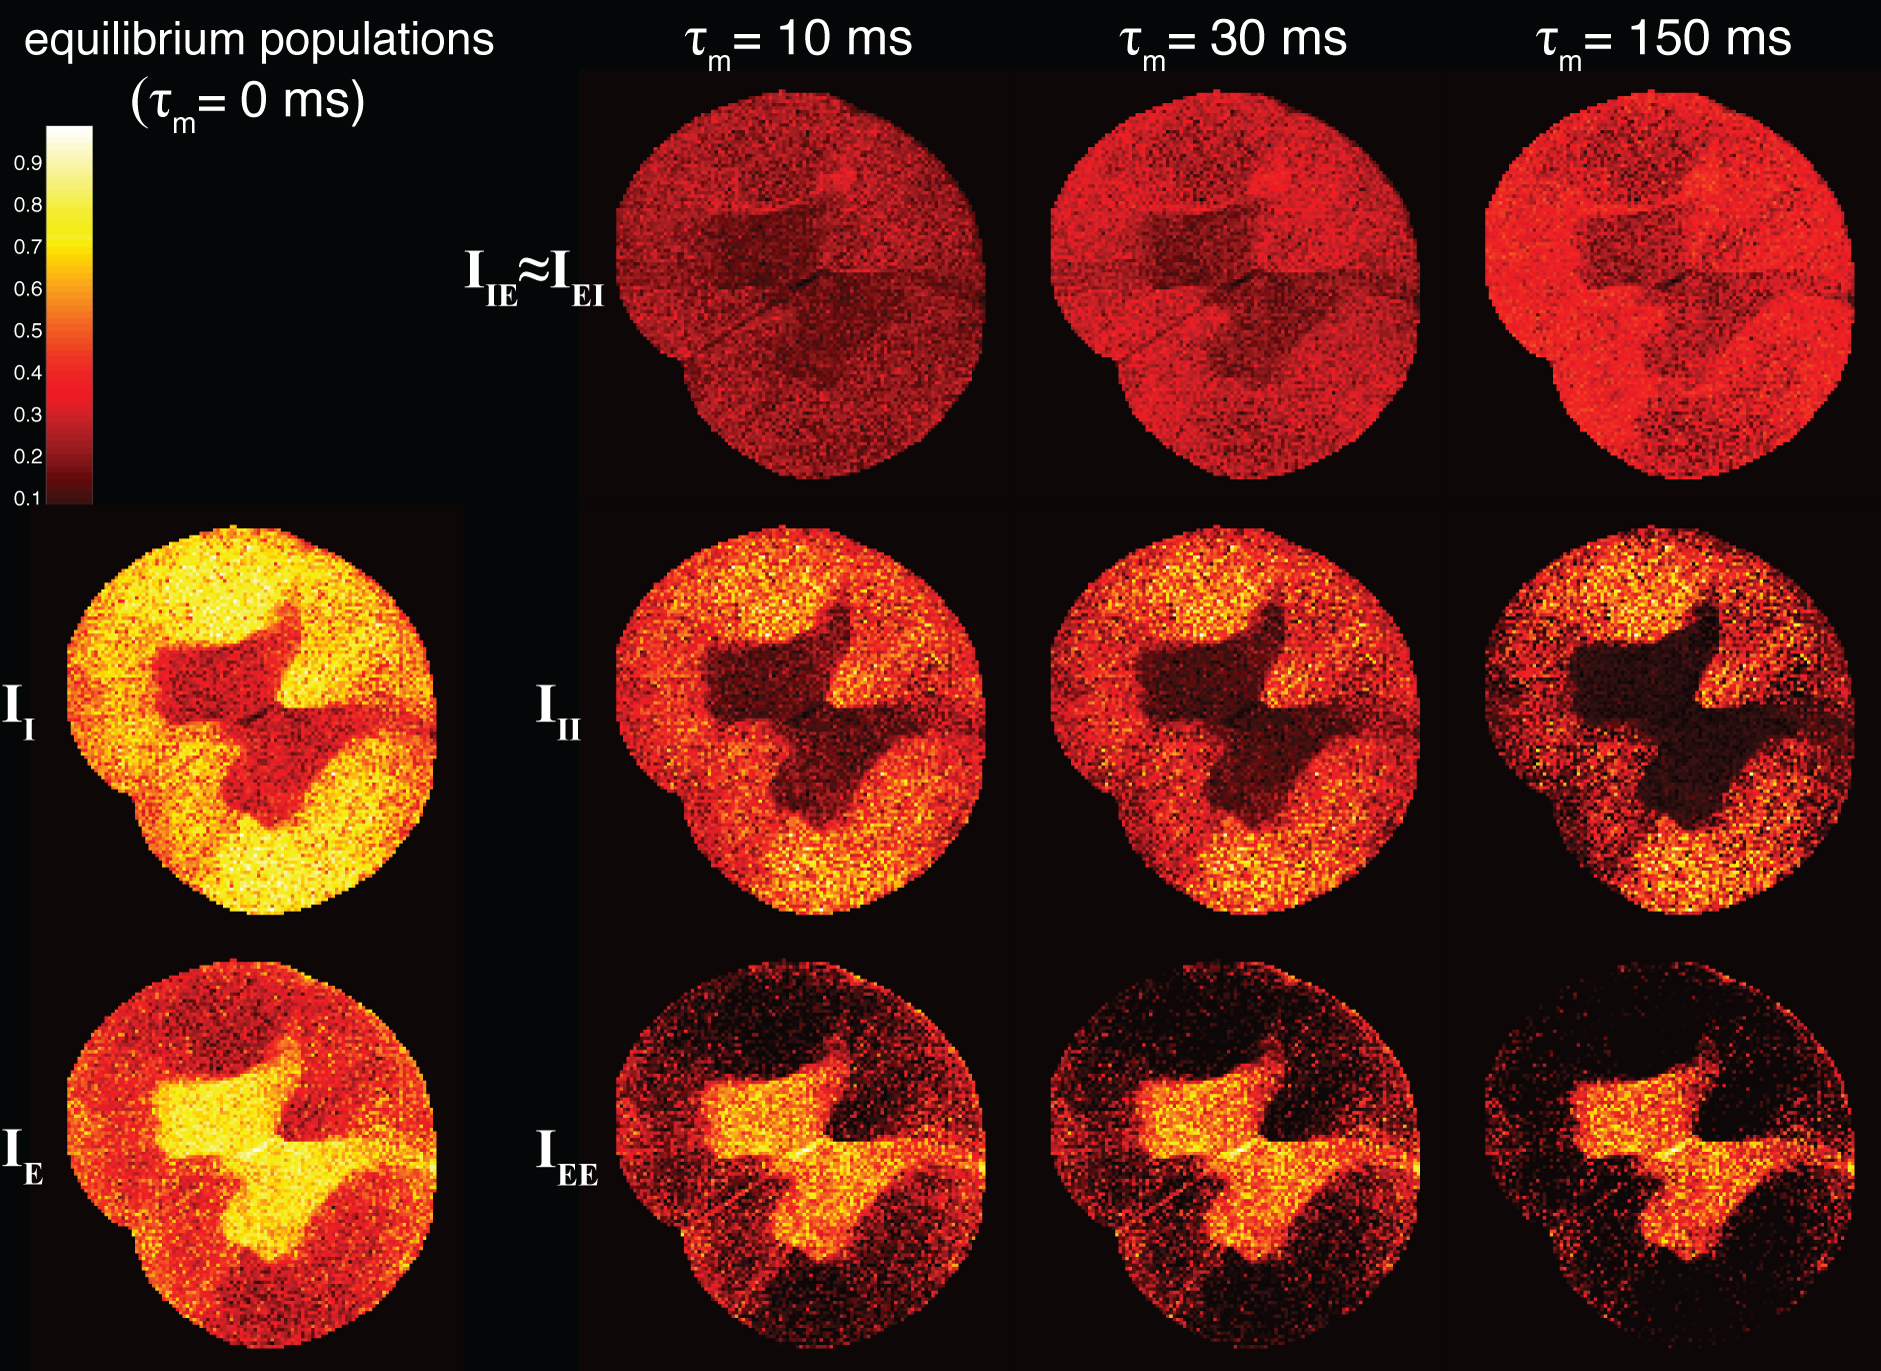
Integrated peaks from the diffusion exchange spectra resolved to images. The left column contains intra- and extracellular equilibrium populations. As the mixing time is increased the off diagonal peak intensities, IIE , which represents the exchanging population, increases as well. Note the non-uniform distribution of exchange rates across the spinal cord. All images have the same intensities scale.