1586
Group Analysis of Healthy Aging Microstructural Integrity Parameters1InBrain Lab, Department of Physics, Faculty of Philosophy, Sciences and Letters of Ribeirão Preto, University of São Paulo, Ribeirão Preto, São Paulo, Brazil, 2Department of Internal Medicine, Ribeirão Preto Medical School, University of São Paulo, Ribeirão Preto, São Paulo, Brazil
Synopsis
The aim of this work is to compare FA and AFD as integrity parameter of white matter between groups of different ages to evaluate which areas of the white matter are affected in its fiber composition in the healthy aging process, and to evaluate if it happens in a global or specific manner. The results show that the largest decreases in FA and AFD occur in the brain of the elderly (over 60 years) due to more advanced axonal degeneration. AFD seems to show complementary information for understanding the white matter integrity alterations throughout the lifespan.
Introduction
The human brain structure undergoes continuous and non-linear changes over the lifespan. Diffusion-weighted MRI (DW-MRI) is capable of mapping the fiber architecture of the brain tissues. Fractional Anisotropy (FA) characterize the diffusion of water molecules within a voxel, related to the microstructural integrity of the white matter. Tract-based analysis has related FA alterations with age, suggesting these as sensitive markers of aging1. Apparent Fiber Density (AFD)2 is a parameter related to the “intra-axonal restricted compartment”, and would be of great interest to be studied in the aging process for the understanding of how the integrity of the fiber bundles changes within the voxel.Objective
The aim of this work is to compare FA and AFD as WM integrity parameters between groups of different ages to evaluate which areas of the WM are affected in the healthy aging process, and to evaluate if it happens in a global or specific manner.Methods
The data was retrospectively collected from Ribeirão Preto University Hospital. Image data consists of Diffusion and T1-weighted images, from 158 healthy individuals, acquired in a 3T Philips Achieva MR scanner. Subjects were divided into three groups, based on age: Young Adults (G1): 78 subjects (43 men) aged between 18 and 40 y.o., Middle Adults (G2): 34 subjects (19 men) aged between 41 and 60 y.o. and Old Adults (G3): 46 subjects (15 men) aged between 61 and 83 y.o. Diffusion Images were acquired with b-value of 1000 s/mm2, 32 diffusion directions and one non-DW. DW images were processed using two approaches. In the first, the DW images were pre-processed in the standard procedure in FSL, the FA maps were calculated using the Diffusion Tensor Imaging (DTI) model, the statistical analysis for group comparison, two by two, was done using the tract-based spatial statistics (TBBS v1.22) FSL toolbox, statistical significant (p<0.05) voxels were grouped. In the second approach, de data was processed using MRtrix package3, images were corrected and normalized, the fiber orientation distributions (FOD) were estimated using Constrained Spherical Deconvolution (CSD) modelling, fixel analysis was performed, AFD was estimated and whole-brain fiber tractography was performed. Statistical two-tailed test was performed using connectivity-based fixel enhancement, comparing the groups two by two, for p<0.05.Results
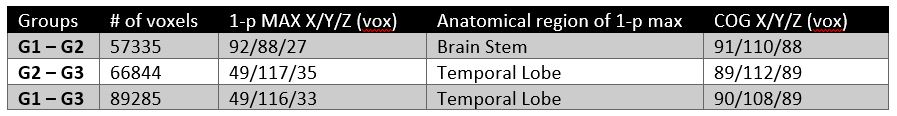
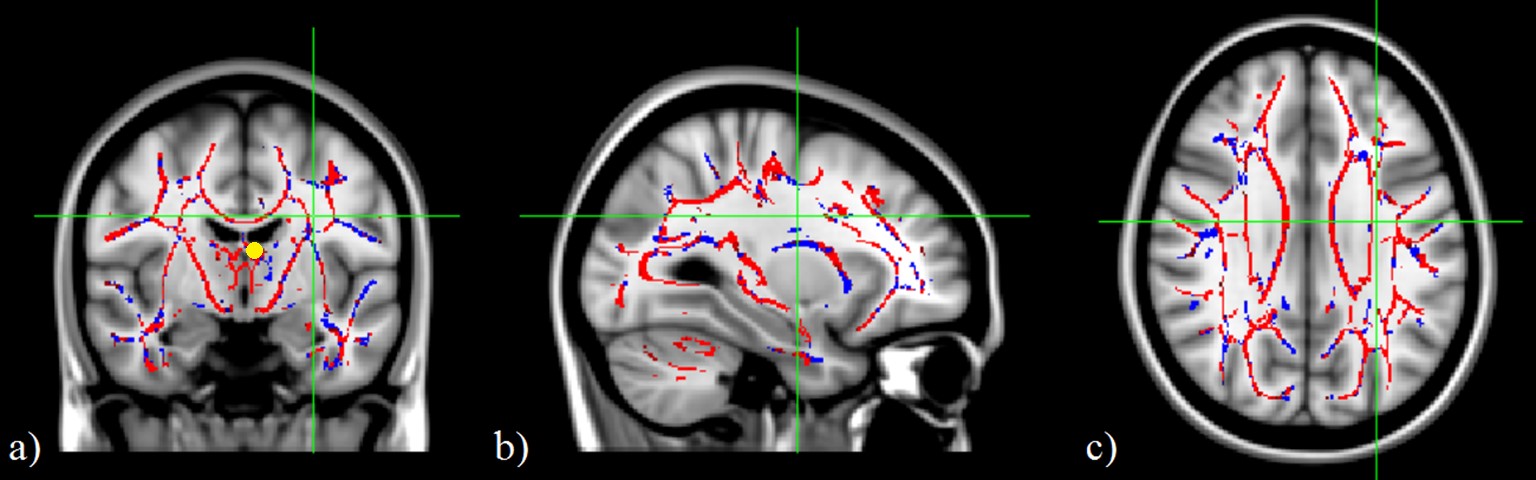
TBSS analysis of the whole brain demonstrated a decrease in FA values with age. In the group comparison, clustering the statistically significant voxels (p< 0.05) more extensive information is included in Table 1 and Figure 1.
There is an increase in the number of significant voxels when analyzing the elderly adults group (G3), suggests neuronal changes underlying the decrease of FA in healthy aging affect the WM microstructure throughout the whole brain, with a more abrupt axonal degradation from the sixth decade4. COG position does not seem to change with age (near fornix tract), suggesting a progressive isotropic pattern of degradation in WM tracts.
Considering JHU ICBMDTI-81 atlas5, FA is significantly decreased in the corpus callosum, upper longitudinal fasciculus, fornix, anterior and superior radiata corona, among others. Uncinate fasciculus presents a non-linear pattern of alteration of FA with age, since this only showed a statistically significant decrease in comparisons with the older group.
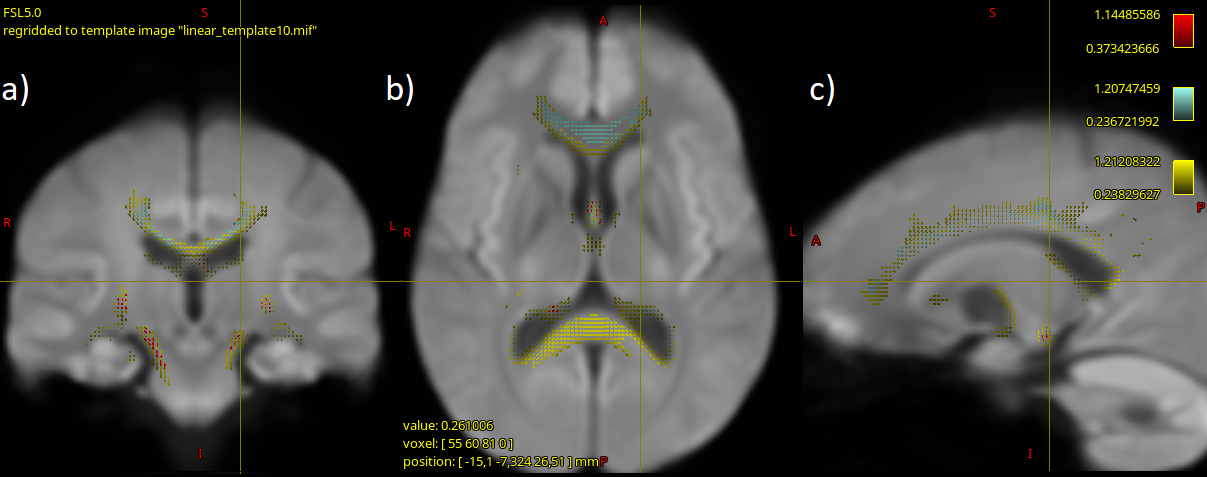
For the ADF analysis, group analysis demonstrated significant (p<0.05) decrease in the AFD parameter with age in some WM regions, Figure 2. Comparing between the younger groups there are very fewer regions with significant alterations, those being the following tracts: fornix, cerebellar peduncle and base of the cortico-spinal tract(CST). While the elderly group shows a broader pattern of degeneration of tracts. Analyzing between G2 and G3, alterations in the corpus callosum, fornix, inferior lateral fasciculus, inferior fronto-occipital fasciculus and anterior thalamic radiation, and between G1 and G3 all of those were affected but also the CST and cerebellar peduncle. Showing that from the 60th decade of age the brain integrity changes occurs more abruptly.
Discussion and Conclusion
Largest decreases in FA occur in the brain of the elderly due to more advanced axonal degeneration4. When comparing the regions of the clusters for the comparisons, there was an evident amplification of the WM regions that are affected in the older subjects, affecting several brain tracts, including the ones responsible for cognitive processes and memory, such as the uncinate fasciculus6. With these results, it is understood that the white matter degeneration, considering the fiber density parameter, occurs in the tract specific way, and some tracts are more affected in different age ranges, the fornix being one of the first tracts to be affected in this natural degeneration process. These results agree with the literature for FA7, and AFD seems to show complementary information for understanding the white matter integrity8 alterations, that haven’t been demonstrated yet in the aging process.Acknowledgements
FAPESP for financial supportReferences
1. BURZYNSKA, A. Z. et al. Age-related differences in white matter microstructure: Region-specific patterns of diffusivity. NeuroImage, v. 49, n. 3, p. 2104–2112, 2010.
2. RAFFELT, D. et al. Apparent Fibre Density: A novel measure for the analysis of diffusion-weighted magnetic resonance images. NeuroImage, v. 59, n. 4, p. 3976–3994, 2012.
3. TOURNIER, J.; CALAMANTE, F.; CONNELLY, A. MRtrix : Diffusion Tractography in Crossing Fiber Regions. 2012.
4. MARNER, L. et al. Marked loss of myelinated nerve fibers in the human brain with age. Journal of Comparative Neurology, v. 462, n. 2, p. 144–152, 2003.
5. HUA, K. et al. Tract probability maps in stereotaxic spaces: Analyses of white matter anatomy and tract-specific quantification. NeuroImage, v. 39, n. 1, p. 336–347, 2008.
6. METZLER-BADDELEY, C. et al. Frontotemporal connections in episodic memory and aging: a diffusion MRI tractography study. The Journal of neuroscience : the official journal of the Society for Neuroscience, v. 31, n. 37, p. 13236–45, 2011.
7. KOCHUNOV, P. et al. Relationship between white matter fractional anisotropy and other indices of cerebral health in normal aging: Tract-based spatial statistics study of aging. NeuroImage, v. 35, n. 2, p. 478–487, 2007.
8. RAFFELT, D. A. et al. Investigating white matter fibre density and morphology using fixel-based analysis. NeuroImage, v. 144, p. 58–73, 2017.
Figures