1584
New analysis and visualization tools AFNI-FATCAT (and implementing other software)1NIMH, NIH, Bethesda, MD, United States, 2NIBIB, NIH, Bethesda, MD, United States, 3Henry M. Jackson Foundation for the Advancement of Military Medicine, Bethesda, MD, United States
Synopsis
The typical size of MRI data sets being processed for a study is rapidly increasing, particularly with the growth of publicly available data sets and “big data” strategies for approaching problems. This produces a dual need in analysis: having scriptable and reproducible pipelines for analysis, as well as having a method for visualizing data both during intermediate steps and for final results presentation. Here, we describe new AFNI-FATCAT tools that provides a succinct set of processing steps for a full DTI analysis pipeline, from DICOM conversion to tractography and statistical anlyses; these tools create QC images and quantitative checks at each step for pipeline evaluation.
Introduction
The typical size of MRI data sets being processed for a study is rapidly increasing, particularly with the growth of publicly available data sets and “big data” strategies for approaching problems. This produces a dual need in analysis: having scriptable and reproducible pipelines for analysis, as well as having a method for visualizing data both during intermediate steps and for final results presentation. Here, we describe new AFNI-FATCAT [1-2] tools that provides a succinct set of processing steps for a full DTI analysis pipeline, from DICOM conversion to tractography and statistical analyses. These tools integrate with other scriptable tools, such as MRIcron-dcm2nii, TORTOISE and FreeSurfer [3-5]. In each step, quality control (QC) images are automatically created and saved, so that users may easily check intermediate steps in a systematic fashion, even across large groups. Additionally, quantitative evaluations such as outlier counts and parameter distributions are also created.Methods and Results
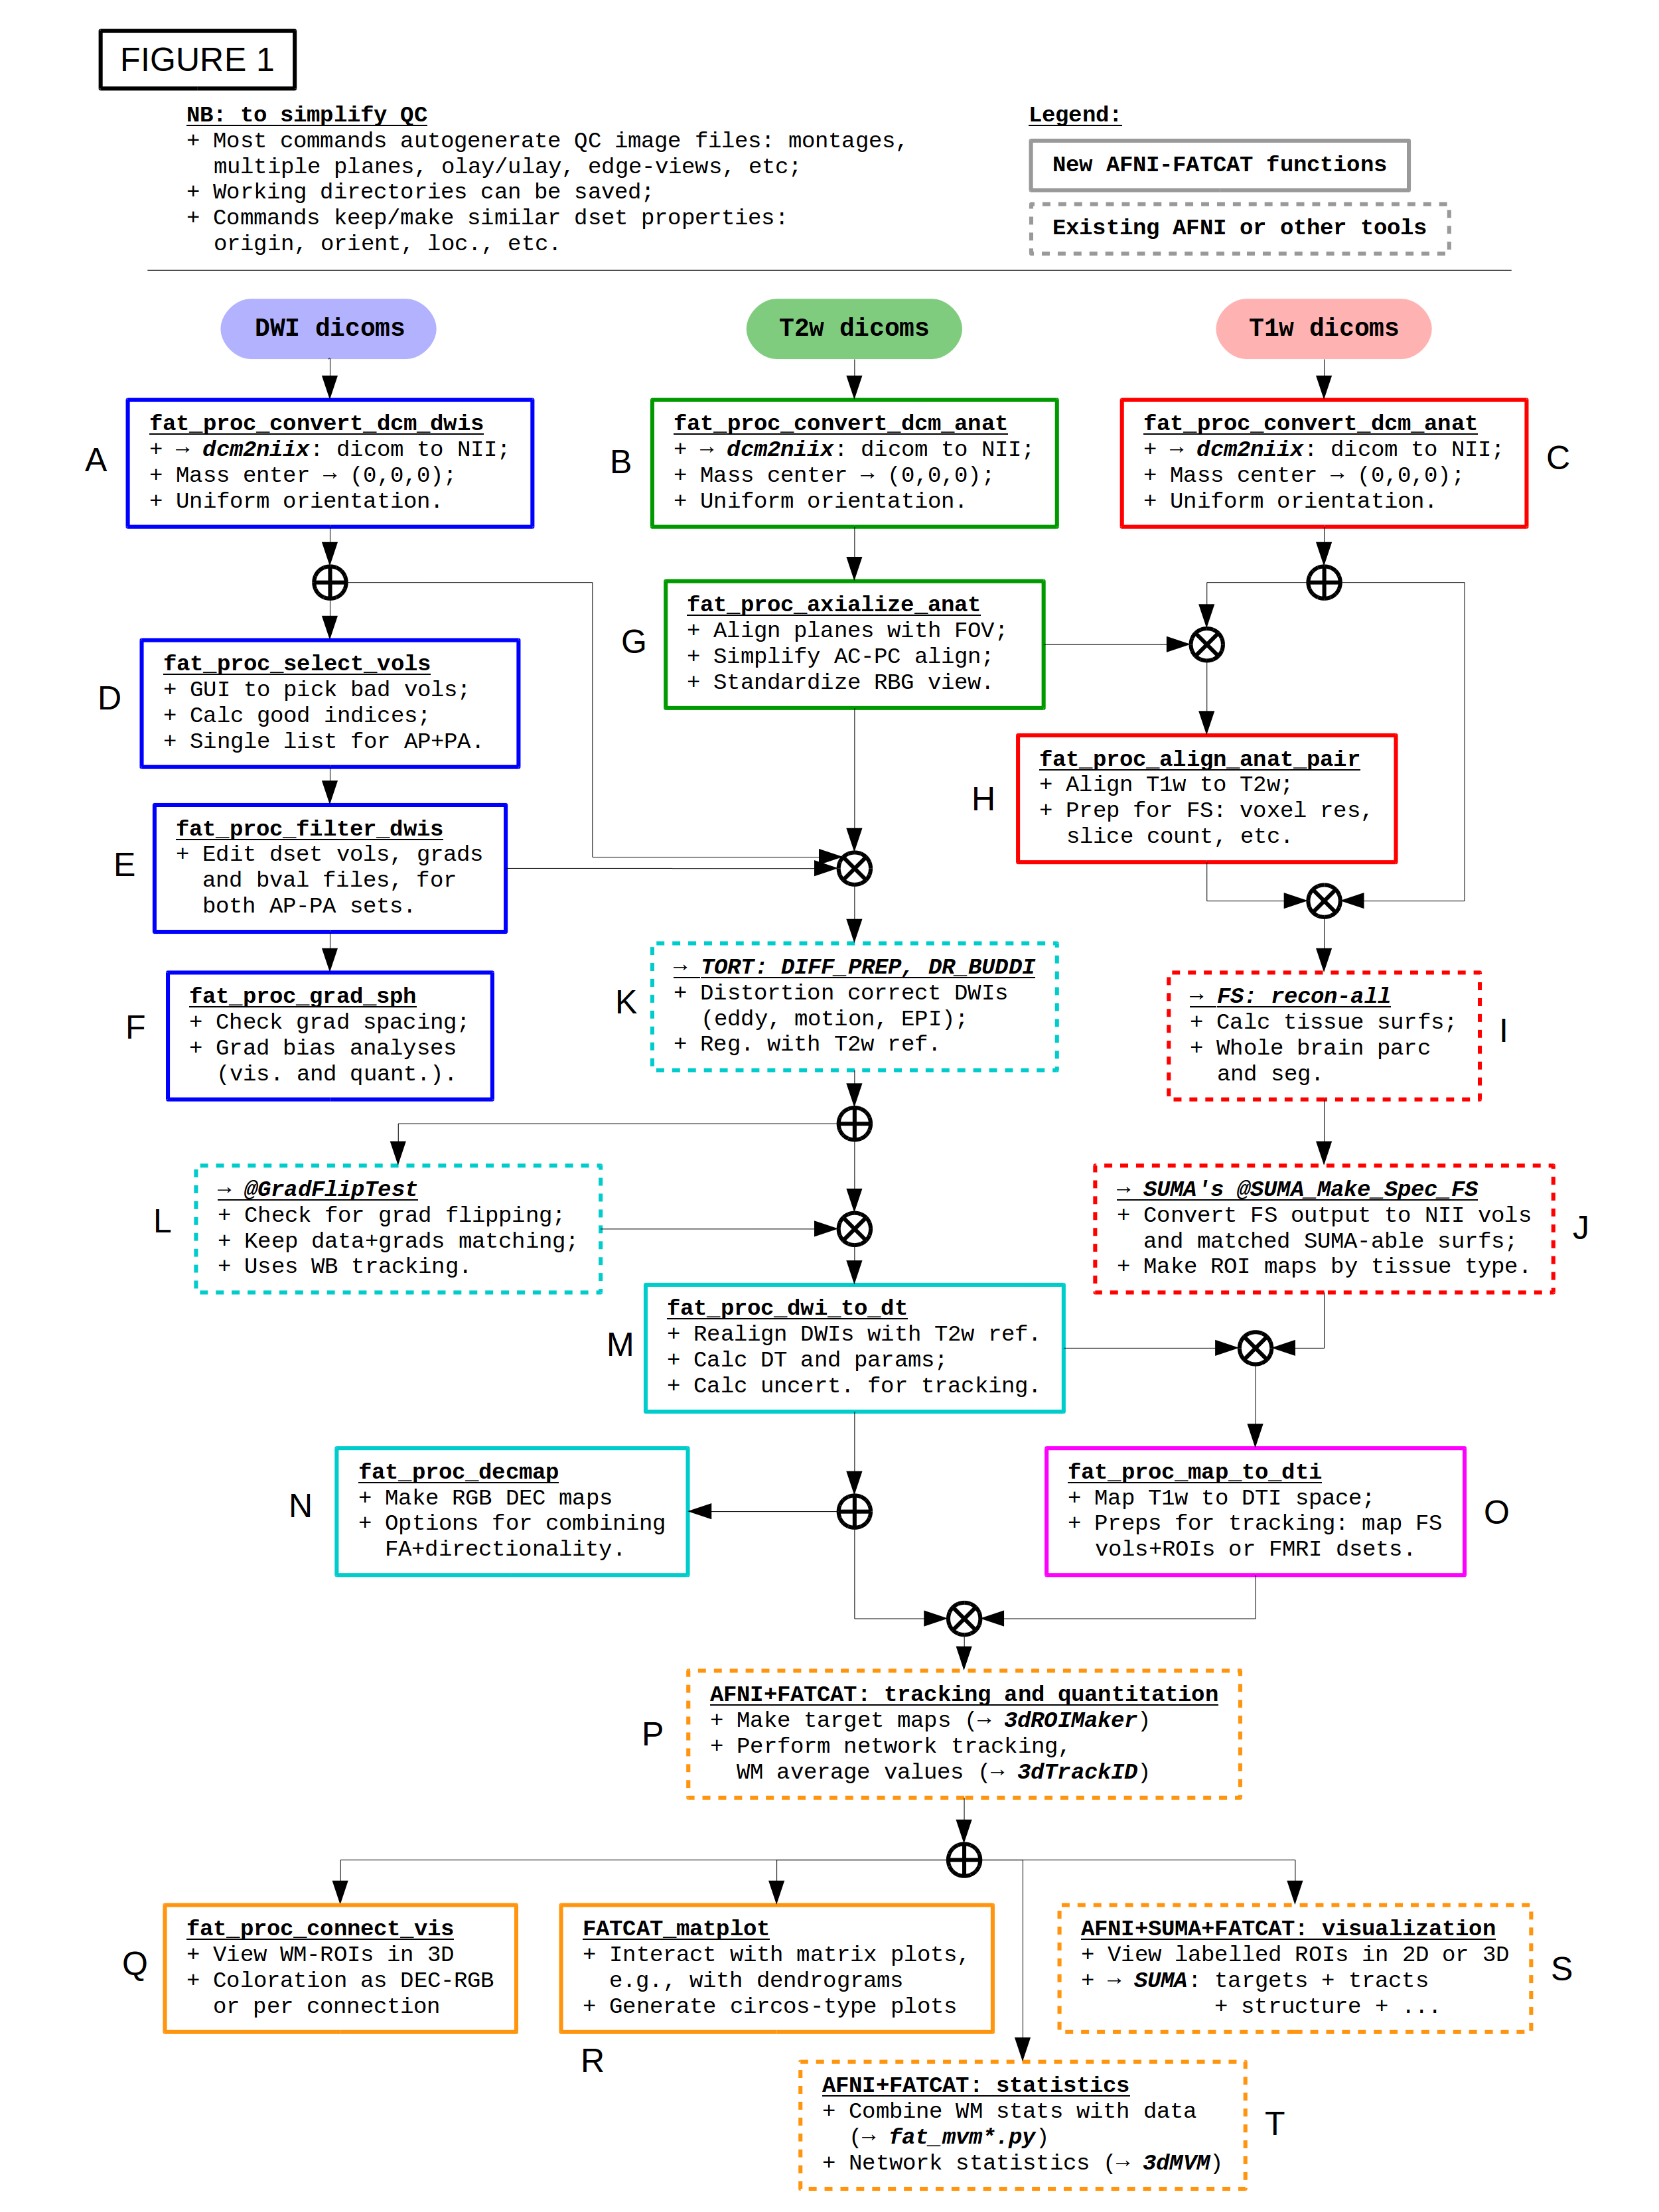
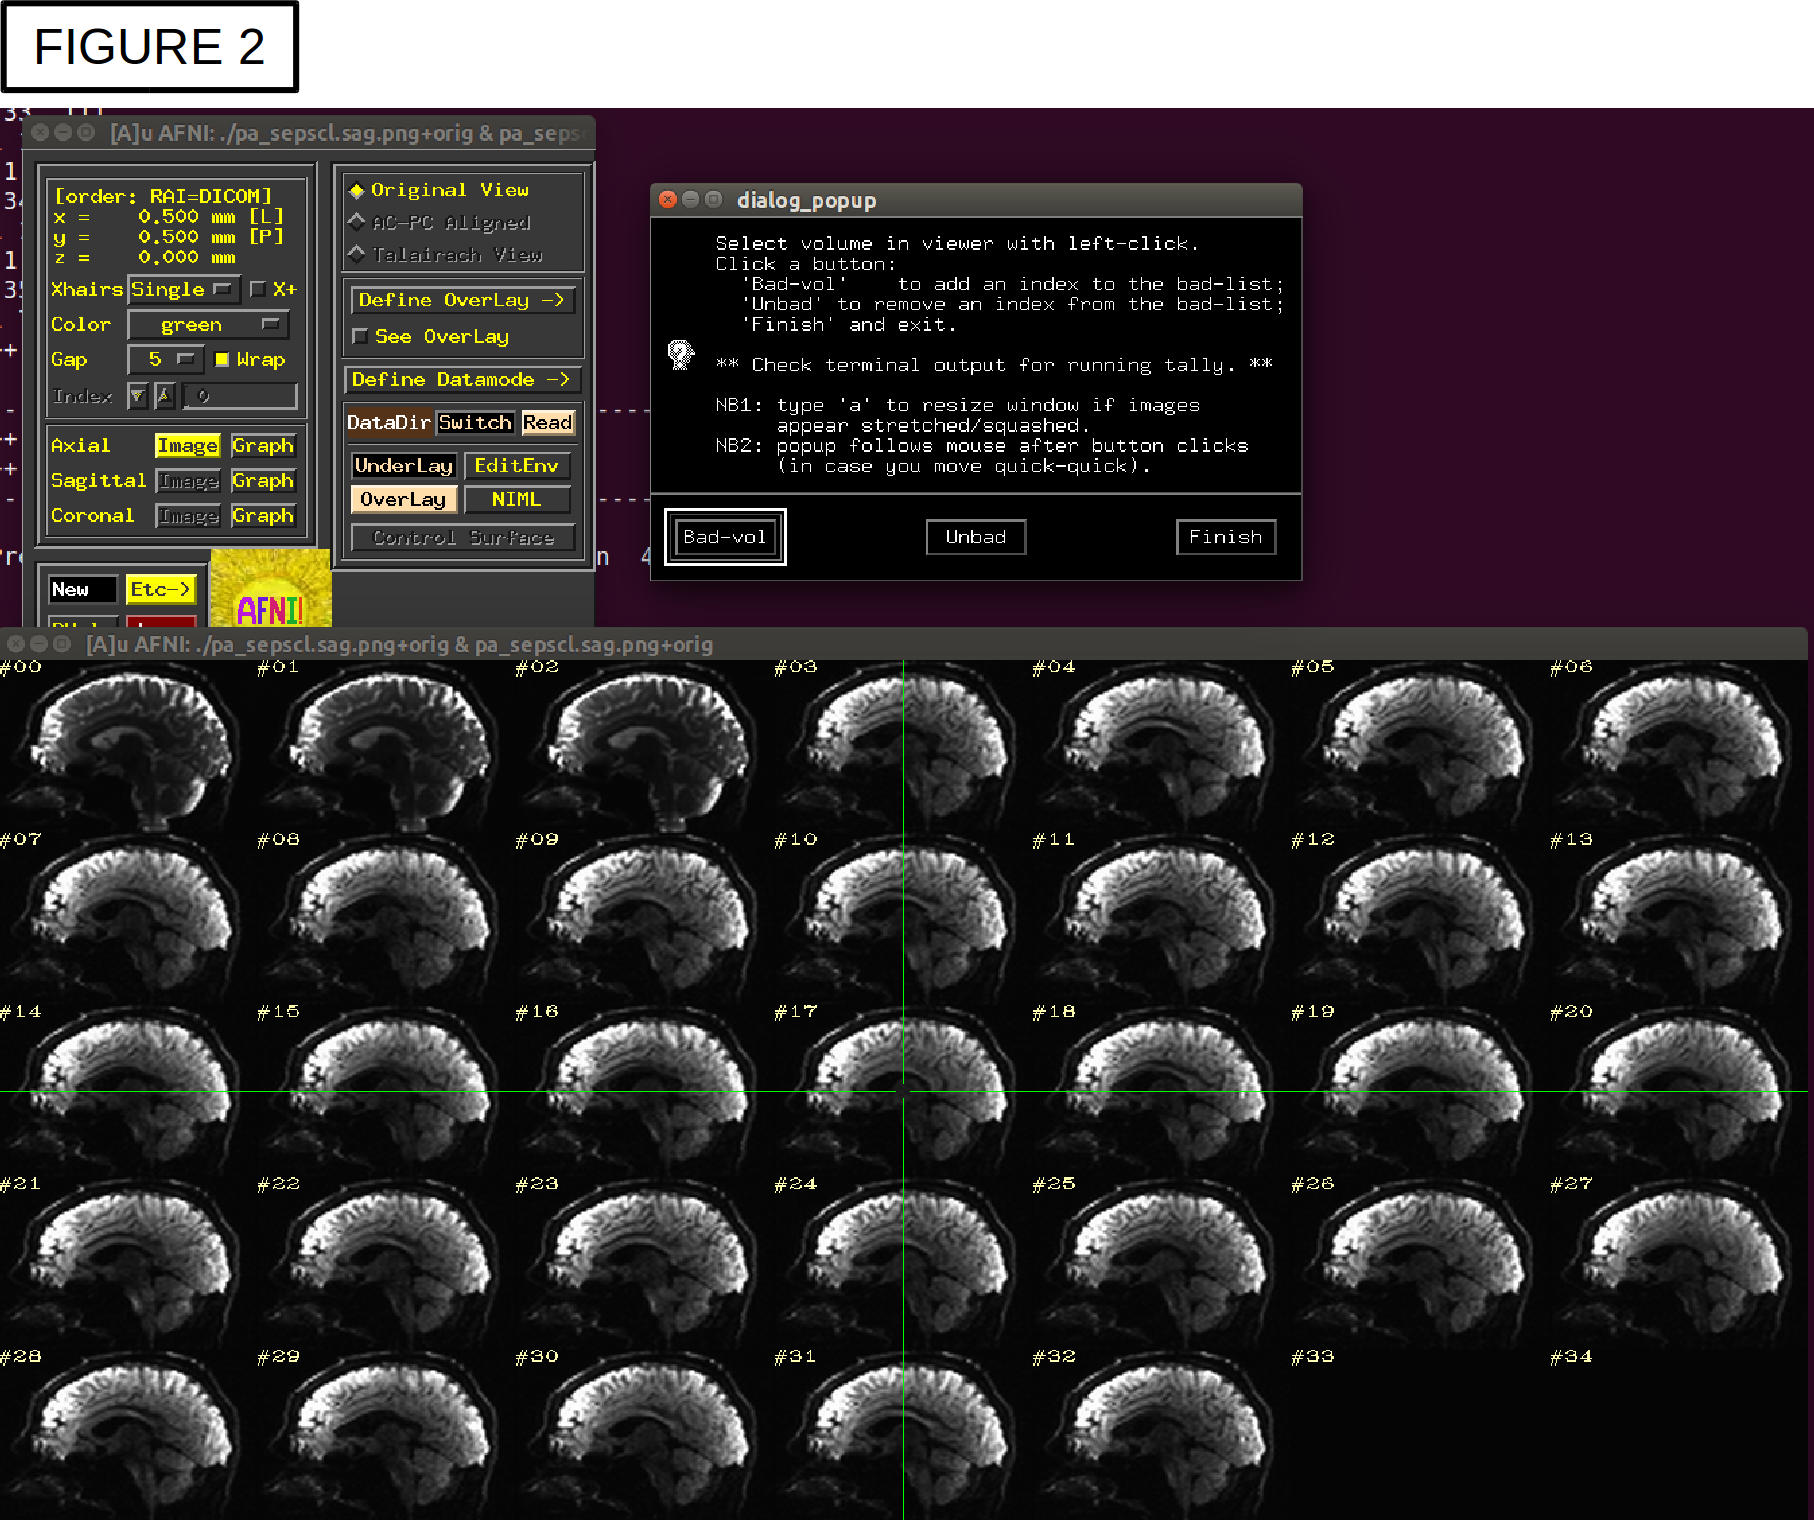
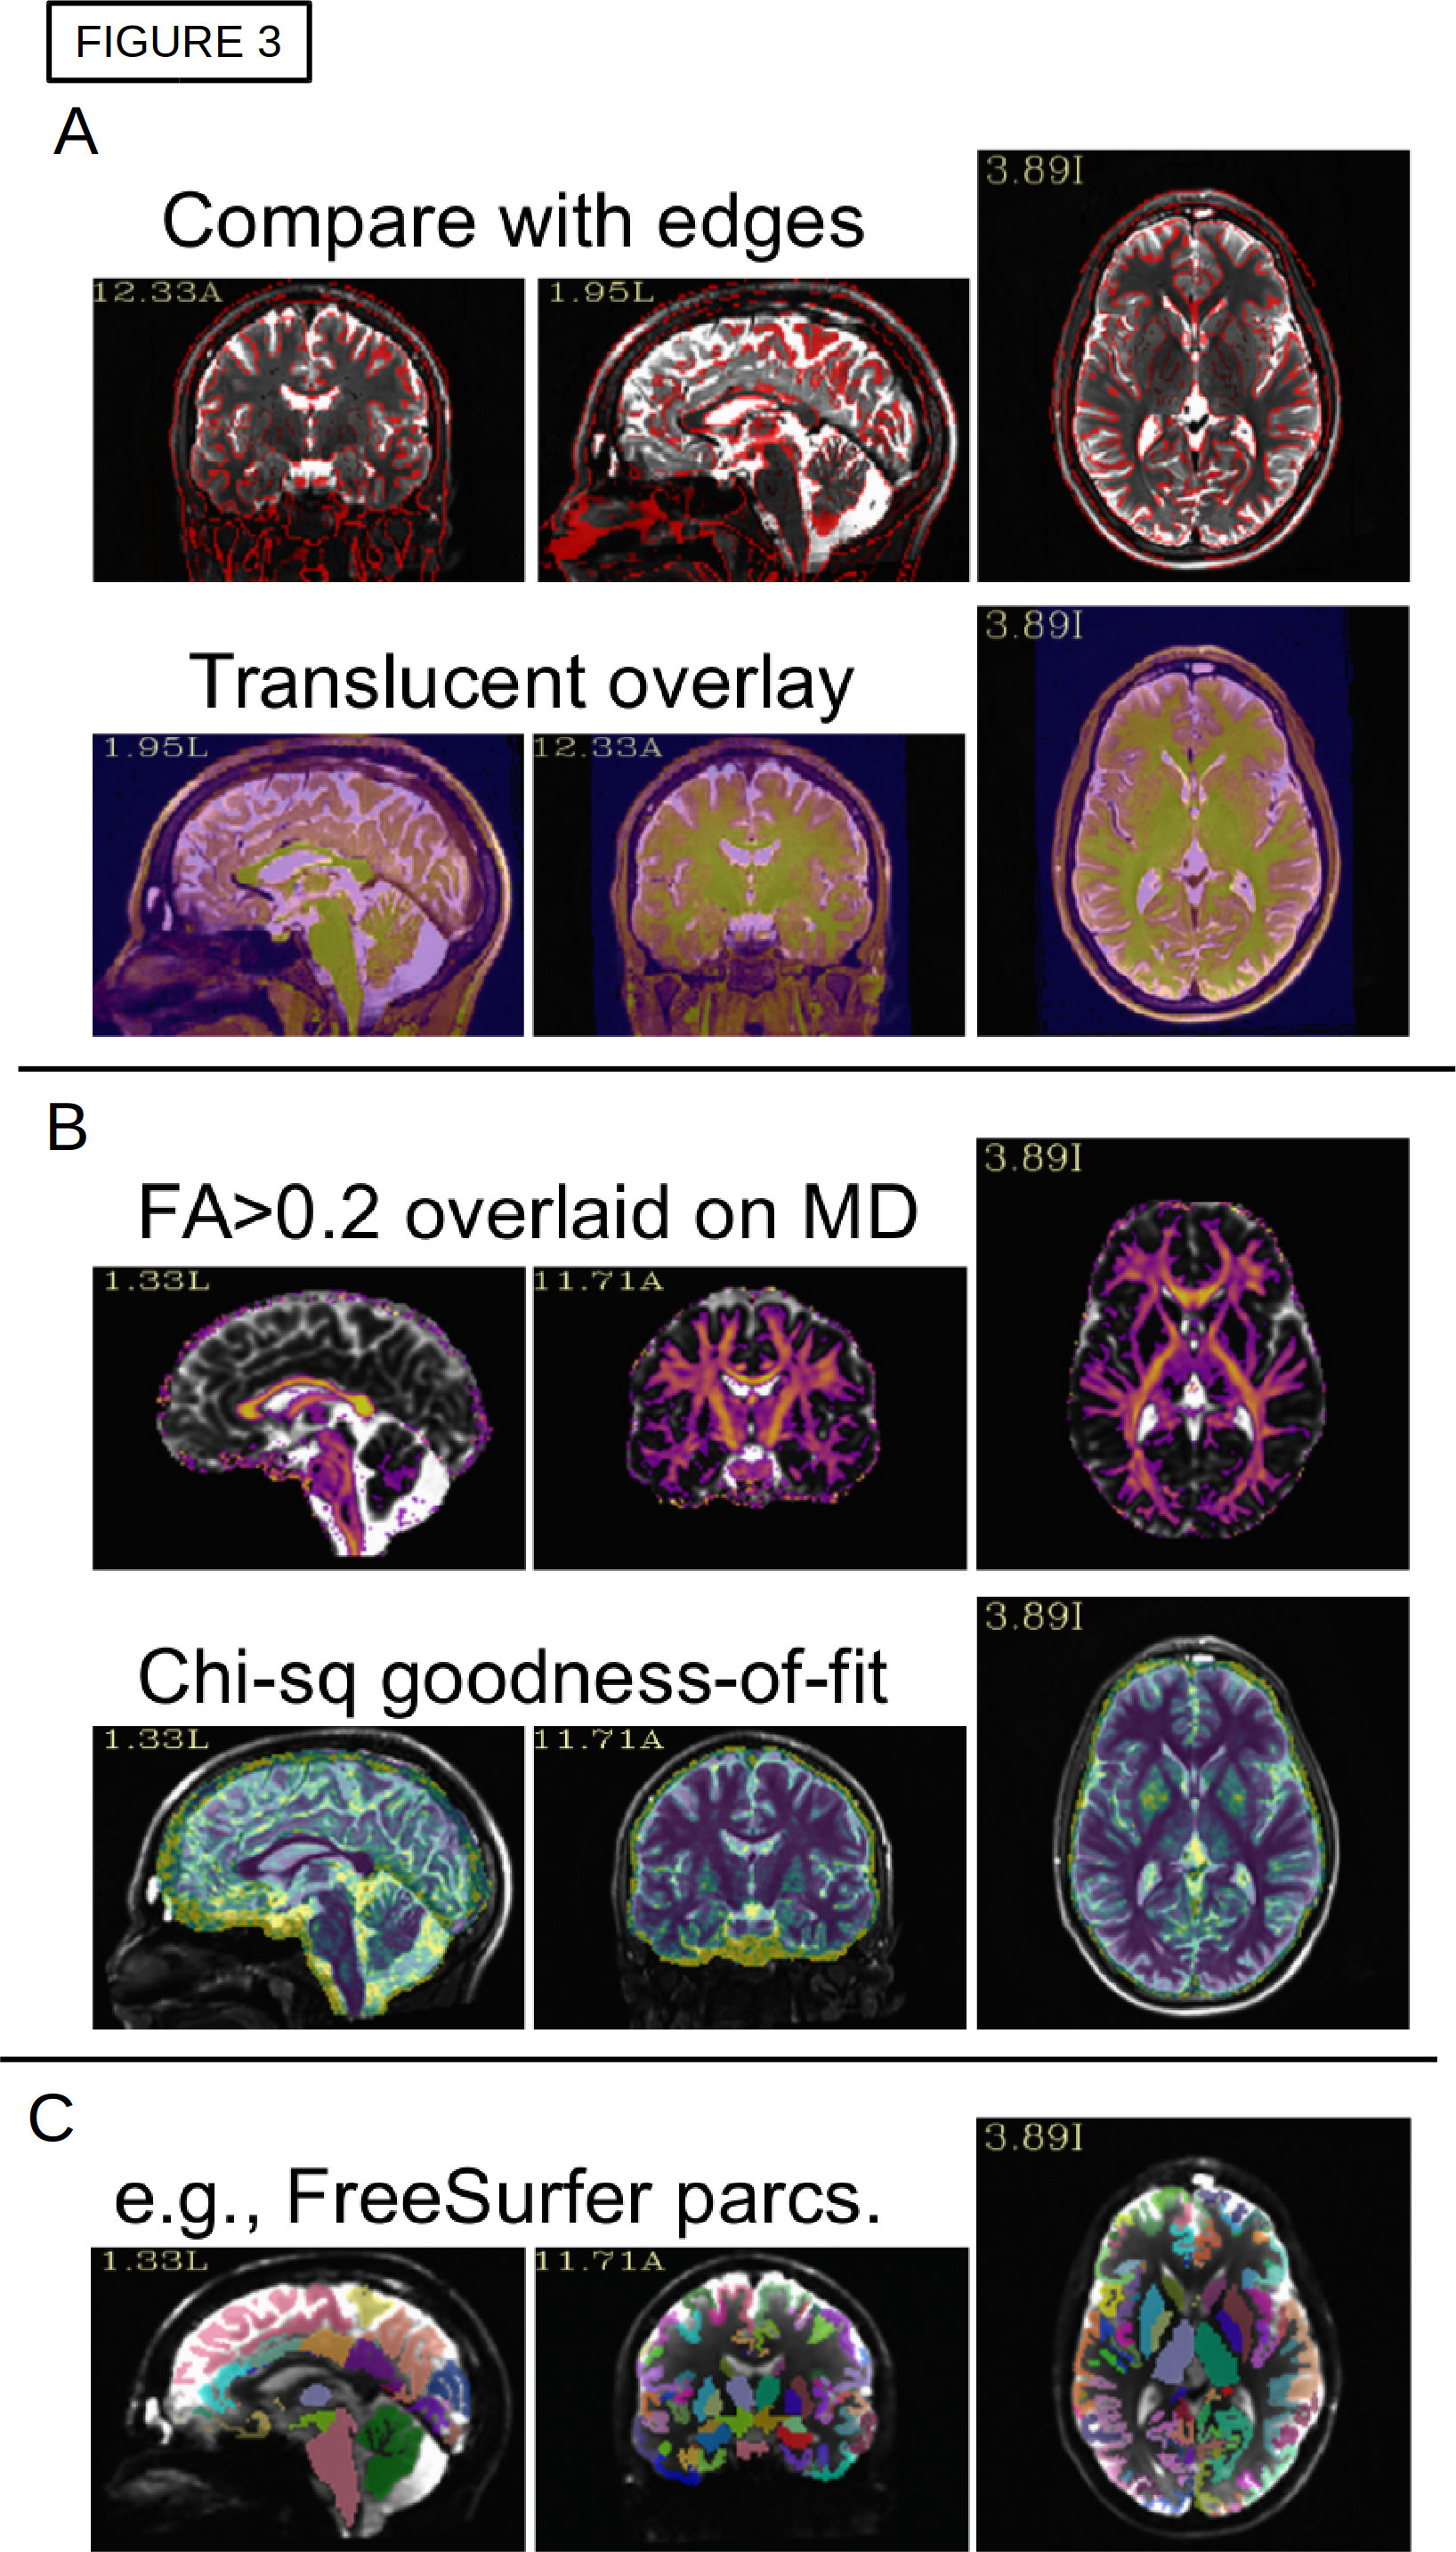
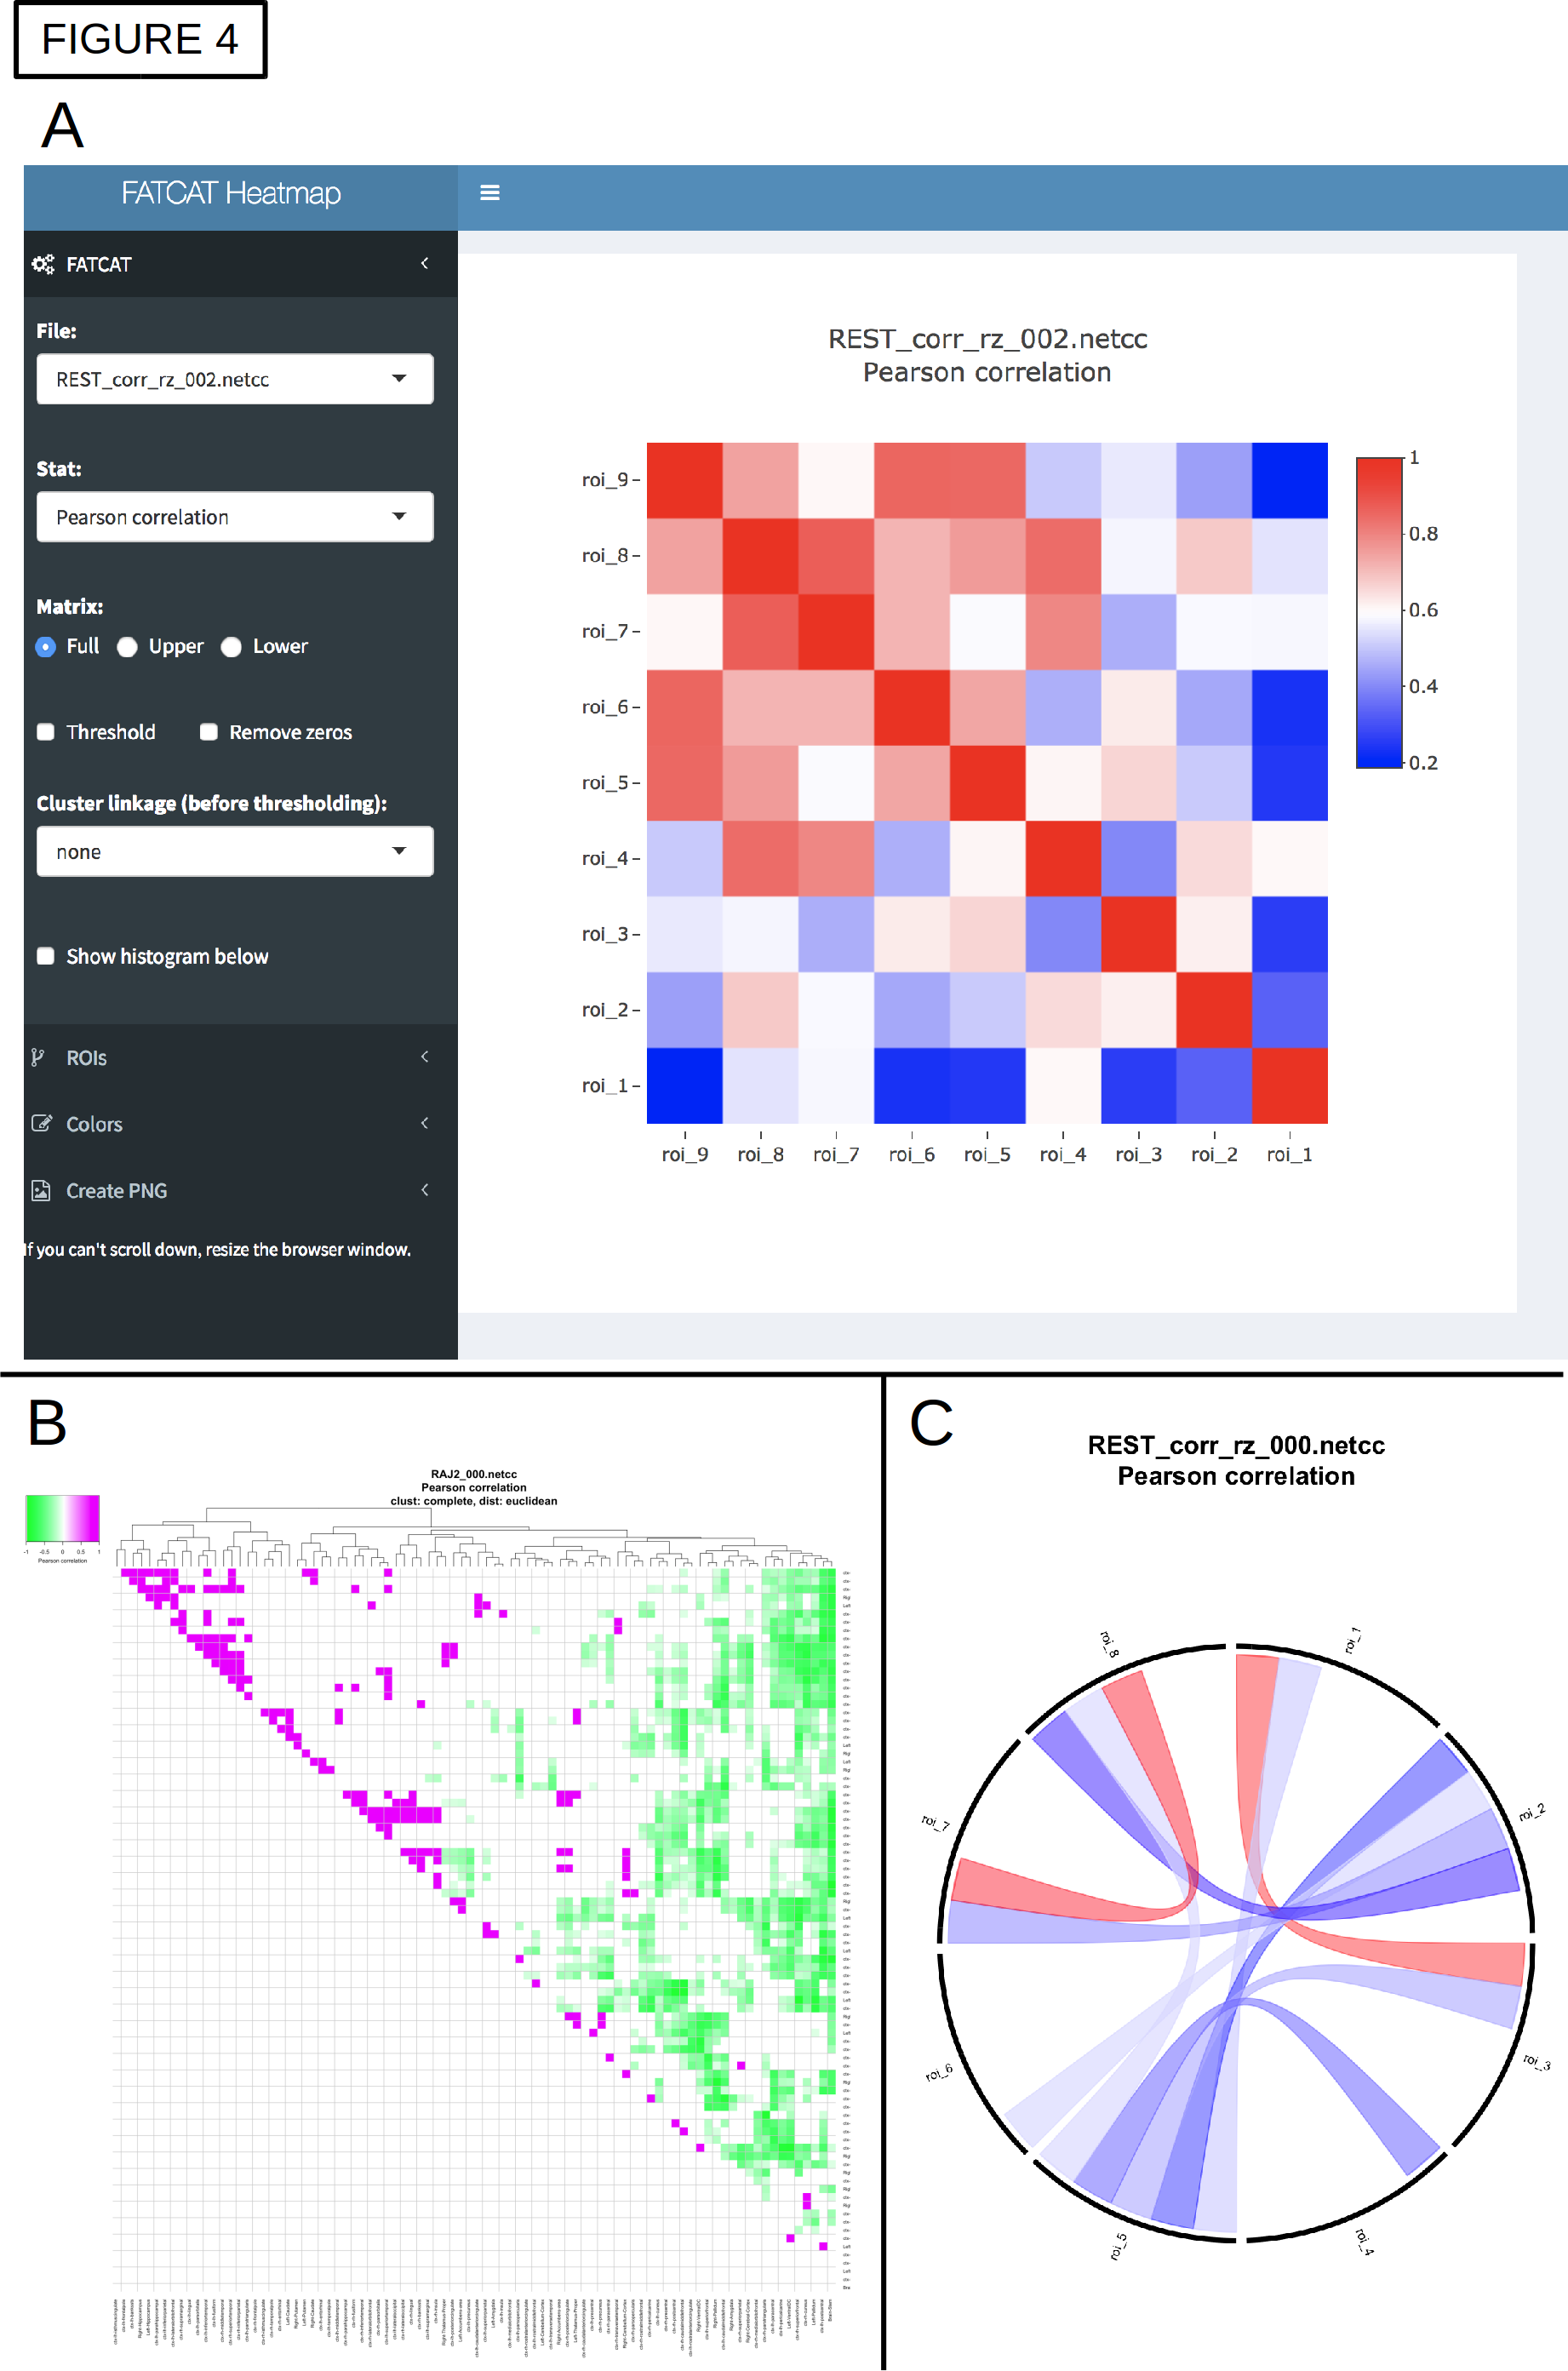
A schematic of the full pipeline is shown in Fig. 1, starting from a DWI acquisition, a T1w anatomical (for FreeSurfer processing) and a T2w anatomical (used by TORTOISE as a reference for DWI distortion correction). A-C) DICOM files are converted to NIFTIs and anonymized, as well as given consistent orientations and coordinate origins at each volume’s center of mass (aiding alignment processes). D-E) users can visualize the converted DWIs and easily select a list of volumes+gradients for removal (e.g., volumes with distortion or signal dropout), as in Fig. 2; when dual phase encoded DWI sets are acquired, users can build a single list to remove volumes+gradients from both sets, to maintain matching volumes. F) Users can quantitatively check that gradient coverage is not overly sparse after removal, and check for outliers of gradient removal within groups of subjects. G) The major planes of the T2w reference can be aligned with the volume axes (without warping), similar to AC-PC alignment, via reference to a standard template brain; this assists interpreting structures with RGB encoding. H) The T1w can be aligned with the T2w, simplifying later ROI mapping; the quality of alignment is quickly judged through two QC images created: an “edgified” comparison of the aligned volumes is saved, as well as a translucent overlay image (Fig. 3A). I-J) FreeSurfer is run and its output converted to AFNI+SUMA formats, with individual maps of tissue types generated. K) DWI distortion corrections are made consistently using TORTOISE tools; QC images displaying the quality of distortion correction are automatically created when AFNI and TORTOISE are both present on the user's computer. L-N) The consistency of gradient notation is checked and the DWIs converted to diffusion tensors (DTs) and parameters; QC images for goodness-of-fit measures and FA-defined white matter (WM) maps are automatically generated (Fig. 3B), and RGB-encoded directionally encoded maps can also be calculated. O) The segmented gray matter (GM) from FreeSurfer is transformed into DWI space (and each region can undergo controlled inflation to reduce regridding effects), with QC images of the ROI maps created (Fig. 3C); surfaces and associated specification files are also transformed. P) Then, tractography can be run among the full GM target map or any subset, determining the likeliest locations of WM associated with each GM pair; matrices of structural properties of each WM connection are automatically generated. Q-S) The tracts and matrices of properties within tracked regions can be viewed in several ways. AFNI and SUMA can be used to visualize data in 2D and 3D simultaneously. Images of the the matrices of WM connection properties can be created from the command line, or visualized interactively with FATCAT_matplot (Fig. 4A), which also allows the user to rearrange matrices and form dendrograms (Fig. 4B) and circos-type plots (Fig. 4C). T) These matrices can also be used for statistical modeling with multivariate methods, using AFNI’s 3dMVM [6,7].Conclusions
This set of programs within AFNI-FATCAT provides a flexible platform for combining several types of data (additionally, FMRI-derived GM maps could also be used for making tractography targets). In each step, having automatically generated QC images assists the researcher in checking the analysis in a systematic fashion, as well as providing a mechanism for sharing and describing the results with colleagues. These tools will aid researchers in creating their pipeline for analyses, and for verifying their output as they process, increasing their reproducibility and repeatability.Acknowledgements
No acknowledgement found.References
1. Cox RW. 1996. AFNI: software for analysis and visualization of functional magnetic resonance neuroimages. Comput Biomed Res 29:162-173.
2. Taylor PA, Saad ZS. 2013. FATCAT: (an efficient) functional and tractographic connectivity analysis toolbox. Brain Con- nect 3:523–535.
3. Rorden, C., Brett, M. (2000). Stereotaxic display of brain lesions. Behavioural Neurology. 12, 191-200.
4. Pierpaoli C, Walker L, Irfanoglu MO, Barnett A, Basser P, Chang L-C, Koay C, Pajevic S, Rohde G, Sarlls J, Wu M. TORTOISE: An Integrated Software Package for Processing of Diffusion MRI Data. In ISMRM 18th Annual Meeting, Stockholm, Sweden, 2010, p. 1597.
5. Fischl B, Salat DH, Busa E, Albert M, Dieterich M, Haselgrove C, van der Kouwe A, Killiany R, Kennedy D, Klaveness S, Montillo A, Makris N, Rosen B, Dale AM. 2002. Whole brain segmentation: automated labeling of neuroanatomical structures in the human brain. Neuron 33:341–355.
6. Taylor PA, Gang C, Cox RW, Saad ZS. 2016. Open Environment for Multimodal Interactive Connectivity Visualization and Analysis. Brain Connectivity 6(2):109-21.
7. Chen G, Saad ZS, Adleman NE, Leibenluft E, Cox RW. 2015. Detecting the subtle shape differences in hemodynamic responses at the group level. Front. Neurosci. 9:375.
Figures