1583
Regularized nonnegative least-square fitting for intravoxel incoherent motion data processing: a simulation study1InBrain Lab - FFCLRP, University of Sao Paulo, Ribeirao Preto, Brazil, 2Physics Institute of Sao Carlos, University of Sao Paulo, Sao Carlos, Brazil
Synopsis
Fitting model plays a crucial role in the analysis of intravoxel incoherent motion (IVIM) data due to limited number of points and to typical noisy data. Also, injured tissues can change the diffusion coefficient (D) value so that the number of D that contributes to total signal might be unknown. A possible solution for this problem is the nonnegative least-square (NNLS) fitting. This study aimed to evaluate the impact of the parameters used in the fitting and its applicability to simulated IVIM signal data processing.
Introduction
Intravoxel incoherent motion (IVIM) is a MR-based diffusion weighted imaging (DWI) method which can separate intravoxel signal into two contributions: classical diffusion and pseudo-diffusion component, mostly related to perfusion and blood flow1. Introduced in 19862, its applicability in brain has not been well explored due to existence of several concurrent methods. Also, data analyses require a complex fitting model to describe the signal. Original models consider the system composed by intra and extravascular compartments3, with both diffusion coefficients differing by around one order of magnitude. In such cases, signal is modulated by bi-exponential model:
$$S = fe^{-bD}+f^{*}e^{-bD^{*}}\tag{1}$$
where f and D refers to pure diffusion motion and f* and D* refers to pseudo-perfusion motion. Recently, studies suggested taking into account different compartments4. Also, in some neurological applications, the number of contributions to total signal is unknown, since affected tissues might induce a shift on certain diffusion coefficients. In that sense, nonnegative least-square (NNLS)5, 6 fitting model is a promising approach, since it doesn’t require any prior information about total number of compartments. Through simulated data, this study aims to study the impact of fitting parameters based on NNLS model and evaluate its applicability for IVIM data processing.
Methods
IVIM signals were simulated using MATLAB according to equation 1, setting D=1x10⁻³mm2/s and D*=10x10-3mm2/s. The amplitudes f and f* randomly varied between 0 and 1 respecting the constraint that f + f*=1. Two b-values set were used in simulation, with 10 and 20 values, respectively, ranging from 0 to 1000s/mm2 spaced logarithmically. Each of these configurations was analyzed without and with noise generated using a Gaussian distribution with standard deviation estimated from typical real data measured in a 3.0T MRI system. In NNLS, signal intensity as function of b-values is described as:
$$y(b_{i})=\sum_{j=1}^Ms(D_{j})e^{-b_{i}D_{j}}=\sum_{j=1}^MA_{ij}s_{j}\tag{2}$$
where y(bi) is the simulated signal, Aij is the matrix containing the exponential kernel function and sj is the unknown amplitude for the component with diffusion coefficient Dj. Using Tikhonov regularization to NNLS, the problem consists to find amplitudes sj that minimize equation 3.
$$\sum_{i=1}^N{(\sum_{j=1}^MS_{ij}-y_{i})}^{2}+\mu\sum_{i=1}^N{(\sum_{j=1}^MH_{ij}s_{j})}^{2}\tag{3}$$
in which μ is the regularization parameter calculated according to the L-curve for Tikhonov regularization7 and Hij is the identity matrix. In equation 3, N is the number of b-values used in simulation and M is the number of exponentials with different diffusion values used in the fitting. Results are presented as a “D spectrum”, where each peak corresponds to a diffusion component and its area represents the amplitude of that component. In this study, diffusion coefficients between 10-3 and 103 mm2/s were analyzed and the number of exponentials used for fitting assumed the following values: 200, 400, 600, 800 and 1000. Perfusion fraction was estimated as pf=f*/(f+f*).
Results
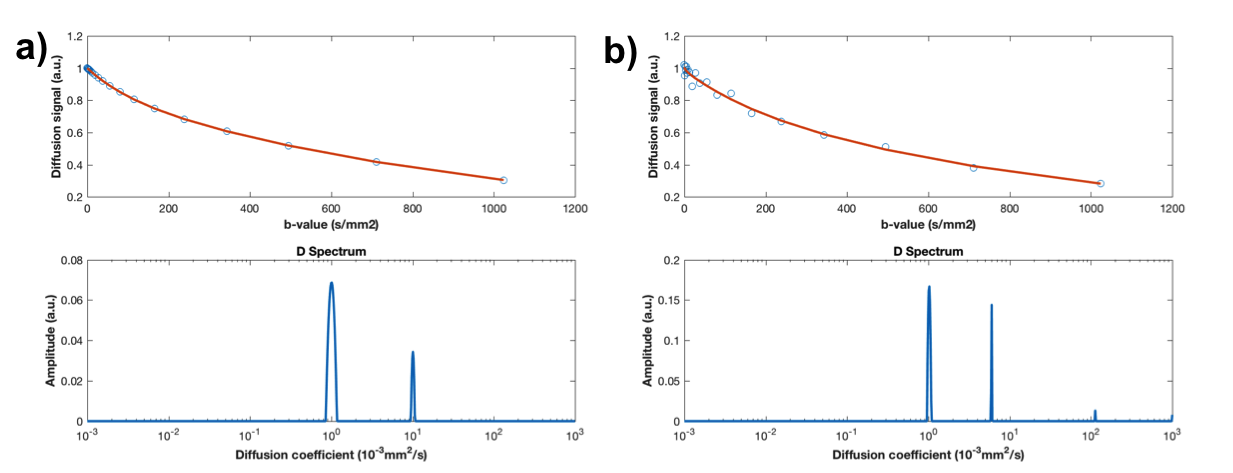
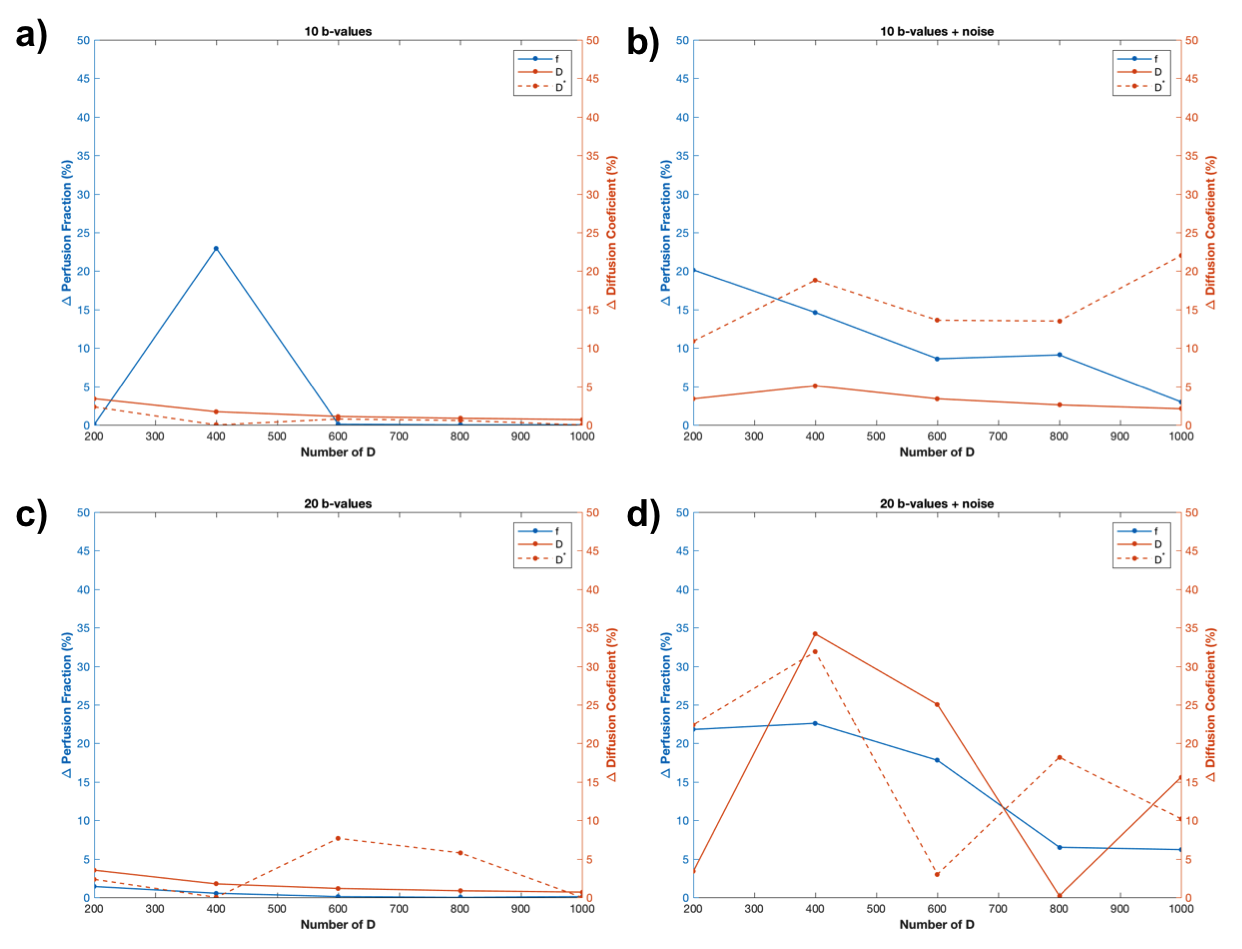
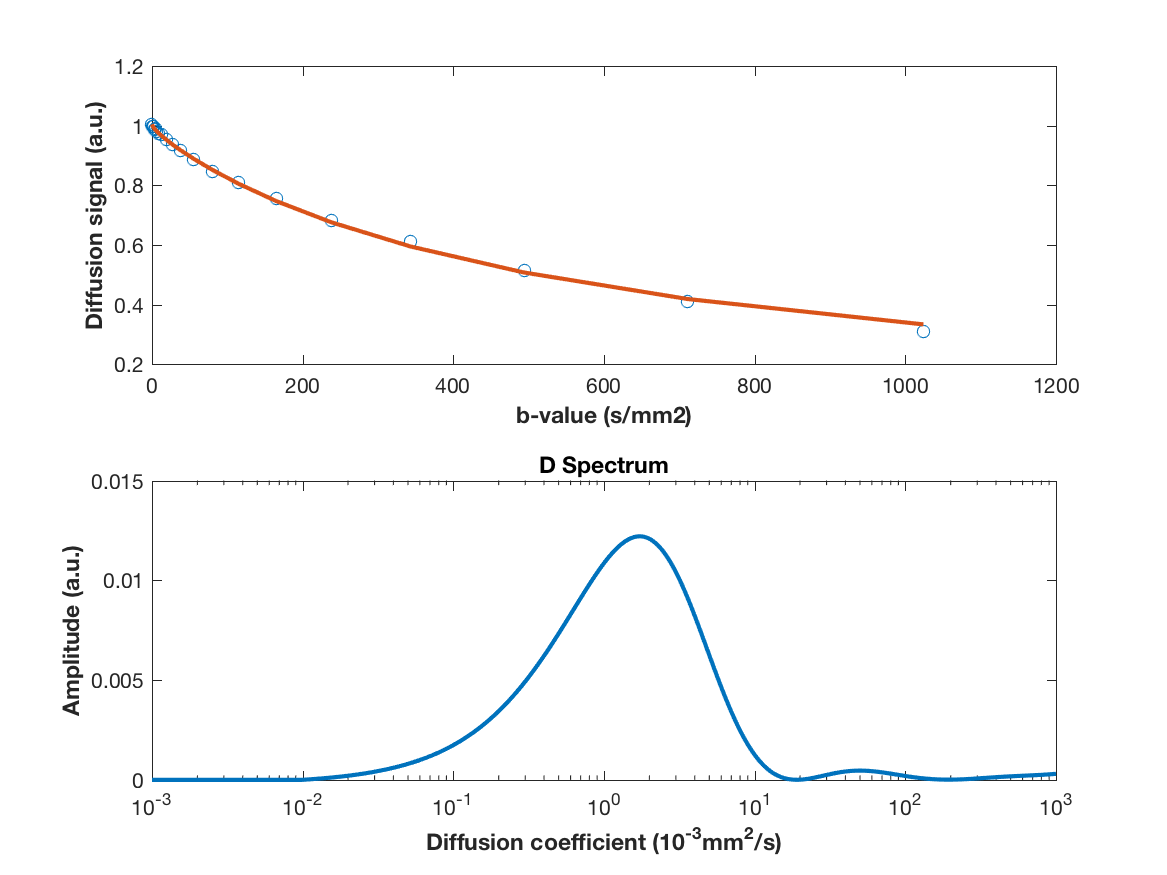
Figure 1 shows a simulated signal with 20 b-values and its respective spectral distribution of diffusion coefficients obtained from regularized NNLS fitting using 600 exponentials. In this case, values estimated for diffusion coefficients (D and D*) and perfusion fraction were exact for noiseless data and 0.80x10⁻³mm2/s, 9.92x10⁻³mm2/s, 0.64, respectively, for noisy data. Figure 2 shows the percentage difference between simulated signal parameters and fitting outputs for different number of b-values and noisy and noiseless data. Figure 3 illustrates the importance of using the proper regularization parameter. Although fitting seems good, use of high regularization parameter prevented NNLS to separate properly the diffusion coefficients contributing to the signal.Discussion
Our data show that the presented method can provide required information without any prior information. This is an important contribution since some neurological diseases present unknown number of diffusion components which can impair conventional evaluation using either mono or biexponential models. Also, this method has the potential to separate large vessels contributions, which is expected to present a very fast-decaying component, undetectable by conventional fitting methods. For noiseless data, the method returns all values of interest with high precision. For noisy data, every diffusion component is found within its own order of magnitude. The precision of the fitting improves as the number of exponentials used for fitting increases. Thus, we recommend using at least 600 intervals in spectrum. Finally, determining properly the regularization parameter is crucial for the efficiency of the proposed method. We used the L-curve method which revealed to be a good candidate for that.Conclusion
We present a promising fitting method for IVIM data processing which can provide information about perfusion fraction and diffusion coefficients without any prior information. Future steps include its application in real datasets.Acknowledgements
CNPq.References
1. Federau, C., Intravoxel incoherent motion MRI as a means to measure in vivo perfusion: A review of the evidence. NMR Biomed, 2017. 30(11).
2. Le Bihan, D., et al., MR imaging of intravoxel incoherent motions: application to diffusion and perfusion in neurologic disorders. Radiology, 1986. 161(2): p. 401-7.
3. Le Bihan, D., et al., Separation of diffusion and perfusion in intravoxel incoherent motion MR imaging. Radiology, 1988. 168(2): p. 497-505.
4. Fournet, G., et al., A two-pool model to describe the IVIM cerebral perfusion. J Cereb Blood Flow Metab, 2017. 37(8): p. 2987-3000.
5. Lawson, C.L. and R.J. Hanson, Solving least squares problems. Prentice-Hall series in automatic computation. 1974, Englewood Cliffs, N.J.,: Prentice-Hall. xii, 340 p.
6. Whittall, K.P. and A.L. Mackay, Quantitative Interpretation of Nmr Relaxation Data. Journal of Magnetic Resonance, 1989. 84(1): p. 134-152.
7. Wu, L.M., A parameter choice method for Tikhonov regularization. Electronic Transactions on Numerical Analysis, 2003. 16: p. 107-128.
Figures