1582
Histogram Analysis of Diffusion Weighted Image for Body Tumors1Department of Radiology, Keio Univerisity School of Medicine, Tokyo, Japan
Synopsis
Weighted diffusion subtraction (WDS) is a new imaging tool which may be useful for estimating the tissue characteristics within a voxel. In this study, DWI histogram (low b vs. high b) was generated and referred to WDS. On the histogram, the data distribution represents the tissue composition with blurring caused by partial volume. DWI histogram can visualize the relationship between T2WI (low b value DWI) and WDS.
Introduction
The diagnostic value of diffusion weighted image (DWI) and apparent diffusion coefficient (ADC) map for body tumors have been widely recognized, but it is still difficult to accurately evaluate the ADC value of tumor cells distributed sparsely in heterogeneous tissue. Weighted diffusion subtraction (WDS) is a new imaging tool which was originally developed to eliminate T2 shine-through ambiguity in diffusion MRI evaluations. 1 Recently, it has been revealed that WDS may be useful for estimating the tissue characteristics within a voxel. 2 In this study, DWI histogram (low b vs. high b) was generated and referred to WDS.Methods
Subjects: Synovial sarcoma and endometrial cancer (4 cases respectively) were examined. The pathology of each case was proven on the specimen resected in the operation.
Data Acquisition: MR images were acquired on a 1.5T scanner (Signa HD, GE Healthcare, Waukesha, WI, USA) using body coil, quadrature foot coil as a receiver. Following routine MRI including T1WI and T2WI, EPI-based DWI (b = 0 and 1000 s/mm2) was obtained with following parameters:TR/TE, 4200-5000/77-82 ms; slice thickness/spacing, 5-7/7-11 mm; matrices 128x160 or 96x128. The pixel size was ranged between 0.7 mm and 1.6 mm, depending the diameter of the subject.
WDS and Histogram Calculation:
WDS is a subtraction technique, using a pixel-by-pixel calculation:
$$S(x, y) = S_0(x, y) \exp(- \Delta b D_{thres}) - S_1(x, y) \\ = S_0(x, y) \exp(- \Delta b D_{thres}) - S_0(x, y) \exp(- \Delta b ADC(x, y)), $$
where S is the signal intensity of WDS, S0 is that of the image obtained with the low b value, and S1 is that of the image acquired with the high b value. Dthres is the threshold value of the diffusion coefficient at which the sign of the signal of WDS is inverted, and Δb is the difference between the b values of the two diffusion weighted images. ADC is the ADC value of a voxel. WDS and DWI histogram (the signal intensity of the low b value DWI vs. that of the high b value DWI) were calculated using in-house software. WDS was obtained with the thresholds of D (1.0, 1.5, 2.0, 2.5, 3.0 ×10⁻³ mm2/ s). The distribution of date points on DWI histogram was visually compared to WDS images, and we estimated the tissue components corresponding to each data point.
Results
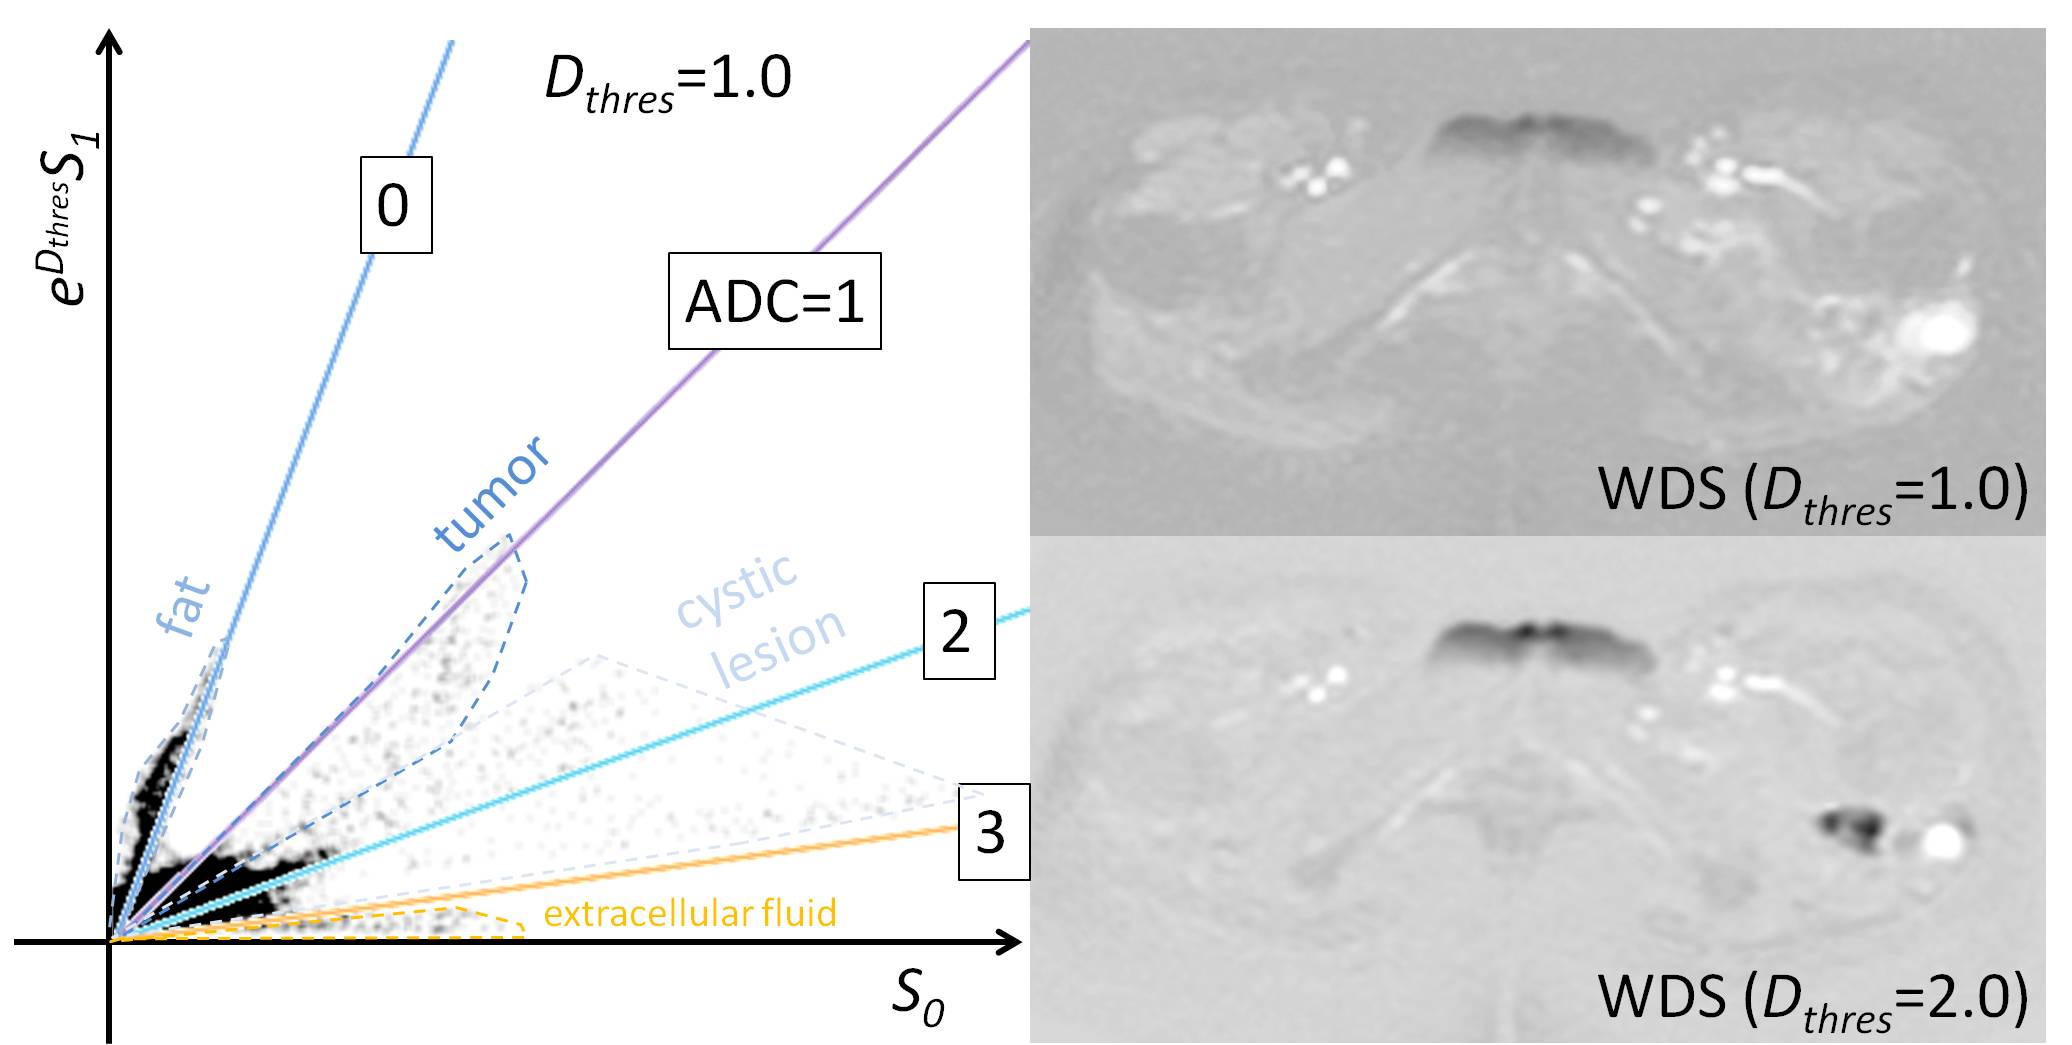
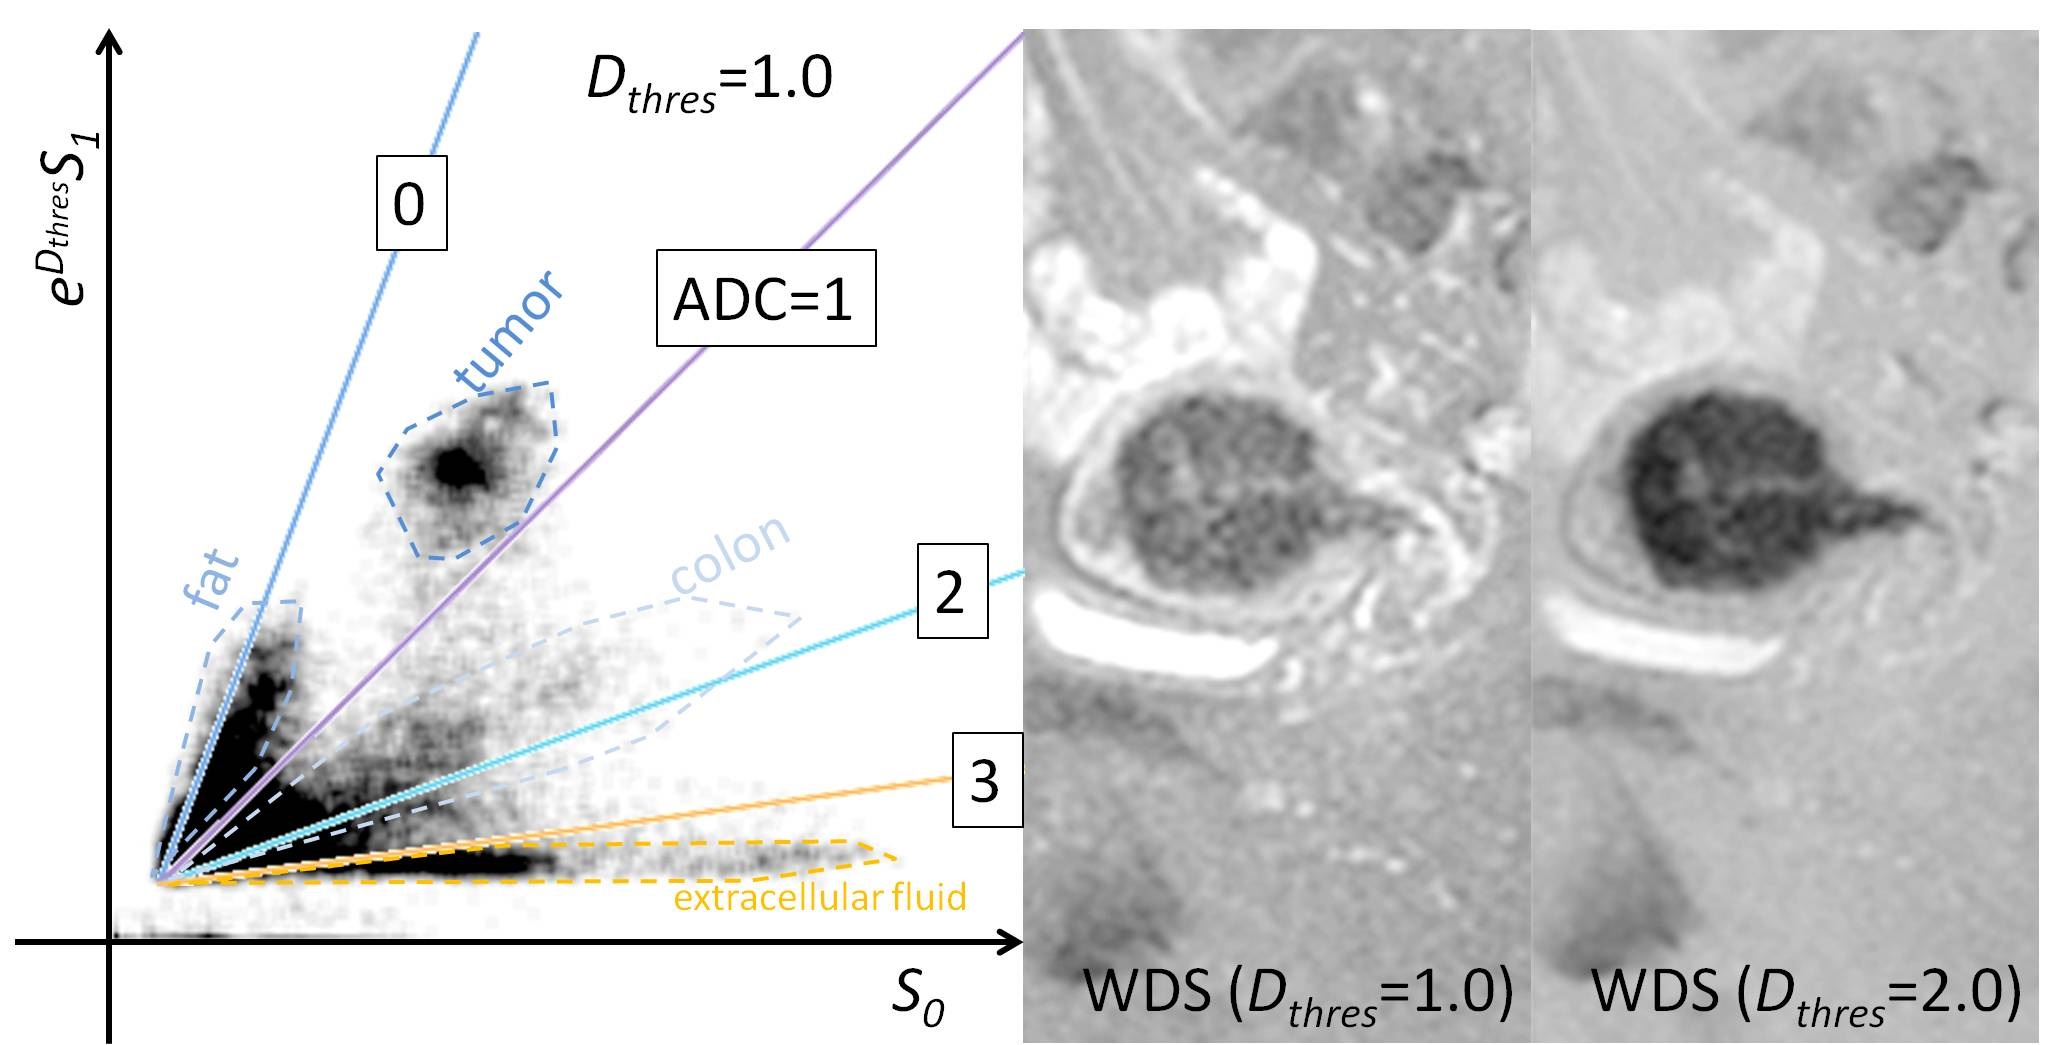
Representative image of WDS and DWI histogram are shown in Fig.1-3. WDS shows tumors as hypointense area, and can visualize tumor tissues surrounded by cystic lesion. By changing Dthres, it is possible to display the image in accordance with the range of ADC value to be noted. In DWI histogram, each tissue component seems to be distributed with a certain degree of coherent. Fat and extracellular fluid are clearly distinguished, and tumor tissues are considered to be between them. The distribution of data points is not linear, but spread with a certain extent.Discussions
The distribution of data points on DWI histogram is estimated to be dependent on tissue component, and the spread of the distribution is considered to reflect partial volume effect. The shape of the distribution varies depending on the disease and the scanning area, but the distribution of the tumor on DWI histogram can be discriminated to some extent.
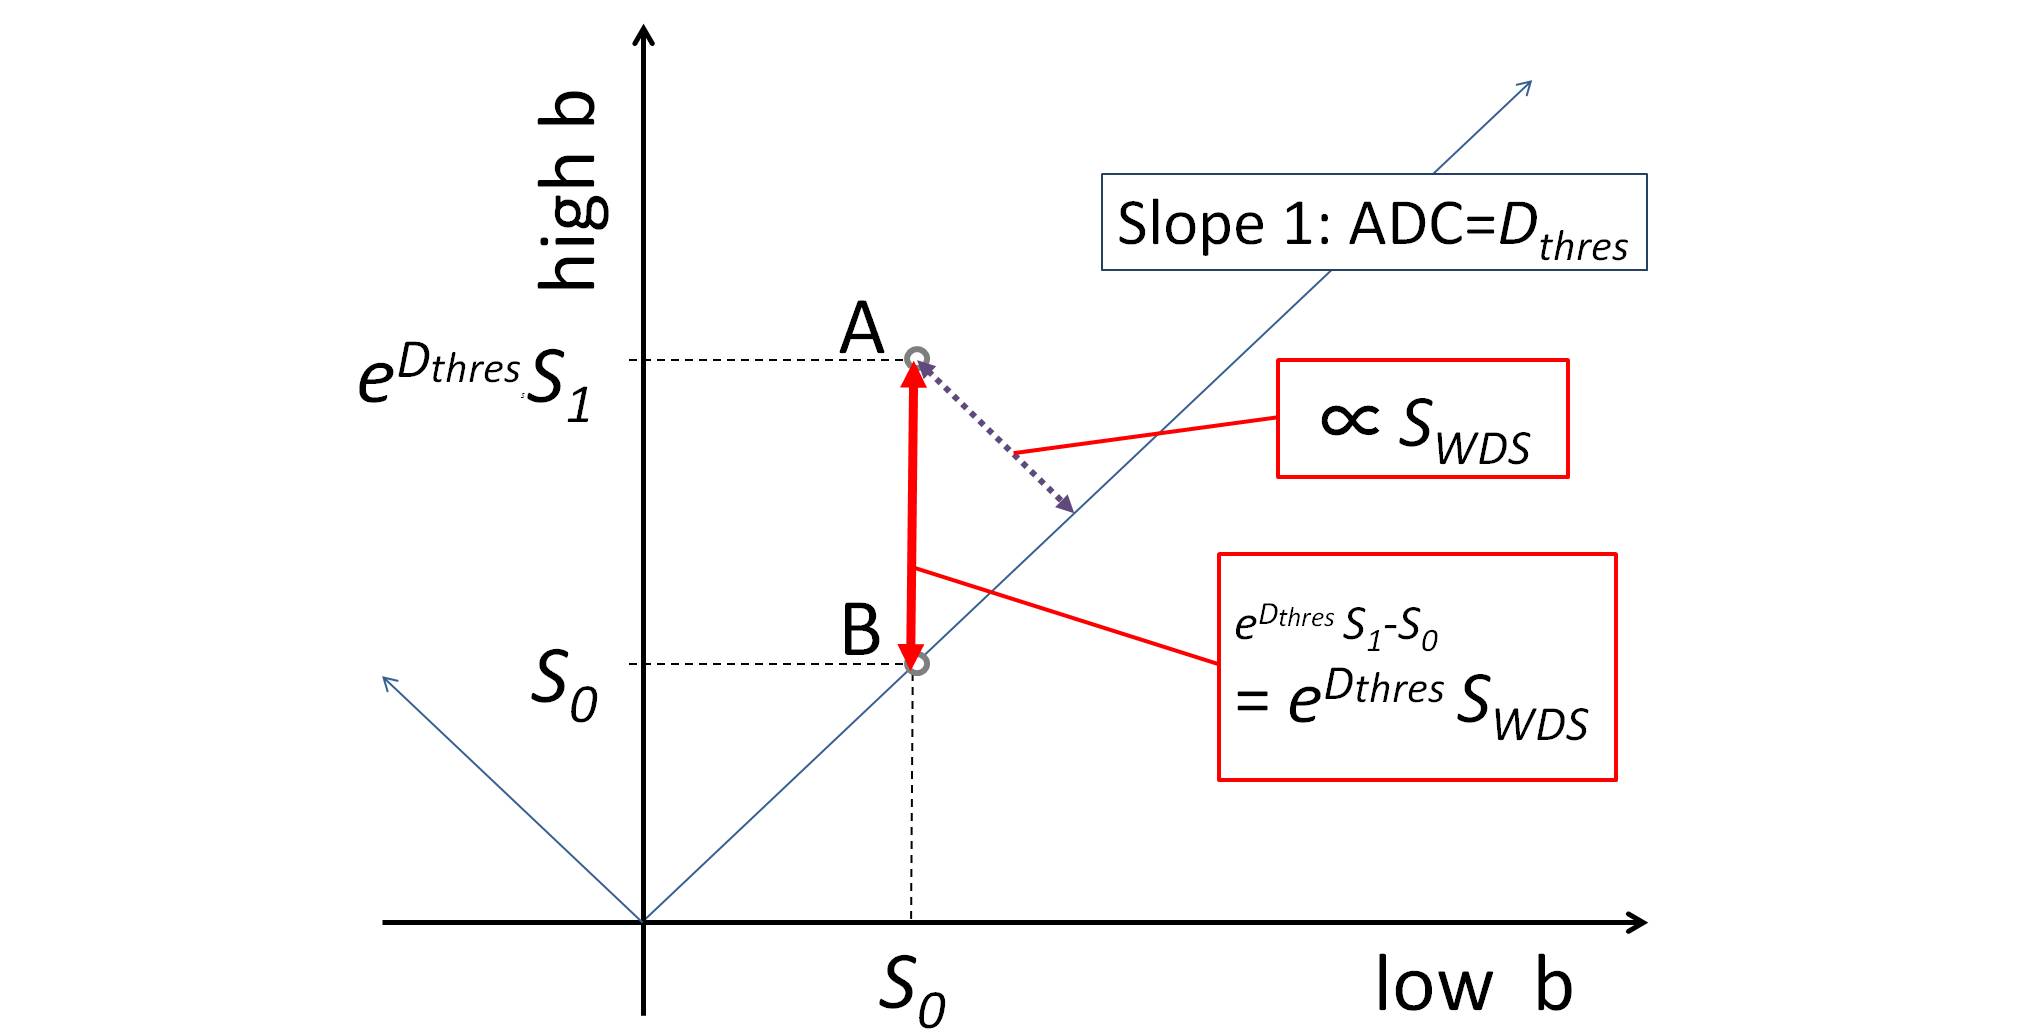
The voxels corresponding to data points plotted above the line of slope 1 are demonstrated as hypointense area in WDS images for each Dthres setting. The signal intensity of WDS is proportional to the difference between point A and B (Fig.4). Therefore, DWI histogram can also show the relationship between T2WI (low b value DWI) and WDS.
Conclusion
DWI histogram is valuable for evaluating the tissue composition and its heterogeneity which is demonstrated as partial volume effect. In addition, the relationship between T2WI (low b value DWI) and WDS can also be visualized on the histogram.Acknowledgements
No acknowledgement found.References
1. Oshio K, Okuda S, Shinmoto H. Removing Ambiguity Caused by T2 Shine-through using Weighted Diffusion Subtraction (WDS). Magn Reson Med Sci. 2016;15(1):146-8.
2. Manabu Arai, Shigeo Okuda, Sota Oguro, Kuniaki Ohori, Koichi Oshio. Application of Weighted Diffusion Subtraction (WDS) to Synovial Sarcomas: Possibility of Visualising Tumor Cellularity. Proc ISMRM 2017, p1808.
Figures