1581
A method to estimate the product of perfusion fraction f and pseudodiffusion coefficient Dp of IVIM without estimating f and Dp1Graduate School of Health Sciences, Fujita Health University, Toyoake, Japan, 2Department of Radiology, Fujita Health University Hospital, Toyoake, Japan, 3School of Medicine, Fujita Health University, Toyoake, Japan, 4Department of Radiology, Tokyo Metropolitan Health and Medical Treatment Corporation Ebara Hospital, Tokyo, Japan
Synopsis
IVIM analysis can provide the perfusion fraction f
and the pseudodiffusion coefficient D* or Dp in addition to the
diffusion parameters. The product of f and D* is known to relate to
cerebral blood flow. Recently, a higher diagnostic performance of fD*
than f and D* has been reported.
We propose a method to estimate fDp without estimating f and Dp using DKI analysis. The DKI based IVIM
analysis can be implemented easily and provides fDp values with a high degree of precision.
Introduction
Intravoxel incoherent motion (IVIM) analysis1 can provide the perfusion fraction f and pseudodiffusion coefficient D* or Dp in addition to the diffusion parameters. The product of f and D* is known to relate to cerebral blood flow2, and recently, a higher diagnostic performance of fD* than f and D* was reported3. However, the fD* map tends to be noisy because of large noises in the D* map, whereas f value can be obtained relatively high level of precision. On the basis of the fact that interfusion of the perfusion into the diffusion can affect to the kurtosis of the probability density function of water molecule-translational displacements, we propose a method to estimate fDp without estimating f and Dp using diffusional kurtosis imaging (DKI) analysis4,5 to improve the precision and accuracy of the fDp estimation (Dp and D* are similar quantities and the difference will be given in the next section).
Theory
The IVIM signal expression is1
\[S(b)=S_0e^{-bD_t}\left\{(1-f)+fe^{-bD_p}\right\}=S_0\left\{(1-f)e^{-bD_t}+fe^{-bD^\ast}\right\},~~\cdots (1)\]
where b is b-value, S0 is the signal intensity at b=0, Dt is the pure diffusion coefficient and D*=Dp+Dt. Differentiating Eq. (1) with respect to b and then setting b=0, we have
\[\frac{1}{S_0}\left.\frac{dS(b)}{db}\right|_{b=0}=-(1-f)D_t-fD^\ast.~~\cdots (2)\]
On the other hand, the DKI signal expression is
\[S(b)=S_0\exp\left\{-bD+\frac{1}{6}(bD)^2K+o\{(bD)^4\}\right\},~~\cdots (3)\]
where D and K is the diffusivity and kurtosis, respectively. Differentiating Eq. (3) with respect to b and then setting b=0, we have
\[\frac{1}{S_0}\left.\frac{dS(b)}{db}\right|_{b=0}=-D~~\cdots (4)\]
Equalizing Eqs. (2) and (4), we have
\[fD_p=D-D_t.~~\cdots (5)\]
To estimate fDp with Eq. (5), we obtain Dt by fitting a diffusion signal model to diffusion-weighted imaging (DWI) data acquired with b-values larger than around 300 s/mm2 where the perfusion signal component sufficiently attenuates. We also obtain D by DKI analysis with low b-value DWI signal data that contain both diffusion and perfusion signal components.
Methods
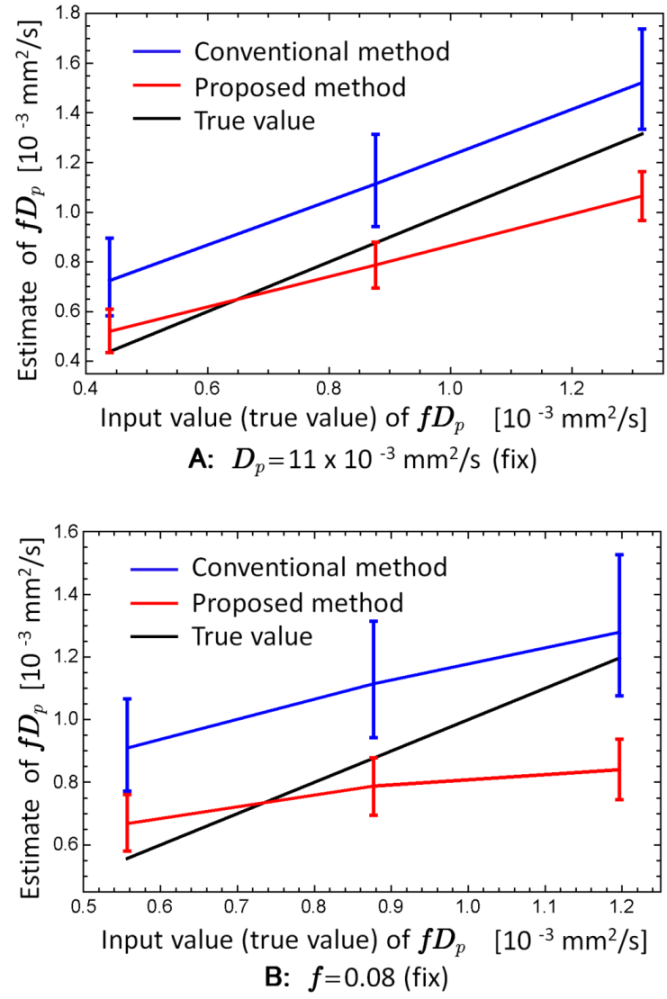
To estimate Dt we implemented the mono-exponential (exp.) DWI analysis with b = 350, 400, 450, 500, 600, 800, 1000 s/mm2 data, and to estimate D we implemented the DKI analysis with b = 0, 1, 10, 20, 35, 50, 100, 200, 300, 350, 400 s/mm2 data. We also estimated f and Dp using conventional IVIM for comparison, in which f and Dt were obtained from mono-exp. fitting with data of b ≥ 350 s/mm2, and then Dp was estimated using the bi-exp. signal expression with the full signal data. A healthy male volunteer was scanned on a 3 T MR imaging scanner and fDp maps were made with the proposed and conventional IVIM analyses. DWIs were acquired using a single-shot spin-echo echo planar imaging sequence for 3 orthogonal diffusion gradient directions. Scan parameters were as follows: repetition/echo time, 90/4500 ms; field of view, 220×220; acquisition matrix, 128×128; slice thickness/gap, 5/1 mm; number of slice, 25; number of acquisition, 1. Simulation studies were also performed to clarify the systematic and statistical errors. Simulated signal set for brain white matter were made by using a tri-exp. (bi-exp. diffusion and mono-exp. perfusion) model with Rician noises (signal to noise ratio is 50). Input model parameters were as follows: f = 0.04, 0.06, 0.08, Dt = 1.0×10⁻³ mm2/s, Dp = 7.0, 11.0, 15.0×10⁻³ mm2/s. 104 different signal datasets were made.
Results
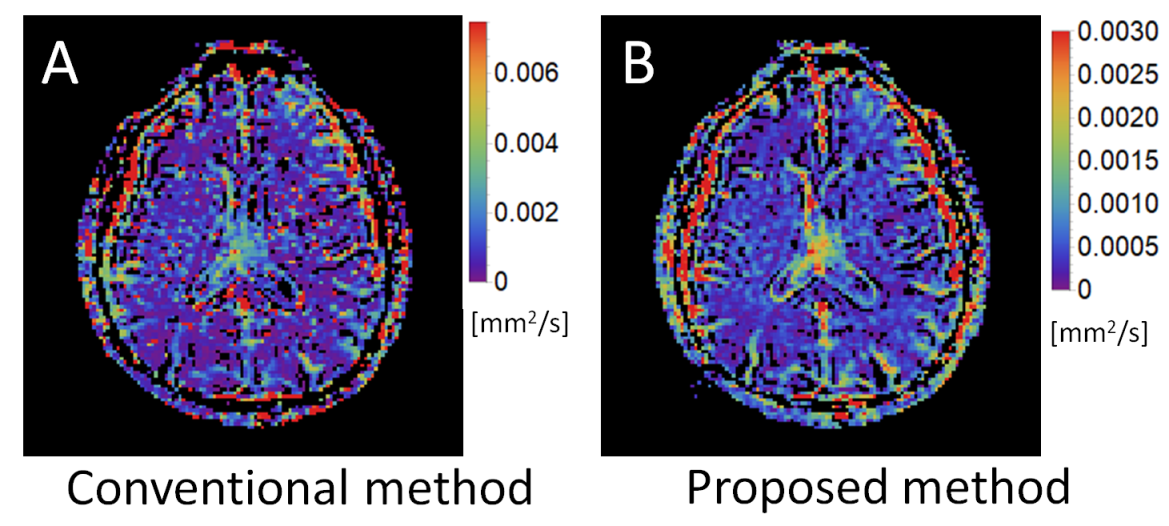
Figure 1 shows fDp maps of a healthy volunteer provided by the conventional and proposed methods. Noises were clearly reduced in the map of the proposed method. Figure 2 shows the results of the simulation studies. The statistical errors (error bars) of fDp estimated by the proposed method were smaller than those of the conventional method, which is consistent with the healthy volunteer study. The systematic errors (biases) of each method depended on the input fDp values. When the fDp value is small, the systematic error became smaller in the proposed method, while when the fDp value is large, the systematic error became smaller in the conventional method.Discussion
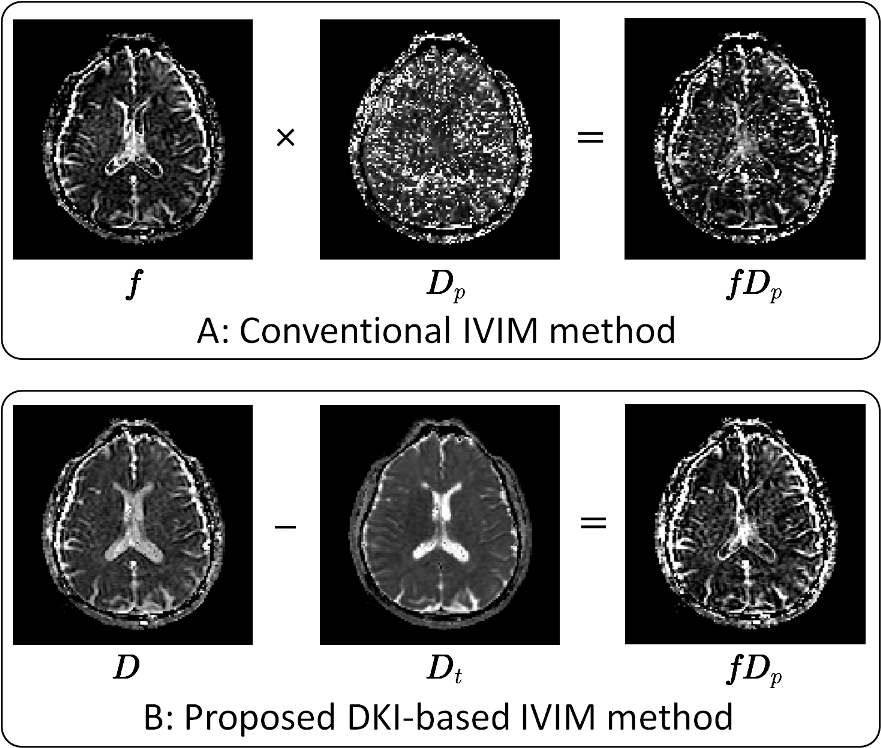
In the conventional IVIM analysis the noises of fDp map are mainly attributed to noises of Dp map. In the proposed method, the fDp is estimated as the difference between D obtained by DKI analysis with low-b data and Dt obtained by mono-exp. DWI analysis without low-b data. Because both D and Dt can be estimated with relatively high levels of precision, fDp maps are estimated with a high degree of precision in the proposed method (Figure 3).
We did not use the kurtosis values obtained in the DKI analysis, but the use of DKI analysis in D estimation is essentially important because the kurtosis value becomes large owing to the mixing of the diffusion and perfusion, and thus largely affects to the D estimations in general.
Conclusions
DKI based IVIM analysis improves the precision of fDp estimation and can be implemented easily.Acknowledgements
We are grateful to Hiroshi Toyama, MD, of Fujita Health University, and Yutaka Kinomura, RT, of Fujita Health University Hospital for use of facilities and constant encouragement. We thank Mitsuru Masumoto, RT, of Fujita Health University Hospital supporting the experiments involving MRI equipment. We also wish to acknowledge Masato Abe, MD, of Fujita Health University for fruitful discussions and comments. This work was supported in part by JSPS KAKENHI Grant Number JP17H05307.References
1. Le Bihan D, Breton E, Lallemand D, et al. Separation of diffusion and perfusion in intravoxel incoherent motion MR imaging. Radiology. 1988;168(2):497-505.
2. Le Bihan D, Turner R. The capillary network: a link between IVIM and classical perfusion. Magn Reson Med. 1992;27(1):171-178.
3. Shen N, Zhao L, Jiang J, et al. Intravoxel incoherent motion diffusion-weighted imaging analysis of diffusion and microperfusion in grading gliomas and comparison with arterial spin labeling for evaluation of tumor perfusion. J Magn Reson Imaging. 2016;44(3):620-632.
4. Jensen JH, Helpern JA, Ramani A, et al. Diffusional kurtosis imaging: the quantification of non-gaussian water diffusion by means of magnetic resonance imaging. Magn Reson Med. 2005;53(6):1432-1440.
5. Umezawa E, Yoshikawa M, Yamaguchi K, et al. q-Space imaging using small magnetic field gradient. Magn Reson Med Sci. 2006;5(4):179-189.
Figures