1578
Spatial normalization of individual fractional anisotropy (FA) maps to widely used population templates for analysis can increase variability and create spurious differences in the measured FA values1Quantitative Medical Imaging Section, NIBIB, NIH, Bethesda, MD, United States, 2The Henry M. Jackson Foundation for the Advancement of Military Medicine Inc, Bethesda, MD, United States, 3Michael E.DeBakey VA Medical Center and Baylor College of Medicine, Houston, TX, United States, 4Chronic Effects of Neurotrauma Consortium, Richmond, VA, United States
Synopsis
In this study we evaluate the effects of spatial normalization of individual fractional anisotropy (FA) maps to widely used population templates for analysis and its introduction of variability, creating spurious differences in the measured FA values.
Introduction
Multicenter studies such as Chronic Effects of Neurotrauma Consortium (CENC) [1] acquire both healthy and mild traumatic brain injury (mTBI) patient population data across various sites. In such large studies, group analysis is often performed by registering individual data to a pre-existing template, using regions of interest (ROIs) defined in that template space. [2,3] These methods have been used by several Diffusion Tensor Imaging (DTI) studies to analyze data. The advantage of analysis in a template space is the convenience of using pre-defined ROIs that can be mapped onto the study population data, either by bringing individual subject data into the template space or transforming the ROIs back onto the subject native space. The success of a template based ROI analysis relies on the accurate registration of individual data to the template. While there are proposed methods to harmonize multicenter data [4,5] to reduce inter-site variability, the implications of added heterogeneity from registration misalignments in template-based group analysis have not been fully considered. Since effects in mTBI can be potentially widespread and affect cortical and subcortical structures, any additional heterogeneity due to misalignment may obscure the interpretation of results. To investigate the potential misalignment effects of registering individual FA scans to a template, we will register living phantom DTI data from CENC, scanned at multiple sites to two commonly used templates in DTI analysis: JHU ICBM and ENIGMA. [6,7]Method
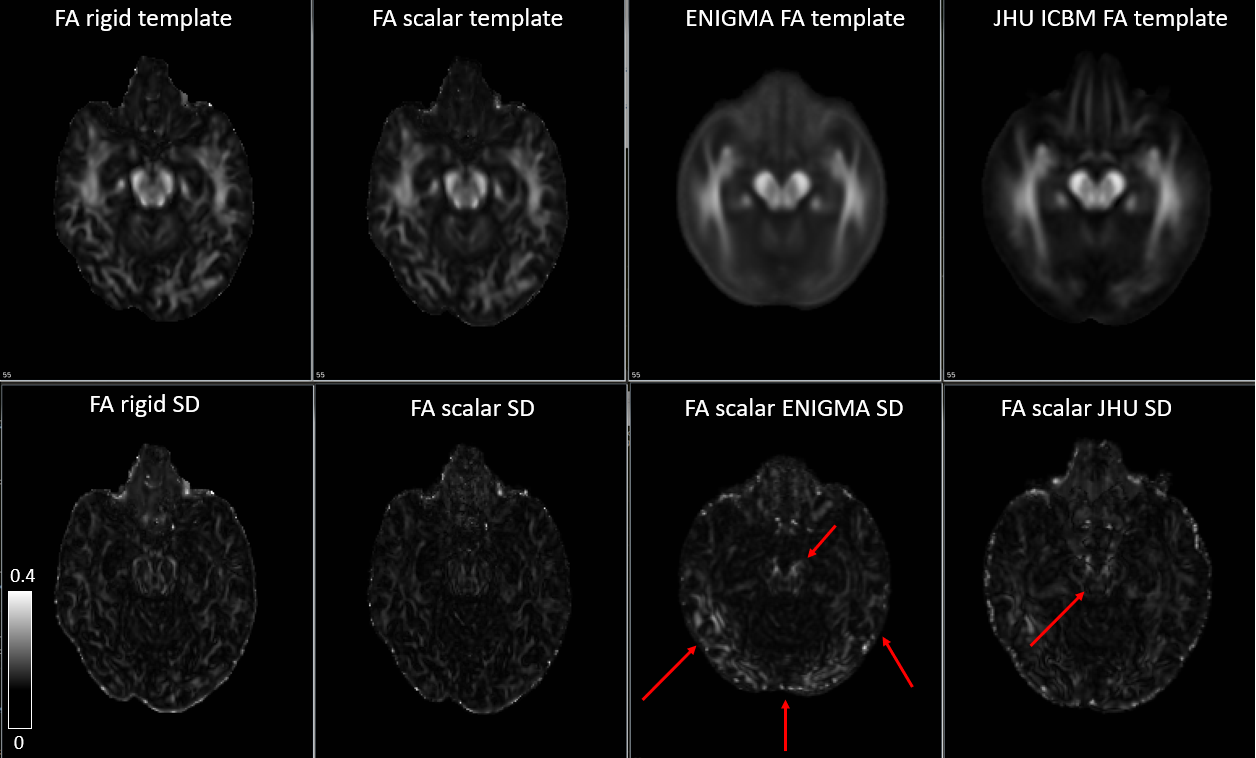
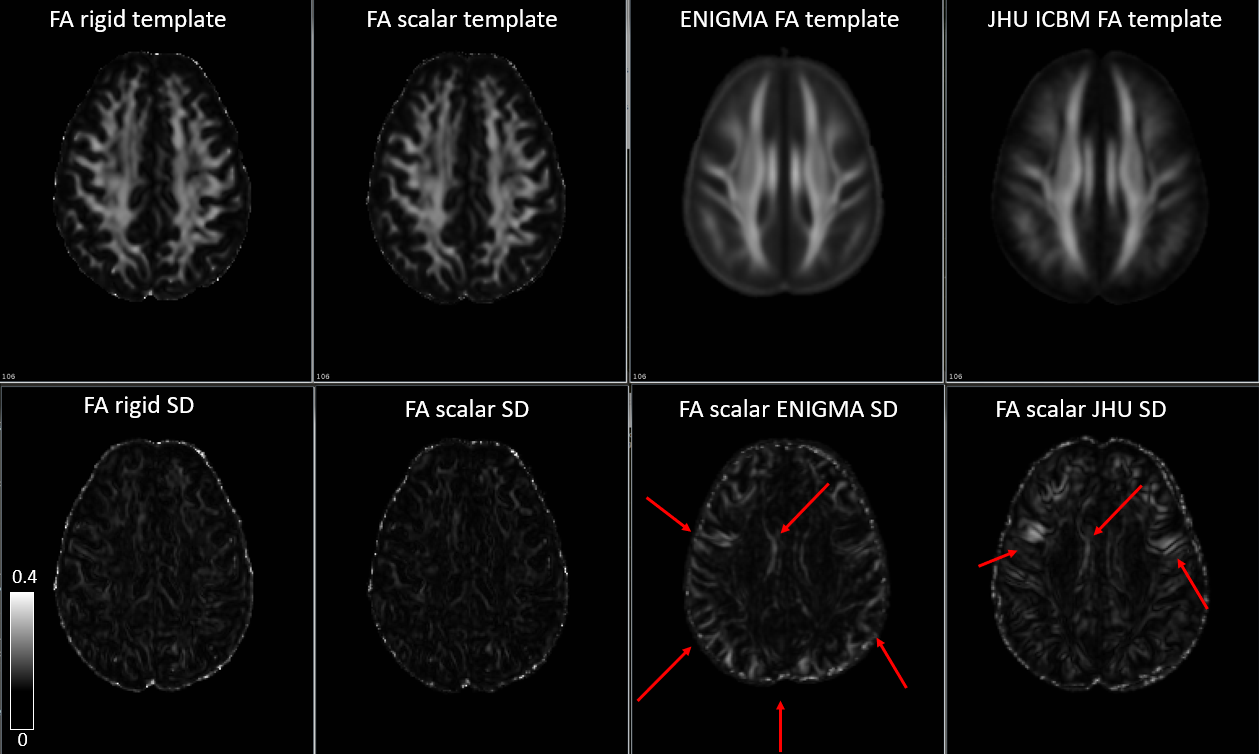
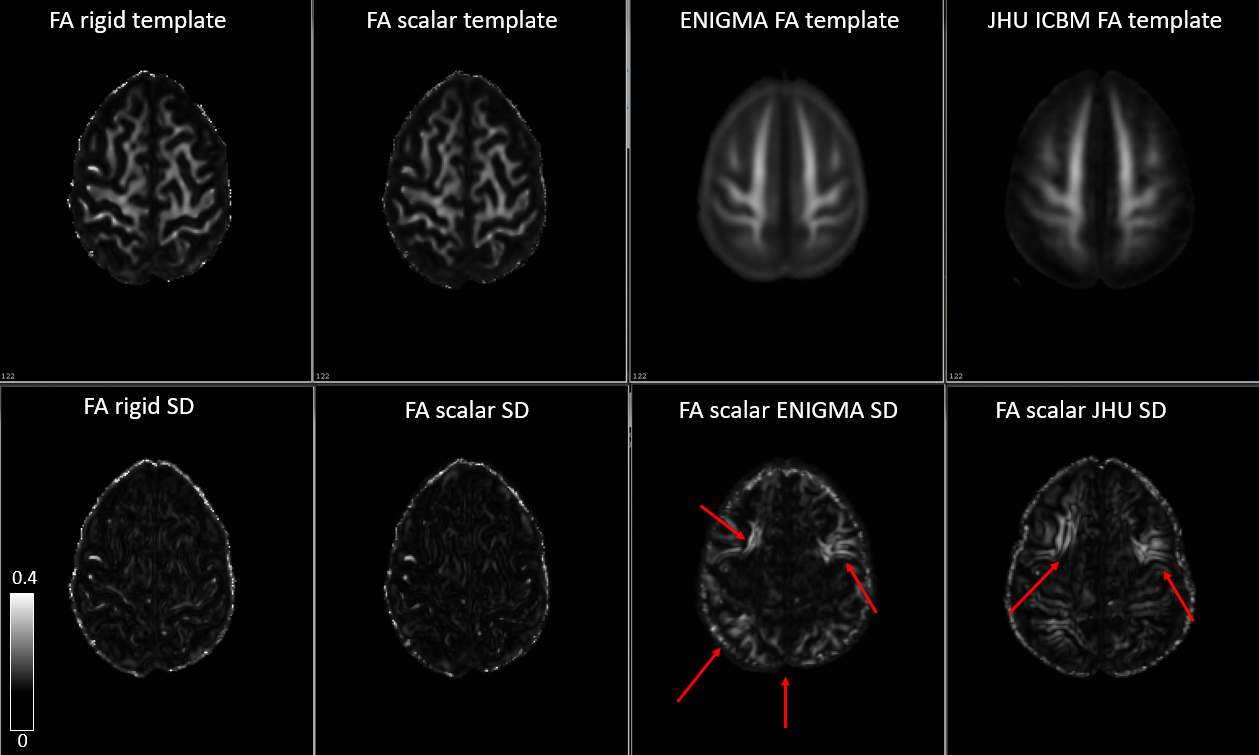
We used DTI data of a living phantom, from CENC that were acquired on Siemens scanners at five different sites. The datasets were acquired with opposite phase encoding direction scheme [AP, PA]. The scans were corrected for eddy, motion and EPI distortion artifacts. Diffusion tensor (DT)s were computed and fractional anisotropy (FA) maps were derived from the DTs using TORTOISE. [8,9] These FA maps derived from the DTs were used as the starting point for each of the following analyses. To address the potential inconsistencies in FA measurements between post processed scans from the same subject, we performed a rigid body alignment of the FA scans to a single scan using MIPAV [10] and computed a standard deviation map, FA rigid SD. To address the accuracy of the registration software used in performing the alignment, we registered FA scans, to a mean FA from the group using ANTS SyN, [11,12] to create a standard deviation map out of the aligned outputs, named here as FA scalar SD. To address the potential misalignments arising from registering to a template individual FA maps were ANTS SyN registered to the JHU ICBM FA and ENIGMA FA map. Standard deviation maps, FA scalar JHU SD and FA scalar ENIGMA SD were computed using the outputs from the two tests respectively. The standard deviation maps were inspected visually to identify variability between FA scans arising from each of the registrations.Results
FA rigid SD and FA scalarSD have almost no variability in the measured FA values, as expected within repeated scans on a healthy subject (fig 1-3). There is almost no variability between post processed scans and the registration algorithm performs satisfactorily when individual subjects are registered to a subject specific template. However, FA scalar JHU SD and FA scalar ENIGMA SD, show regions of high variability such as in the apex of the brain, cingulum and deep brain structures such as cerebral peduncles. This indicates that registering individual FA images to a non-subject specific template, can introduce potential misalignments.Conclusion and Discussion
In DTI studies, careful measures are taken to design experiments and correct for potential DTI artifacts, to measure small changes in brain anatomy of patients with respect to controls. With our living phantom data analysis, we show the risk of additional sources of variability being introduced in regions that were not present prior to registering to a common template. Since the injury effects of mTBI are not limited to white matter structures and can be present in the cortical regions of the brain, the misalignments introduced along the brain periphery cannot be ignored. The reduction of variability in FA measurements when individual data is registered to a subject specific template can be particularly appreciated in longitudinal studies.Acknowledgements
This material is based upon work supported by the U.S. Army Medical Research and Material Command and from the U.S. Department of Veterans Affairs Chronic Effects of Neurotrauma Consortium under Award No. W81XWH-13-2-0095. The U.S. Army Medical Research Acquisition Activity, 820 Chandler Street, Fort Detrick MD 21702-5014 is the awarding and administering acquisition office. Any opinions, findings, conclusions or recommendations expressed in this publication are those of the author(s) and do not necessarily reflect the views of the U.S. Government, or the U.S. Department of Veterans Affairs, and no official endorsement should be inferred.References
[1] https://cenc.rti.org
[2] Olaia et al. Verbal Memory in Parkinson’s Disease: A Combined DTI and fMRI Study, Journal of Parkinson's Disease, vol. 5, no. 4, pp. 793-804, 2015.
[3] Kelly et al. Widespread white matter microstructural differences in schizophrenia across 4322 individuals: results from the ENIGMA Schizophrenia DTI working group, Molecular Psychiatry, 2017, doi: 10.138/mp.2017.170.
[4] Jean-Philippe Fortin et al. Harmonization of Multi-Site Diffusion Tensor Imaging Data, 10.1016/j.neuroimage.2017.08.047.
[5] Mirzaalian et al. Multi-site harmonization of diffusion MRI data in a registration framework, Brain Imaging and Behavior DOI 10.1007/s11682-016-9670-y.
[6] http://www.loni.usc.edu/ICBM/Downloads/index.shtml
[7] http://enigma.ini.usc.edu/protocols/dti-protocols
[8] Irfanoglu et al. TORTOISE v3: Improvements and New Features of the NIH Diffusion MRI Processing Pipeline, ISMRM, 2017.
[9] C. Pierpaoli, L et al. TORTOISE: an integrated software package for processing of diffusion MRI data, ISMRM 18th annual meeting, Stockholm, Sweden, #1597.
[9] MIPAV: Medical Image Processing, Analysis, and Visualization, https://mipav.cit.nih.gov
[10] Avants et al. A reproducible evaluation of ANTs similarity metric performance in brain image registration, Neuroimage, Volume 54, Issue 3, 1 February 2011, Pages 2033-2044.
[11] Avants et al. Symmetric diffeomorphic image registration with cross-correlation: Evaluating automated labeling of elderly and neurodegenerative brain. Med Image Anal. 2008 Feb;12(1):26–41.
Figures