1576
Voxel-wise Mahalanobis Distance (MaD-Vox): a multivariate approach to single subject analysis1Medical Physics, University of Wisconsin - Madison, Madison, WI, United States, 2Waisman Center, University of Wisconsin - Madison, Madison, WI, United States, 3Medical Physics, Psychiatry, University of Wisconsin - Madison, Madison, WI, United States
Synopsis
A voxel-wise multivariate analysis based on the Mahalanobis distance is presented. Upon implementation on simulated DTI data, the method demonstrates the ability to detect regions of pathology at an individual level with respect to a reference healthy control group. This multivariate approach could enhance the clinical value of diffusion weighted MRI in the assessment of individual patients with highly spatially heterogeneous brain conditions such as traumatic brain injury or autism spectrum disorder.
Introduction
Using diffusion tensor imaging (DTI) to explore brain abnormalities often involves group level analyses, assuming that abnormalities are similarly spatially distributed across individuals. However, this assumption may not be valid in conditions such as traumatic brain injury (TBI) or autism spectrum disorder (ASD)[1,2]. Recently, Kim et al., (2013), reported spatial patterns of abnormalities after mild TBI that were unique in each patient as revealed by a voxel-wise fractional anisotropy (FA) assessment by an enhanced Z-score analysis. More recently, Dean et al., (2017), reported the ability to discriminate individual autistic subjects from a typically developing cohort using the multivariate analog of the Euclidean distance known as the Mahalanobis distance, DM. Compared to traditional univariate analysis, the DM method demonstrated improved characterization performance by including information from a set of DTI measures in specific brain regions. Building on these two studies, this work proposes a method to characterize brain abnormalities at the individual level by a voxel-wise computation of the Mahalanobis distance between an individual and a reference group, thereby harnessing the voxel-wise approach ability for capturing spatial extent of pathology and the enhanced detection ability of multivariate analysis approaches. In a proof-of-concept implementation, simulation results demonstrate the ability of the method to identify regions of pathology in a subject specific manner.Methods
DTI data for controls and patients were simulated from an existing atlas [3] based on [4,5] with added Rician noise level (σn=10). Specific-region pathology was introduced by manipulating percent-changes in the main tensor Eigen values, λ1 and (λ2,λ3). At each voxel, DM between the DTI-feature-vector, X=(RD, AD, FA, MD), and the multivariate control-group-distribution was computed as DM=(X-μ)T∑-1(X-μ) with mean-vector μ and covariance matrix ∑ derived from the control group.
Four experiments were conducted:
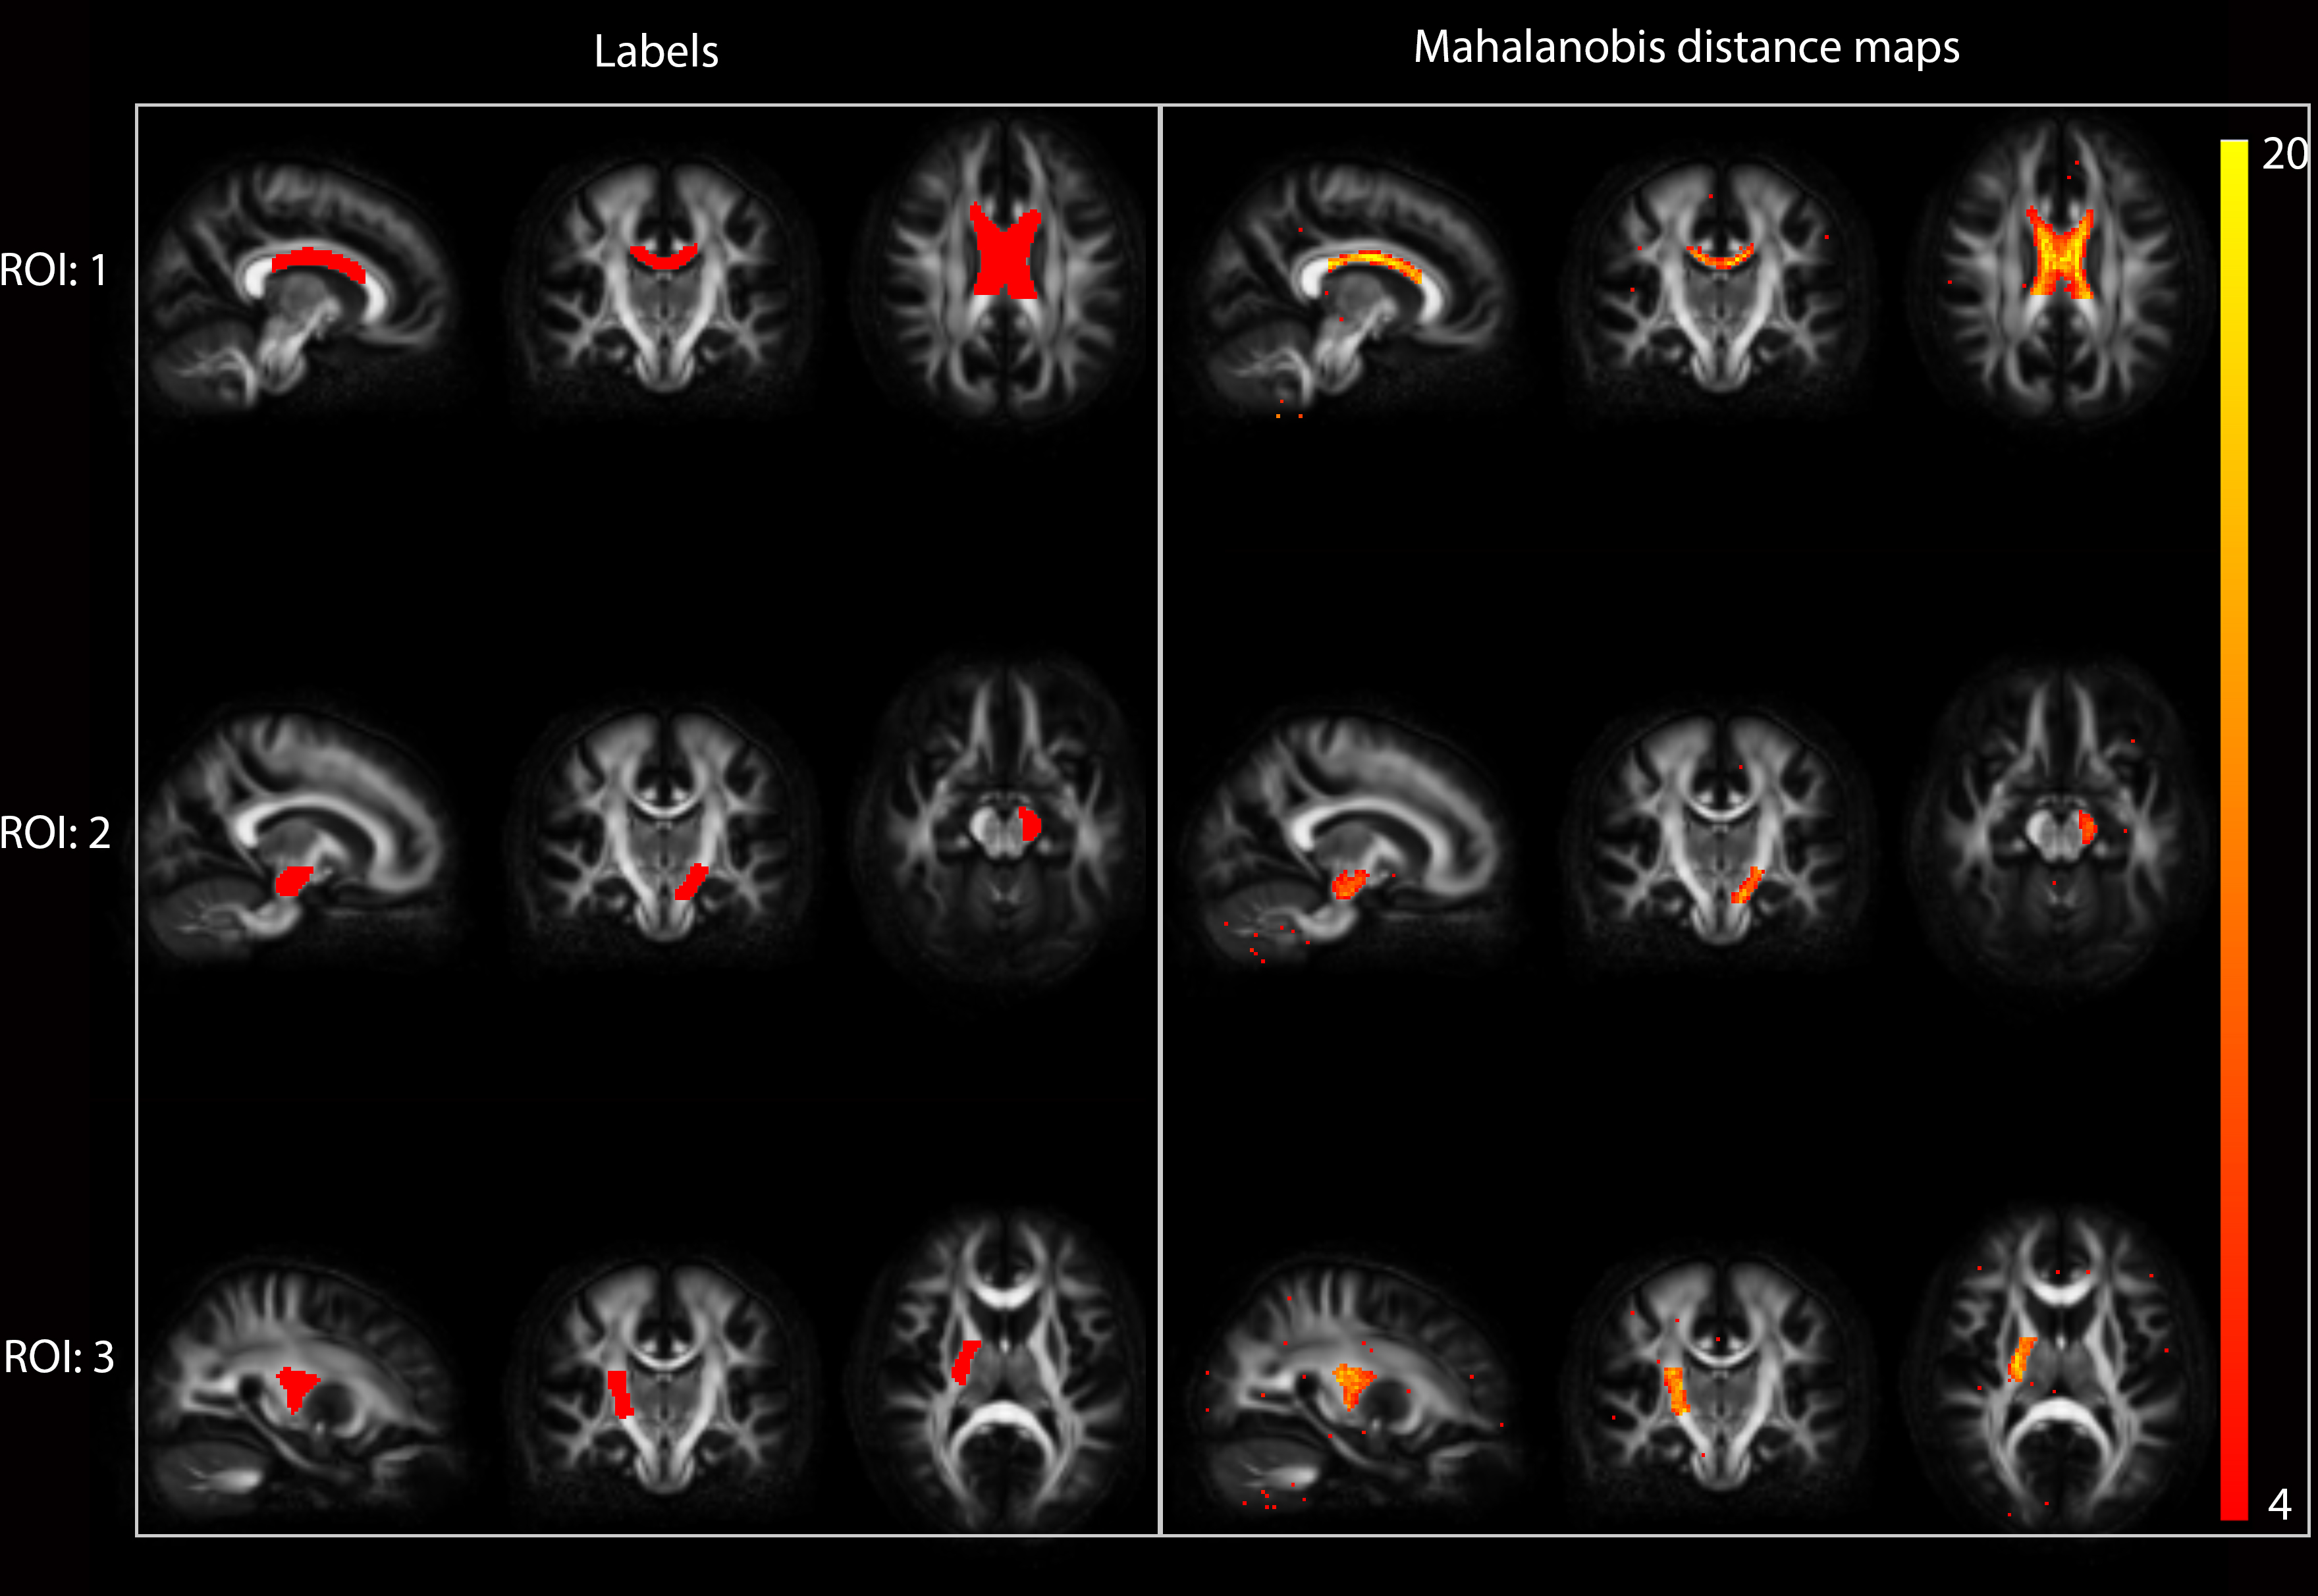
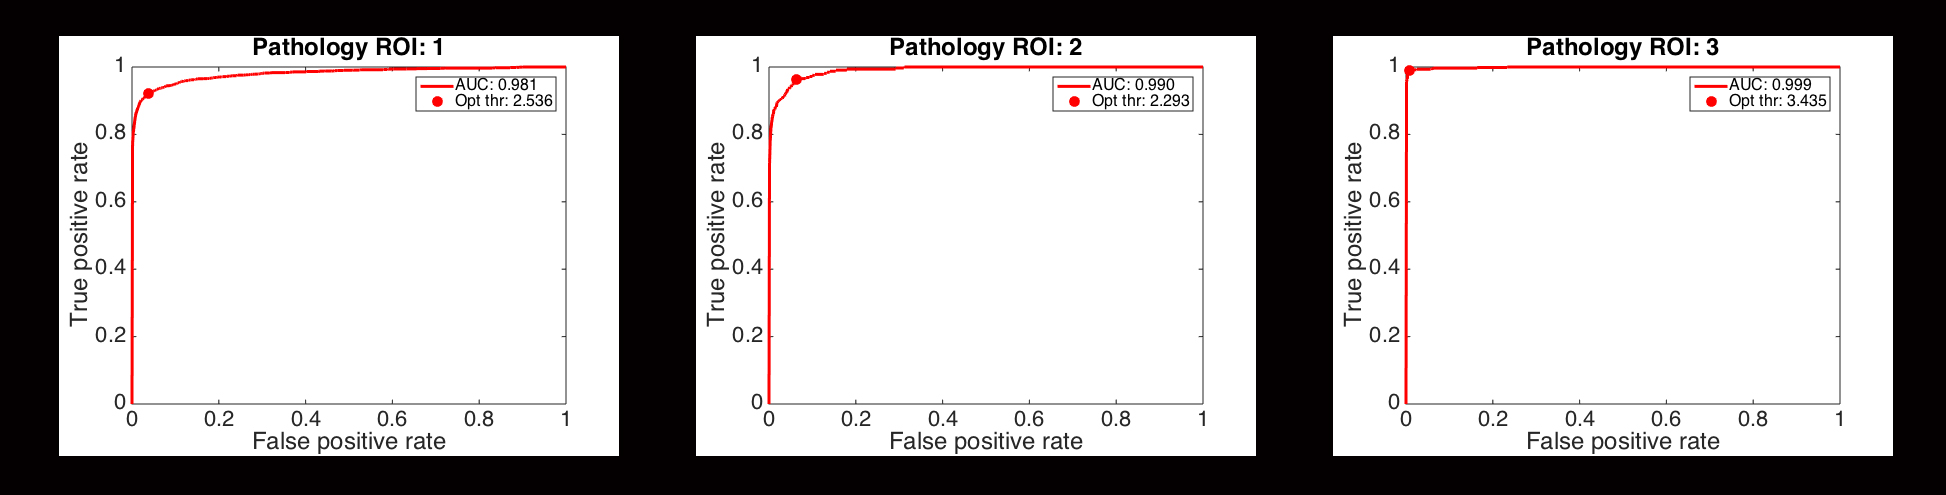
- Eighty healthy controls and three patients were simulated with pathology specified in three different regions of interest (ROIs) (Figure-1). Pathology was specified as 15%-λ1-decrease and 35%-(λ2,λ3)-increase. DM maps were obtained for each patient. Receiver operating characteristics (ROC) was used to determine the method's discrimination power and optimum-operating-thresholds.
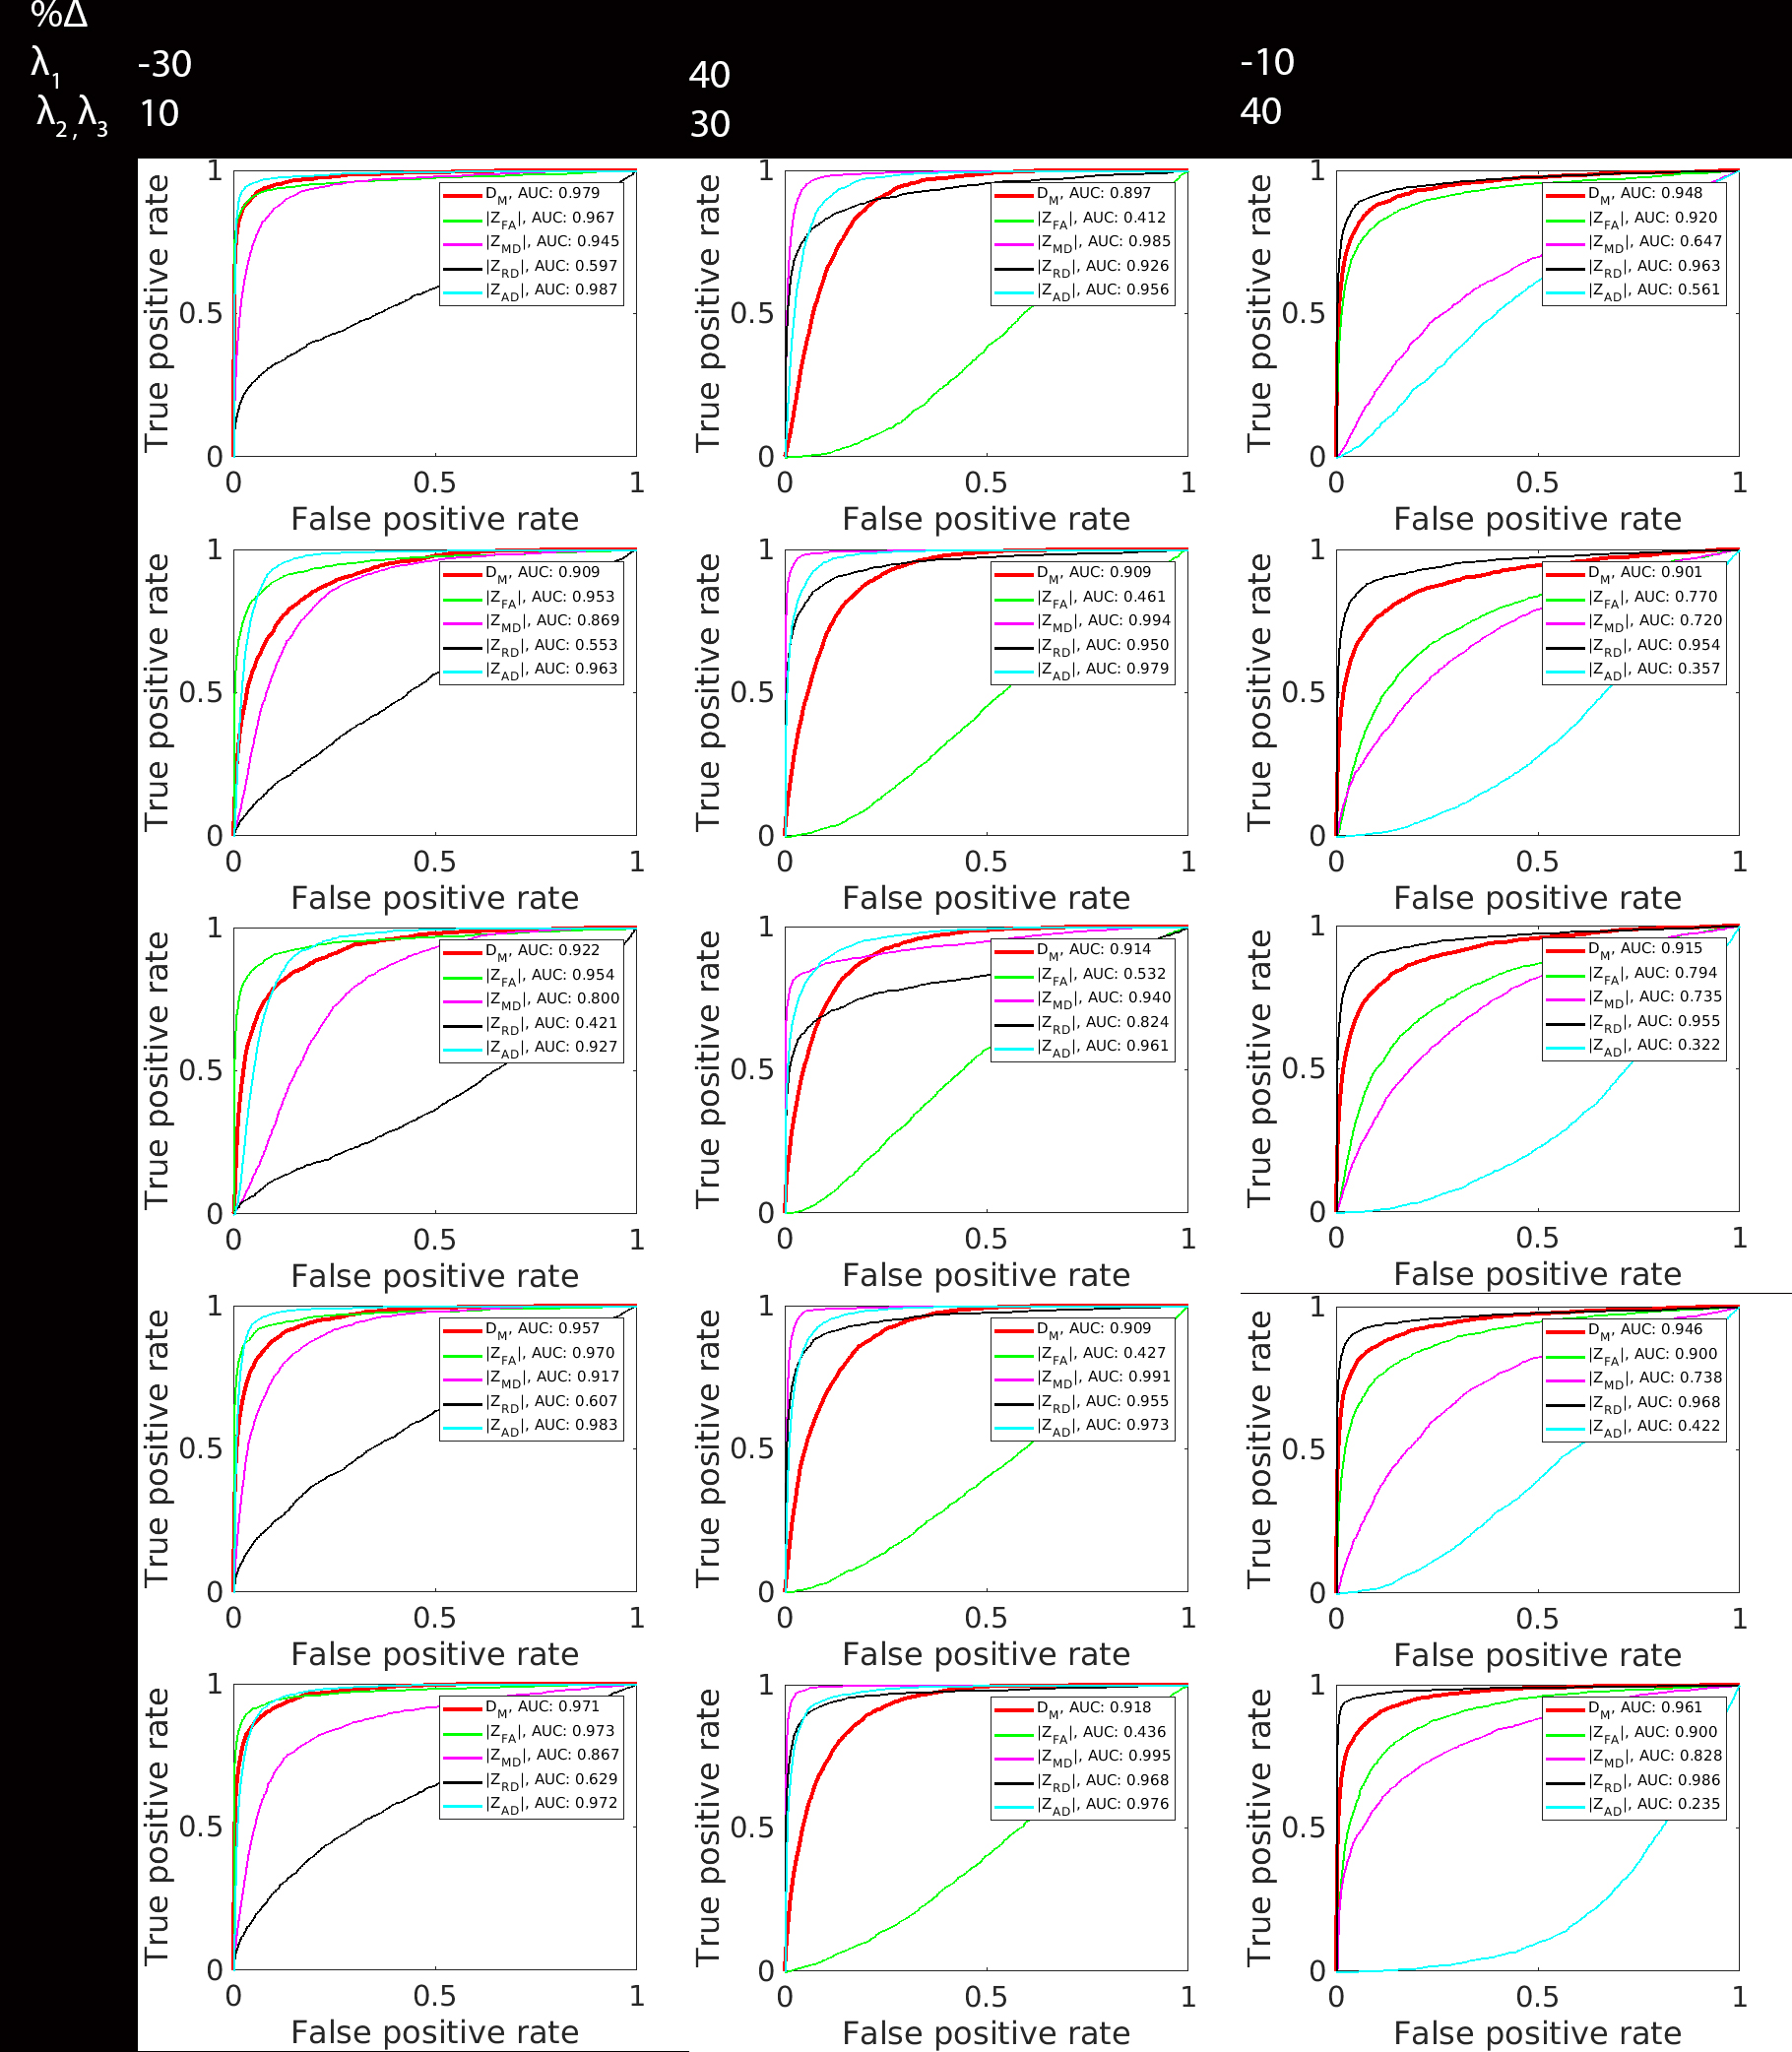
- Three groups of five patients were simulated. Each group presented pathology in one of the ROIs in Figure-1. For each group five pathology (λ2,λ3) settings (one for each patient) were selected from 0-40% with a 10% step-size. λ1 remained unchanged. Each patient was compared to the 80 controls by the DM method and by the Z-score for each of the DTI parameters. ROC curves were generated and the area under the curve (AUC) was obtained for each patient in order to evaluate the detection power between multivariate and univariate methods.
- Three different types of changes were designed to simulate pathology that would reflect changes in specific parameters: 30%-λ1-decrease, 10%-(λ2,λ3)-increase for most change in FA and AD; 40%-λ1-increase, 30%-(λ2,λ3)-increase for most change in MD (also RD and AD); 10%-λ1-decrease, 40%-(λ2,λ3)-increase for most change in RD. Five realizations for each type of change were simulated for the same ROI. Detection power behavior with type of change was evaluated with ROC analysis.
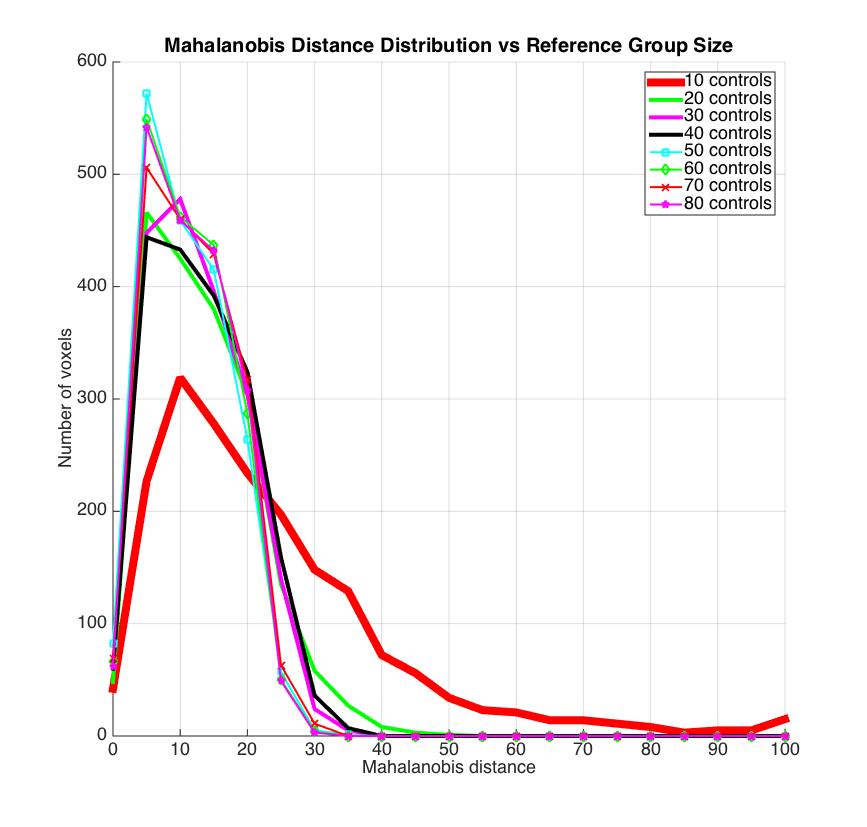
- Eight control groups were simulated: sizes 10-80 with 10 step-size. Reference group size effects on DM esimates was explored by comparing the ROI-1 patient in Figure-1 to each group. DM distributions in the pathology region were plotted for each of comparison.
Results
DM maps (Figures-1-2) demonstrate the method's ability to detect abnormal regions at the individual level. ROC analysis (Figure 3) indicates consistent increasing trends in the DM-method's discrimination power with increasing magnitude of change in λs, while univariate methods show less consistency. While the univariate methods detection behavior fluctuates with types of change (Figure-4), the multivariate method remains consistently sensitive. Small reference group sizes tend to produce inflated DM estimates (Figure-5) as seen in the wider spread of the distributions towards larger values for 10, 20, 30, and 40 control-group-size. The distributions for the larger groups demonstrate significant overlap indicating convergence of the DM estimates with increasing reference group size.Conclusion
The clinical value of quantitative MRI relies in its ability to assess patients individually. This proof-of-concept implementation demonstrates the feasibility of the MaD-Vox method to identify regions of pathology at the individual level. Future work will consist of optimizing the method in terms of controlling the Type I error rate and accounting for biases induced by reference group variability. The method will be implemented to classify TBI and ASD individuals, but it could be applied to other group level studies as well. Other parameters beyond DTI could be easily incorporated in the feature vector to provide additional insight.Acknowledgements
This work has received support from the National Science Foundation Graduate Research Fellowship under Grant No. DGE-1256259 and the Science and Medicine Scholars Graduate Research Fellowship.References
1. Kim, N., Branch, C.A., Kim, M., Lipton, M.L., 2013. Whole brain approaches for identification of microstructural abnormalities in individual patients: comparison of techniques applied to mild traumatic brain injury. PloS One 8, e59382. doi:10.1371/journal.pone.0059382
2. Dean, D.C., Lange, N., Travers, B.G., Prigge, M.B., Matsunami, N., Kellett, K.A., Freeman, A., Kane, K.L., Adluru, N., Tromp, D.P.M., Destiche, D.J., Samsin, D., Zielinski, B.A., Fletcher, P.T., Anderson, J.S., Froehlich, A.L., Leppert, M.F., Bigler, E.D., Lainhart, J.E., Alexander, A.L., 2017. Multivariate characterization of white matter heterogeneity in autism spectrum disorder. NeuroImage Clin. 14, 54–66. doi:10.1016/j.nicl.2017.01.002
3. http://fcon_1000.projects.nitrc.org
4. Van Hecke, W., Leemans, A., Emsell, L., 2016. DTI Analysis Methods: Voxel-Based Analysis, in: Van Hecke, W., Emsell, L., Sunaert, S. (Eds.), Diffusion Tensor Imaging: A Practical Handbook. Springer New York, New York, NY, pp. 183–203. doi:10.1007/978-1-4939-3118-7_10
5. Avants, B.B., Epstein, C.L., Grossman, M., Gee, J.C., 2008. Symmetric diffeomorphic image registration with cross- correlation: evaluating automated labeling of elderly and neurodegenerative brain. Med. Image Anal. 12, 26–41. doi:10.1016/j.media.2007.06.004
Figures
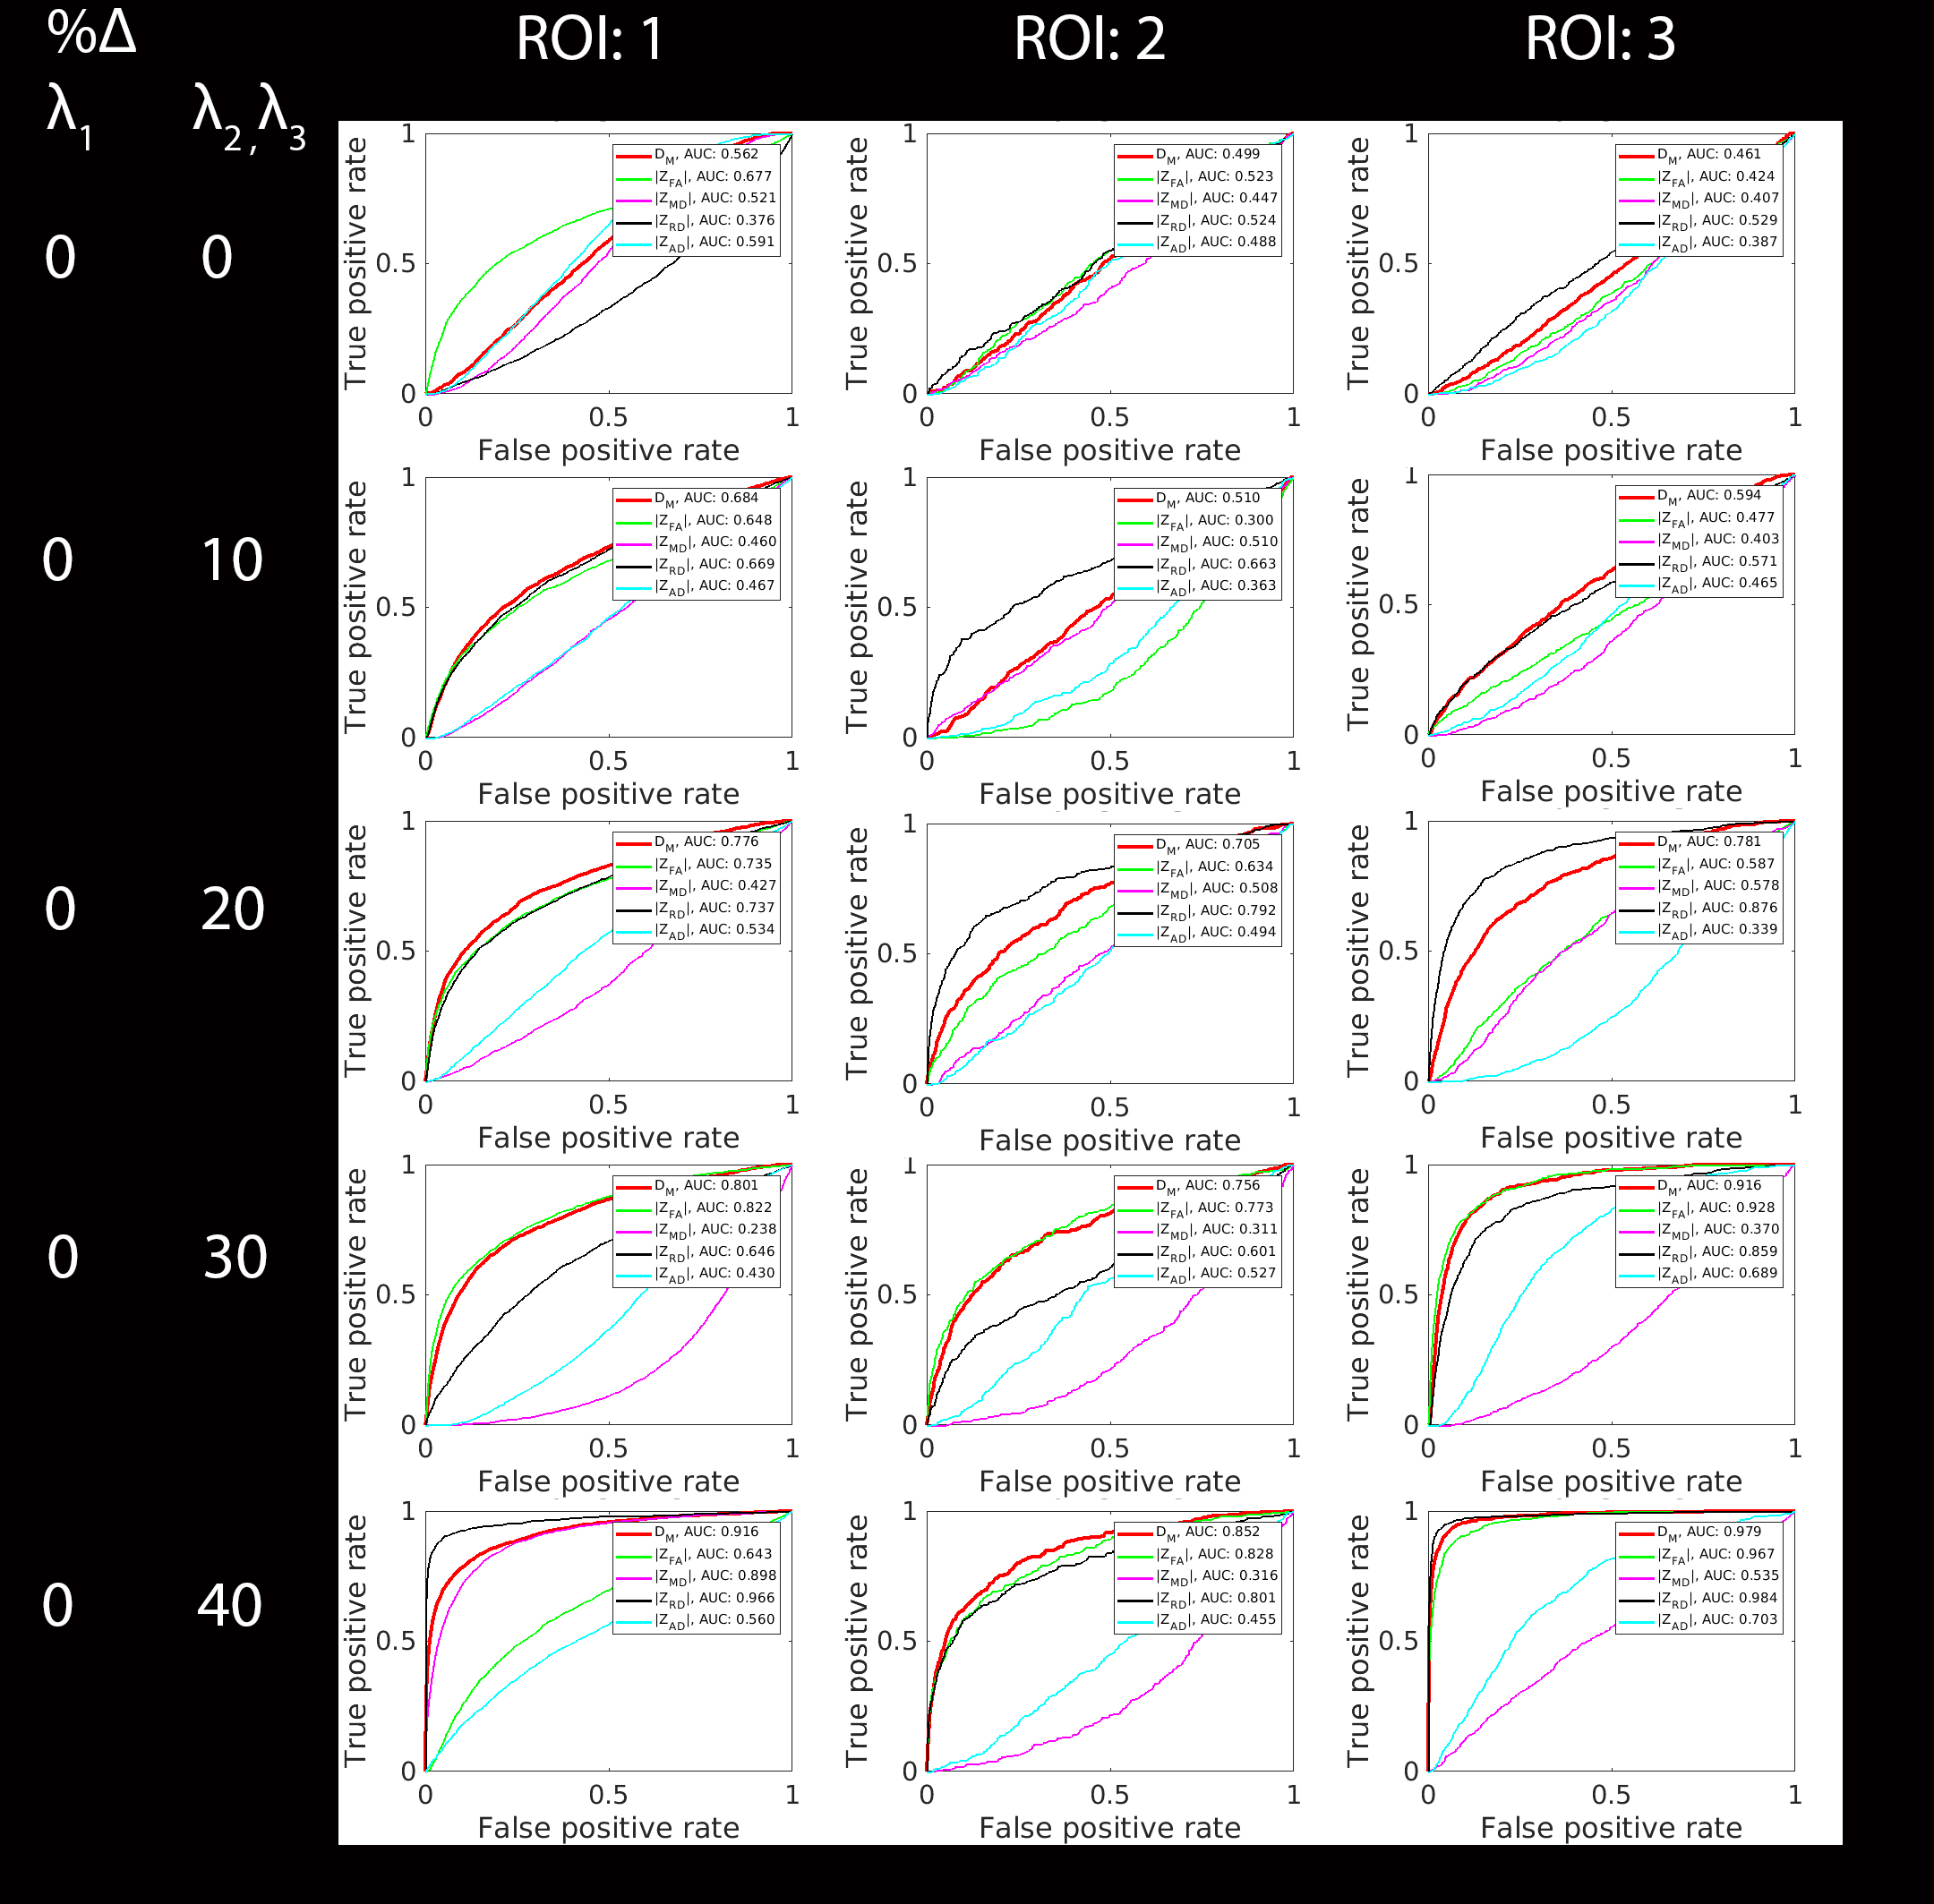
Comparison of detection performance between Mahalanobis distance and Z-score methods. ROC curves for classification by DM and the Z-score for FA, AD, RD, and MD are shown for 5 varying pathology inducing settings. Each setting was applied to each of the labels shown in Figure-1. This analysis indicates a dependence of the detection performance for the DM method on the magnitude of the induced change, with improving performance as the magnitude of the changes increases. Note that the multivariate method consistently outperforms 2-3 of the univariate methods.