1572
7T DIFFUSION MRI DATA QUALITY FROM 3T SCANNER DATA1Harvard Medical School, Boston, MA, United States, 2Brigham and Women's Hospital, Boston, MA, United States
Synopsis
Diffusion MRI (dMRI) data obtained from a 7T scanner has novel and improved microstructural tissue information missing from data acquired on 3T scanners. In this work, we propose to use deep Convolutional Neural Networks (CNN) that use rotation invariant spherical harmonic (RISH) features to map the dMRI data (the raw signal) between scanners without changing the fiber orientation. We validate our algorithm on 40 Human Connectome Project (HCP) subjects with scans on both 3T and 7T (10 training + 30 test). Our preliminary results on 30 test subjects shows that CNN can indeed reliably obtain 7T dMRI data quality from 3T scans.
Introduction
In recent years, enormous efforts have been made to improve the quality of MRI. Higher strength MR scanners (7T) have been employed to provide better contrast and resolution in diffusion-weighted (DW) imaging1,2,3,4. However, very few 7T scanners are currently available for research purposes. Recently, several machine learning methods have been proposed to boost the resolution and quality of 3T scanners5,6, or harmonize various dMRI sites7. However, none of these works have demonstrated their ability to obtain 7T-like dMRI data quality from 3T data. In this work, we propose to learn an efficient mapping of multi-shell dMRI signal with different spatial resolution and magnetic field strength (from 3T to 7T) using RISH features.Methods
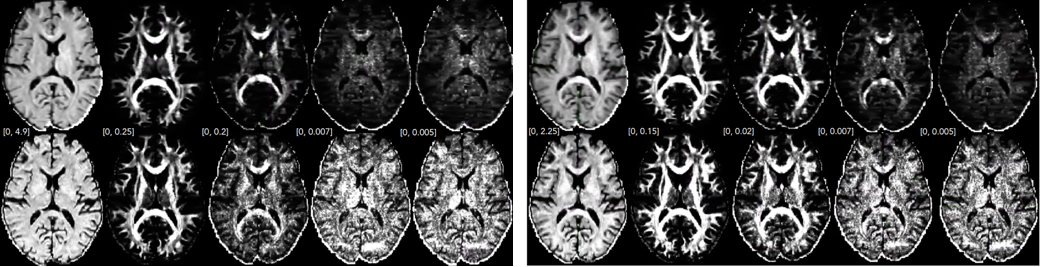
RISH Features: We represent the dMRI signal $$$\mathbf{S}$$$ in a basis of spherical harmonics (SH): $$$\mathbf{S}\approx\sum_{l}\sum_{m}C_{lm}Y_{lm}$$$ and construct five RISH features which can be scaled to modify the dMRI signal without changing the principal diffusion directions of the fibers7: $$\left|C_l\right|^2=\sum_{m=1}^{2m+1}C_{lm}^2~~~~~~~~~ [1]$$ for $$$l=\left\{0, 2,4,6,8\right\}$$$ (See Figure 1).
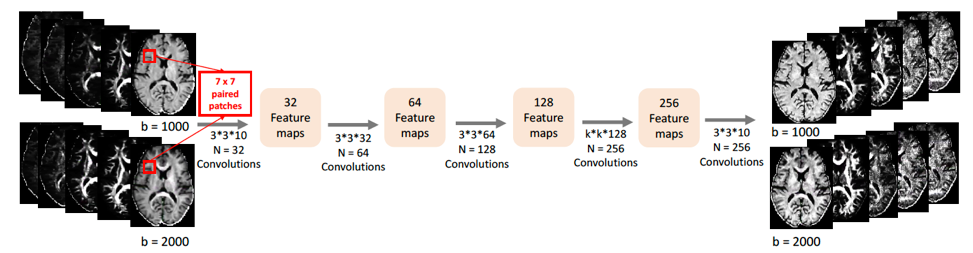
Patch-based non-linear mapping of RISH features from 3T to 7T using CNNs: Using 3T RISH features as input, our goal is to learn a nonlinear mapping of 3T to 7T as a patch-wise regression problem. Such mapping can be learned using the paired 3T and 7T RISH features of training data. To match the spatial resolution, we first upsample 3T DW volumes using 7th order B-spline interpolation. Then, we align 3T and 7T data as follows: First, we register b0 maps of 3T and 7T data through rigid registration8. The estimated transformation is then applied to each DW volume. Next, the gradient vectors are rotated using the rotation matrix estimated through rigid registration. After 3T and 7T DW data are aligned, we compute RISH features as in Eq. 1. We utilize a CNN with five convolutional layers to learn the non-linear mapping from 3T to 7T. Specifically, we used an $$$n\times n$$$ RISH feature patch to learn the mapping, where $$$n=7$$$ was used in this work. Figure 2 summarizes our deep CNN architecture. In each layer, RISH features are convolved with a $$$3 \times 3$$$ kernel with the number of $$$32$$$, $$$64$$$, $$$128$$$, $$$256$$$ and $$$256$$$ convolutional filters respectively. After each convolution step, ReLU operation is applied.
Results
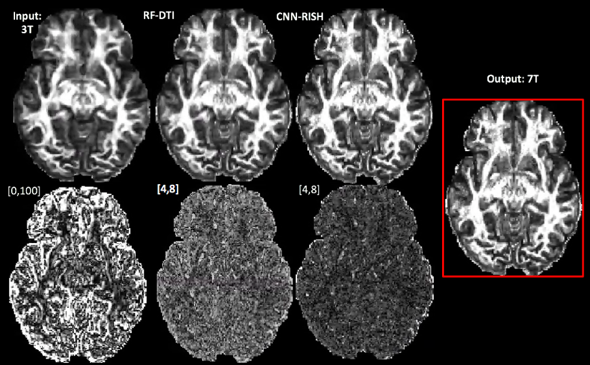
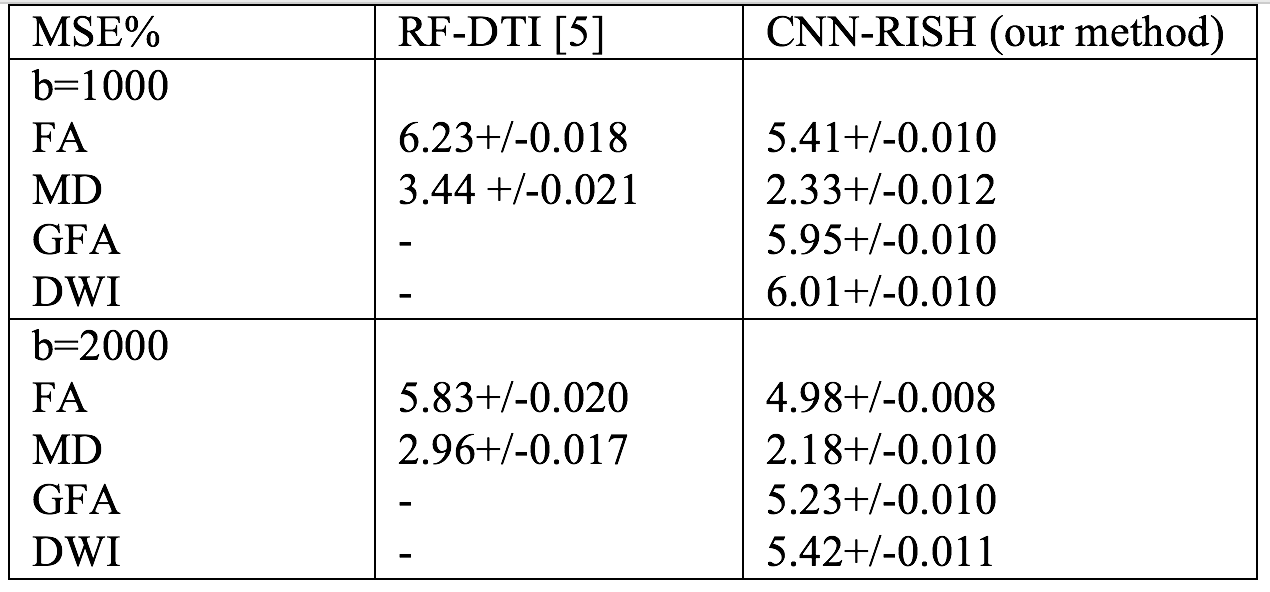
We used 10 HCP subjects as training subjects and another unseen 30 HCP subjects as test subjects with dMRI scans obtained from both 7T ($$$1.05\times1.05\times1.05mm^3$$$, two-shells: $$$b=\left\{1000, 2000\right\}$$$ and $$$65$$$ gradient directions) and 3T ($$$1.25\times1.25\times1.25mm^3$$$, three-shells: $$$b=\left\{1000, 2000, 3000\right\}$$$ and $$$90$$$ gradient directions) scanners9. We learned the mapping for $$$b=1000$$$ and $$$b=2000$$$ shells from 3T to 7T. Subject-specific mapping between 3T and 7T was obtained and the final signal was estimated using the scaled SH coefficients. We computed Fractional-Anisotropy (FA) and Mean-Diffusivity (MD) measures to compare the learning performance between our method (CNN-RISH) and RF-DTI5 which aims to learn DTI features using Regression Forests. Mean Squared Error (MSE) was computed for FA and MD between 7T data and our results in test subjects. Average accuracy and precision values in the estimation of FA, MD, generalized-FA (GFA) and DWI are given in Table 1. In Figure 3 top row, we depict the estimated FA results for $$$b=1000$$$ (Fig.3a) and $$$b=2000$$$ (Fig.3b). In the bottom row, we show the MSE maps in FA between the predicted data and the actual scanner acquired 7T data. Even though FA and MD are directly related to DTI, our method performed better when compared to RF-DTI. As seen in Table 1 and in Figure 3, our method gives the best performance with lowest error in several metrics (FA, GFA and dMRI signal error). Thus, our method is tissue model-independent and directly reconstructs the dMRI signal, which can then be used in further analysis.Discussion and Conclusion
In this paper, we present a CNN based non-linear regression method which learns the mapping of RISH features and consequently the dMRI signal from 3T to 7T scanner. Our validation results on 30 test subjects shows the efficacy of using this technique to gain new information about tissue structure present in the 7T data but not in 3T data. Further, the proposed approach is model-free and can be used to harmonize the raw dMRI data from 3T and 7T scanners. Both qualitative and quantitative results show that our method performs better when compared to RF-IQT. We note that this work is preliminary and extensive validation on different datasets is required to further understand the power and limitations of this technique.Acknowledgements
The authors would like to acknowledge the following grants which supported this work: R01MH102377, (PI: Dr. Marek Kubicki), R01MH097979 (PI: Dr. Yogesh Rathi).References
- Chilla GS, Tan CH, Xu C, Poh CL. Diffusion weighted magnetic resonance imaging and its recent trend—a survey. Quantitative Imaging in Medicine and Surgery. 2015;5(3):407-422.doi:10.3978/j.issn.2223-4292.2015.03.01.
- Sotiropoulos SN, Hernández-Fernández M, Vu T, Andersson JL, et al. Fusion in diffusion MRI for improved fibre orientation estimation: An application to the 3T and 7T data of the Human Connectome Project. NeuroImage, 2016;134:396-409.
- Polders DL, Leemans A, Hendrikse J, Donahue MJ, Luijten PR, Hoogduin JM. Signal to noise ratio and uncertainty in diffusion tensor imaging at 1.5, 3.0, and 7.0 Tesla. J. Magn. Reson. Imaging. 2011;33: 1456-1463. doi:10.1002/jmri.22554.
- Vu A, Auerbach E, Lenglet C, et al. High resolution whole brain diffusion imaging at 7 T for the Human Connectome Project. NeuroImage. 2015;122:318-331. doi:10.1016/j.neuroimage.2015.08.004.
- Alexander DC, Zikic D, Ghosh A, Tanno R, Wottschel V, Zhang J, Kaden E, Dyrby TB, Sotiropoulos SN, Zhang H, Criminisi A. Image quality transfer and applications in diffusion MRI. NeuroImage. 2017;152: 283-298. doi:10.1016/j.neuroimage.2017.02.089.
- Tanno R, Worrall DE, Ghosh A, et al. Bayesian Image QualityTransfer with CNNs: Exploring Uncertainty in dMRISuper-Resolution. MICCAI. 2017;611–619.
- Mirzaalian, H., Ning, L., Savadjiev, P. et al. Brain Imaging and Behavior (2017). https://doi.org/10.1007/s11682-016-9670-y.
- Avants BB, Tustison NJ, Song G, Cook PA, Klein A, Gee JC. A Reproducible Evaluation of ANTs Similarity Metric Performance in Brain Image Registration. NeuroImage. 2011;54(3):2033-2044. doi:10.1016/j.neuroimage.2010.09.025.
- Van Essen DC, Smith SM, Barch DM, et al. The WU-Minn Human Connectome Project: An Overview. NeuroImage. 2013;80:62-79. doi:10.1016/j.neuroimage.2013.05.041.
Figures