1571
Linking neurocognitive measures with whole brain structure using Diffusion ODFs in the HCP dataset1Center for Advanced Imaging Innovation and Research (CAIR), NYU School Of Medicine, New York, NY, United States, 2Center for Biomedical Imaging, Dept of Radiology, NYU School Of Medicine, New York, NY, United States, 3Dept of Psychiatry, NYU School Of Medicine, New York, NY, United States
Synopsis
Higher dimensional diffusion protocols are now routinely acquired in large-scale studies. While these diffusion data sets contain a wealth of information about white matter architecture, this information is not fully exploited when their dimensionality is reduced to simplify statistical correlations with neurocognitive markers over the whole brain. To overcome this limitation, we analyze the full Orientation Distribution Function (ODF) at each voxel using a Low-Rank plus Sparse decomposition to identify key ODF features. We use this approach to link neurocognitive measures to brain structure in a cohort of healthy Human Connectome Project volunteers.
Purpose
Recent advances in MRI acquisition$$$^{1,2}$$$ make it possible to include high quality diffusion weighted protocols (multi-shell, large number of gradient directions) in large-population explorations of human behavior$$$^{3,4}$$$. Statistical analysis of such data often reduce their dimensionality (e.g., FA-based analysis) to ease correlation with neurocognitive markers across the whole brain$$$^{5}$$$. While such simplified analysis have indeed detected more obvious group differences; they, however, do not fully capitalize on all acquired image volumes. Other, more powerful, whole brain analysis methods employ tractography to identify structurally connected fiber populations globally$$$^{6}$$$ or locally$$$^{7}$$$. Tractography, however, has known limitations$$$^{8}$$$, and since it depends on identified fiber directions, it might discard other features of the ODF.
Here, we use a statistical analysis method, dubbed ODF L+S, which operates on the full Orientation Distribution Functions (ODF) at each voxel$$$^{9}$$$. This approach takes full advantage of the available diffusion information and avoids outlier bias by identifying features of the ODF that are consistent across a subject pool while, at the same time, discarding an individual’s variation via the use of Low-Rank plus Sparse (L + S) matrix decomposition$$$^{10-12}$$$. In the Human Connectome Project (HCP) dataset we localize the correlations of brain structure with neurocognitive measures for episodic memory$$$^{13}$$$ and language tasks$$$^{14}$$$ with the ODF L+S approach.
Methods
In vivo healthy subject MRI datasets were downloaded from the HCP consortium led by Washington University, University of Minnesota and Oxford University$$$^{3}$$$: 355 subjects from the December 2015 release (S900, 180/175 female/male, 28.2±3.9y/o); preprocessed$$$^{15}$$$ diffusion MRI (monopolar gradient pulse sequence; 6b0 and 270 q-space samples on three shells, b=1000,2000,3000s/mm2, TR/TE=5500/89.50ms, 1.25mm isotropic, simultaneous multi-slice acceleration of 3; acquired on Siemens 3T Skyra with 100mT/m gradients). We further selected neurocognitive measurements from the HCP Data Dictionary$$$^{16}$$$ relating to episodic memory (NIH Toolbox Picture Sequence Memory Test PicSeq_AgeAdj$$$^{13}$$$) and to language and vocabulary comprehension and decoding (NIH Toolbox Picture Vocabulary Test PicVocab_AgeAdj and Oral Reading Recognition Test ReadEng_AgeAdj$$$^{14}$$$). Diffusion weighted images were reconstructed to diffusion ODFs and registered to the MNI-atlas$$$^{17}$$$ (as included with FSL) with the generalized q-space diffeomorphic reconstruction$$$^{18,19}$$$ (DSIStudio). Tractography was performed with a modified streamline tracking algorithm and images were generated with Matlab and DSIStudio.
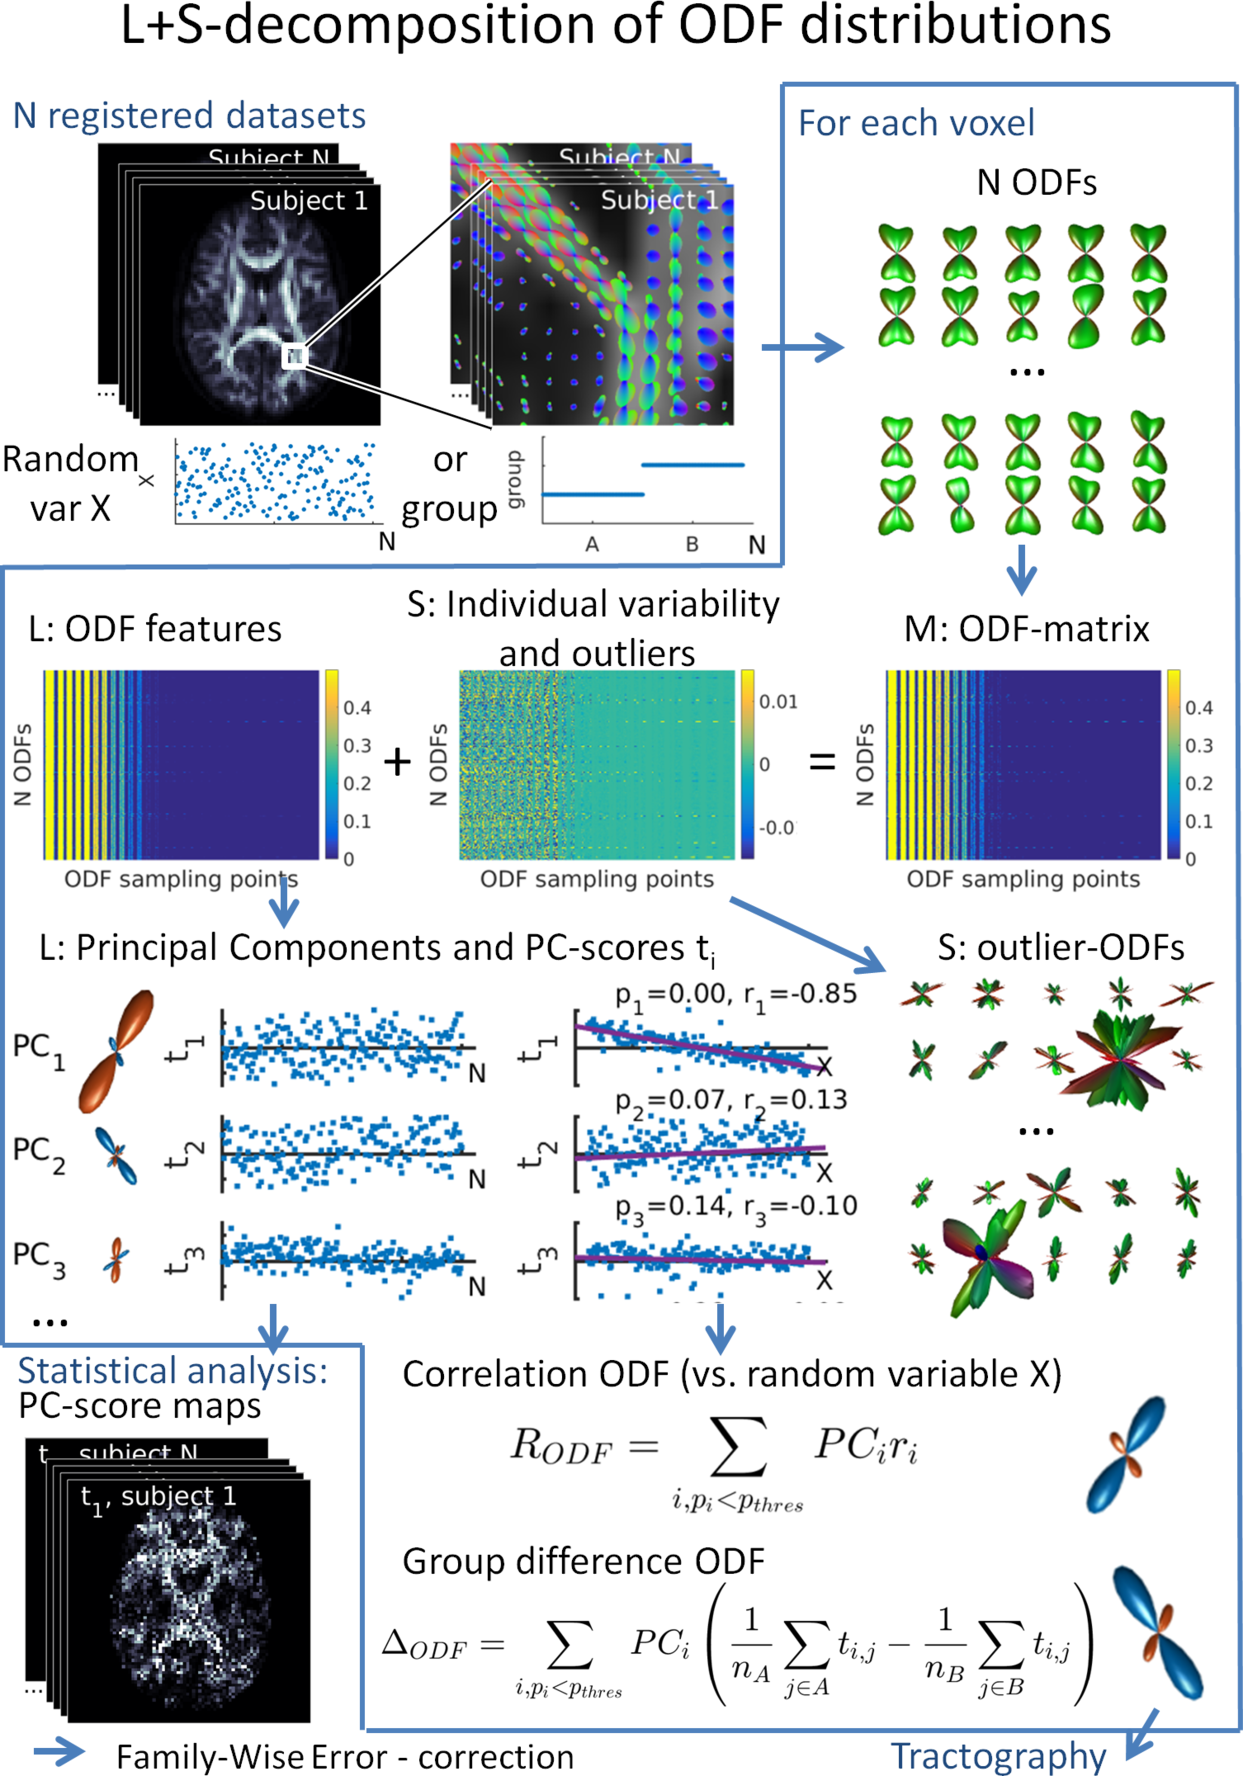
For statistical analysis, the registered ODFs of each voxel are reorganized into a matrix M (1 ODF per row, Fig 1), which is decomposed into a low-rank matrix L and a sparse matrix S$$$^{10-12}$$$ as previously described$$$^{9}$$$. The L+S decomposition estimates ODF features common/different within/between groups by minimizing the rank of L, whilst separating the sparse individual variability and outliers in S (Fig 1). Here, the decomposition is solved using the Robust PCA via Nonconvex Rank Approximation algorithm$$$^{20}$$$ which employs a non-convex approximation of the true matrix rank of L rather than the more common nuclear norm ($$$\lambda=1/\sqrt{n}$$$, $$$\mu=0.9$$$). The latter over-penalizes larger singular values, a bias avoided by using a non-convex rank estimate$$$^{20}$$$. The Principal Component (PC) scores of L are used to correlate ODF features (Principal Components $$$PC_i$$$) with independent variables. Multiple comparisons in whole brain analysis are corrected with the Threshold-Free Cluster Enhancement Method (TFCE$$$^{21}$$$) while age and sex are included as nuisance variables. Significant correlations are used to calculate correlation ODFs $$$R_{ODF}$$$ (Fig. 1) which serve as input for tractography.
Results and Discussion
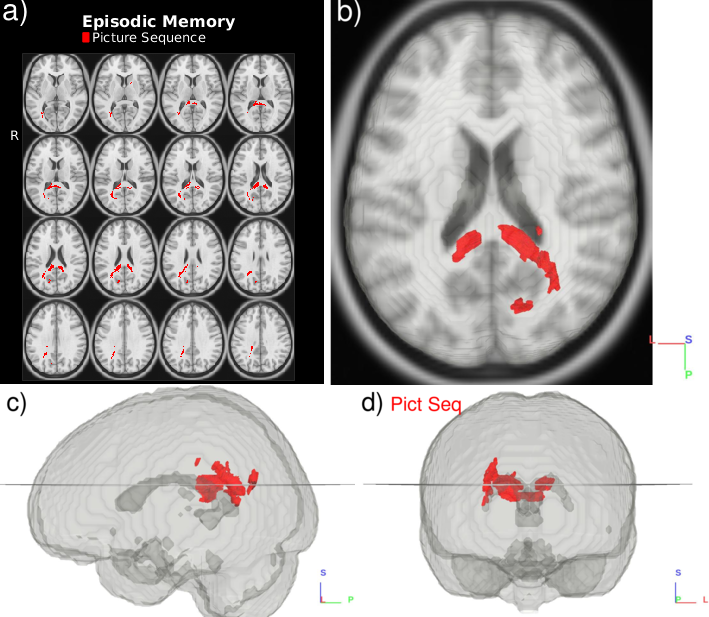
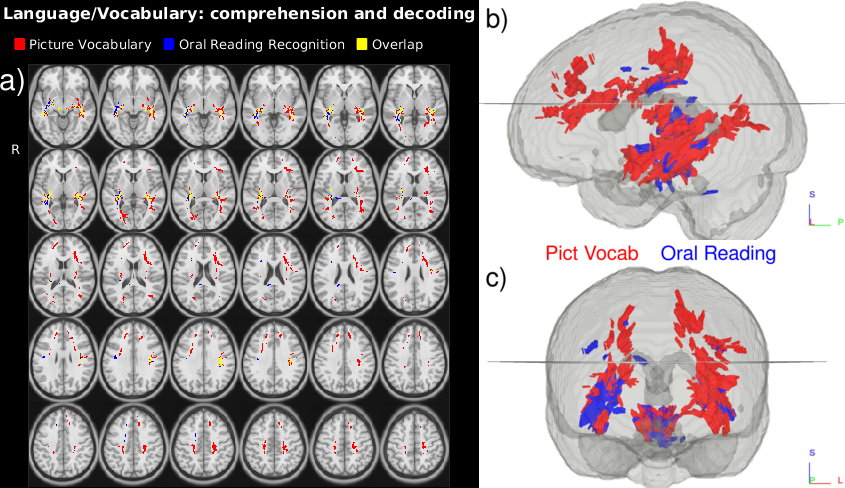
Several Principle Components of the HCP ODFs correlate with the selected neurocognitive measures (Fig. 2 and 3.). Language recognition and comprehension tasks (Fig. 2) relate to ODFs in areas identified by fMRI work$$$^{22}$$$: posterior superior temporal gyrus and inferior frontal gyrus connected by stretches of the arcuate fasciculus pathway/superior longitudinal fasciculus III. Besides these areas, language comprehension also relates with ODFs in the medial frontal gyri and the left precuneus$$$^{23}$$$. Our analysis (Fig. 3) further connects the Episodic Memory measure with areas which have been shown to deactivate in episodic memory tasks$$$^{24}$$$: the posterior cingulate and precuneus. The expected correlations$$$^{24}$$$ in the medial temporal cortex are however not found. Besides areas previously indicated by fMRI work, the ODF L+S approach also identifies tracts connecting the involved regions (Fig. 3).Conclusion
ODF L+S for analyzing whole brain diffusion capitalizes on all acquired diffusion weightings in high quality datasets (multi-shell, large number of gradient directions) for population-based studies to detect correlations of brain structure with neurocognitive measures. The results may help in interpreting the functioning of healthy and diseased brains.Acknowledgements
This project is supported in part by PHS grants R01-CA111996, R01-NS082436 and R01-MH00380. Data were provided by the Human Connectome Project, WU-Minn Consortium (Principal Investigators: David Van Essen and Kamil Ugurbil; 1U54MH091657) funded by the 16 NIH Institutes and Centers that support the NIH Blueprint for Neuroscience Research; and by the McDonnell Center for Systems Neuroscience at Washington University.References
[1] Setsompop, K. (2012), ‘Blipped-Controlled Aliasing in Parallel Imaging for Simultaneous Multislice Echo Planar Imaging With Reduced g-Factor Penalty’, Magn. Reson. Med., vol. 67, pp. 1210-1224.
[2] Baete, S.H. (2017), ‘Accelerated Radial Diffusion Spectrum Imaging Using a Multi-Echo Stimulated Echo Diffusion Sequence’, Magn Reson Med., published online.
[3] Van Essen, D.C. (2013). ‘The WU-Minn Human Connectome Project: An overview.’ NeuroImage, vol 80, pp. 62-79.
[4] Miller, K.L. (2016), ‘Multimodal population brain imaging in the UK Biobank prospective epidemiological study’, Nature Neurosc., vol. 19, pp. 1523.
[5] Jbabdi, S. (2010), ‘Crossing fibres in tract-based spatial statistics’, NeuroImage, vol. 46, pp. 246-56.
[6] Raffelt, D.A. (2015), ‘Connectivity-based fixel enhancement:Whole-brain statistical analysis of diffusion MRI measures in the presence of crossing fibres’, NeuroImage, vol 117, pp. 40-55.
[7] Yeh, F-C. (2015), 'Connectometry: A statistical approach harnessing the analytical potential of the local connectome', NeuroImage, vol 125, pp. 162-171.
[8] Jones D.K. (2013), ‘White matter integrity, fiber count, and other fallacies: The do's and don'ts of diffusion MRI’, NeuroImage, vol 73, pp. 239-254.
[9] Baete, S (2017), 'Low Rank plus Sparse Decomposition of ODF Distributions: Whole brain Statistical Analysis of Higher Order Diffusion Datasets', Proc. Intl. Soc. Magn. Reson. Med., vol 24, p1800.
[10] Yuan X. (2009), ‘Sparse and Low-Rank Matrix Decomposition Via Alternating Direction Methods’, Optimization Online. November 2009.
[11] Candes, E.J. (2011), 'Robust Principal Component Analysis', Journal of the ACM, vol. 58, No 3, Art 11.
[12] Otazo, R. (2015), 'Low-Rank Plus Sparse Matrix Decomposition for Accelerated Dynamic MRI with Separation of Background and Dynamic Components', Magn. Reson. Med., vol. 73, pp. 1125-36.
[13] Dikmen, S.S. (2014), ‘Measuring episodic memory across the lifespan: NIH Toolbox Picture Sequence Memory Test’, J Int Neuropsychol Soc., vol 20, pp. 611-9.
[14] Gershon R. C. (2014), ‘Language measures of the NIH Toolbox Cognition Battery’, J Int Neuropsychol Soc., vol 20, pp. 642-51.
[15] Glasser M. F. (2013), ‘The minimal preprocessing pipelines for the Human Connectome Project’, Neuroimage, vol 80, pp. 105-24.
[16] https://wiki.humanconnectome.org/display/PublicData/HCP+Data+Dictionary+Public-+500+Subject+Release
[17] Mazziotta J. (2001), ’A probabilistic atlas and reference system for the human brain: International Consortium for Brain Mapping (ICBM)’, Phil. Trans. R. Soc. Lond. B., vol 256, pp. 1293-1322.
[18] Yeh, F.C (2010), ‘Generalized q-Sampling Imaging’, IEEE Transactions on Medical Imaging, vol. 29, no. 9, pp. 1626-35.
[19] Yeh F.-C. (2011), ‘NTU-90: A high angular resoluiton brain atlas constructed by q-space diffeomorphic reconstruction’, NeuroImage, vol. 58, pp. 91-99.
[20] Kang Z. (2015), ‘Robust PCA via Nonconvex Rank Approximation in IEEE International Conference on Data Mining (ICDM)(Atlantic City, NJ,USA), pp. 211-220.
[21] Smith S.M. (2009), ‘Threshold-free cluster enhancement: Addressing problems of smoothing, threshold dependence and localisation in cluster inference’, NeuroImage, vol 44, pp. 83-98.
[22] Berl, M.M. (2010), ‘Functional anatomy of listening and reading comprehension during development’, Brain Lang, vol 114, pp. 115-25.
[23] Schmithorst, V.J. (2007), ‘Object identification and lexical/semantic access in children: a functional magnetic resonance imaging study of word-picture matching’, Hum Brain Mapp, vol. 28, pp 1060-74.
[24] Dickerson, B.C. (2010), ‘The episodic memory system: neurocircuitry and disorders’, Neuropshychopharmacology, vol. 35, pp. 86-104.
Figures