1570
Tissue-Encoded Colour Fluid-Attenuated Inversion Recovery (TEC-FLAIR) map: contrast fusion designed for improved characterisation of white matter lesion heterogeneity1The Florey Institute of Neuroscience and Mental Health, Melbourne, Australia, 2The Florey Department of Neuroscience, University of Melbourne, Melbourne, Australia
Synopsis
FLAIR MR images feature striking contrast, allowing easy identification of white matter hyperintense lesions. While such lesions have been explained by a range of microstructural characteristics, FLAIR itself doesn't provide specificity to distinguish these heterogeneous origins. 3-tissue CSD techniques resolve white matter (WM), grey matter (GM) and CSF compartments. In lesions, GM-like and CSF-like diffusion-weighted signals have been hypothesised to be related to certain origins, e.g. gliosis or increased interstitial fluid. We propose a fusion of 3-tissue encoded colours and FLAIR via panchromatic sharpening techniques, designed for improved characterisation of white matter lesion heterogeneity.
Purpose
Fluid-attenuated inversion recovery (FLAIR) MR images feature strong T2-weighted contrast while nulling signal from cerebrospinal fluid (CSF), which has proven useful in assessing several central nervous pathologies[1–11]. While white matter hyperintensities (WMHs) have been explained by a range of microstructural characteristics[12–18], the FLAIR contrast doesn't provide specificity to distinguish these heterogeneous origins[17].
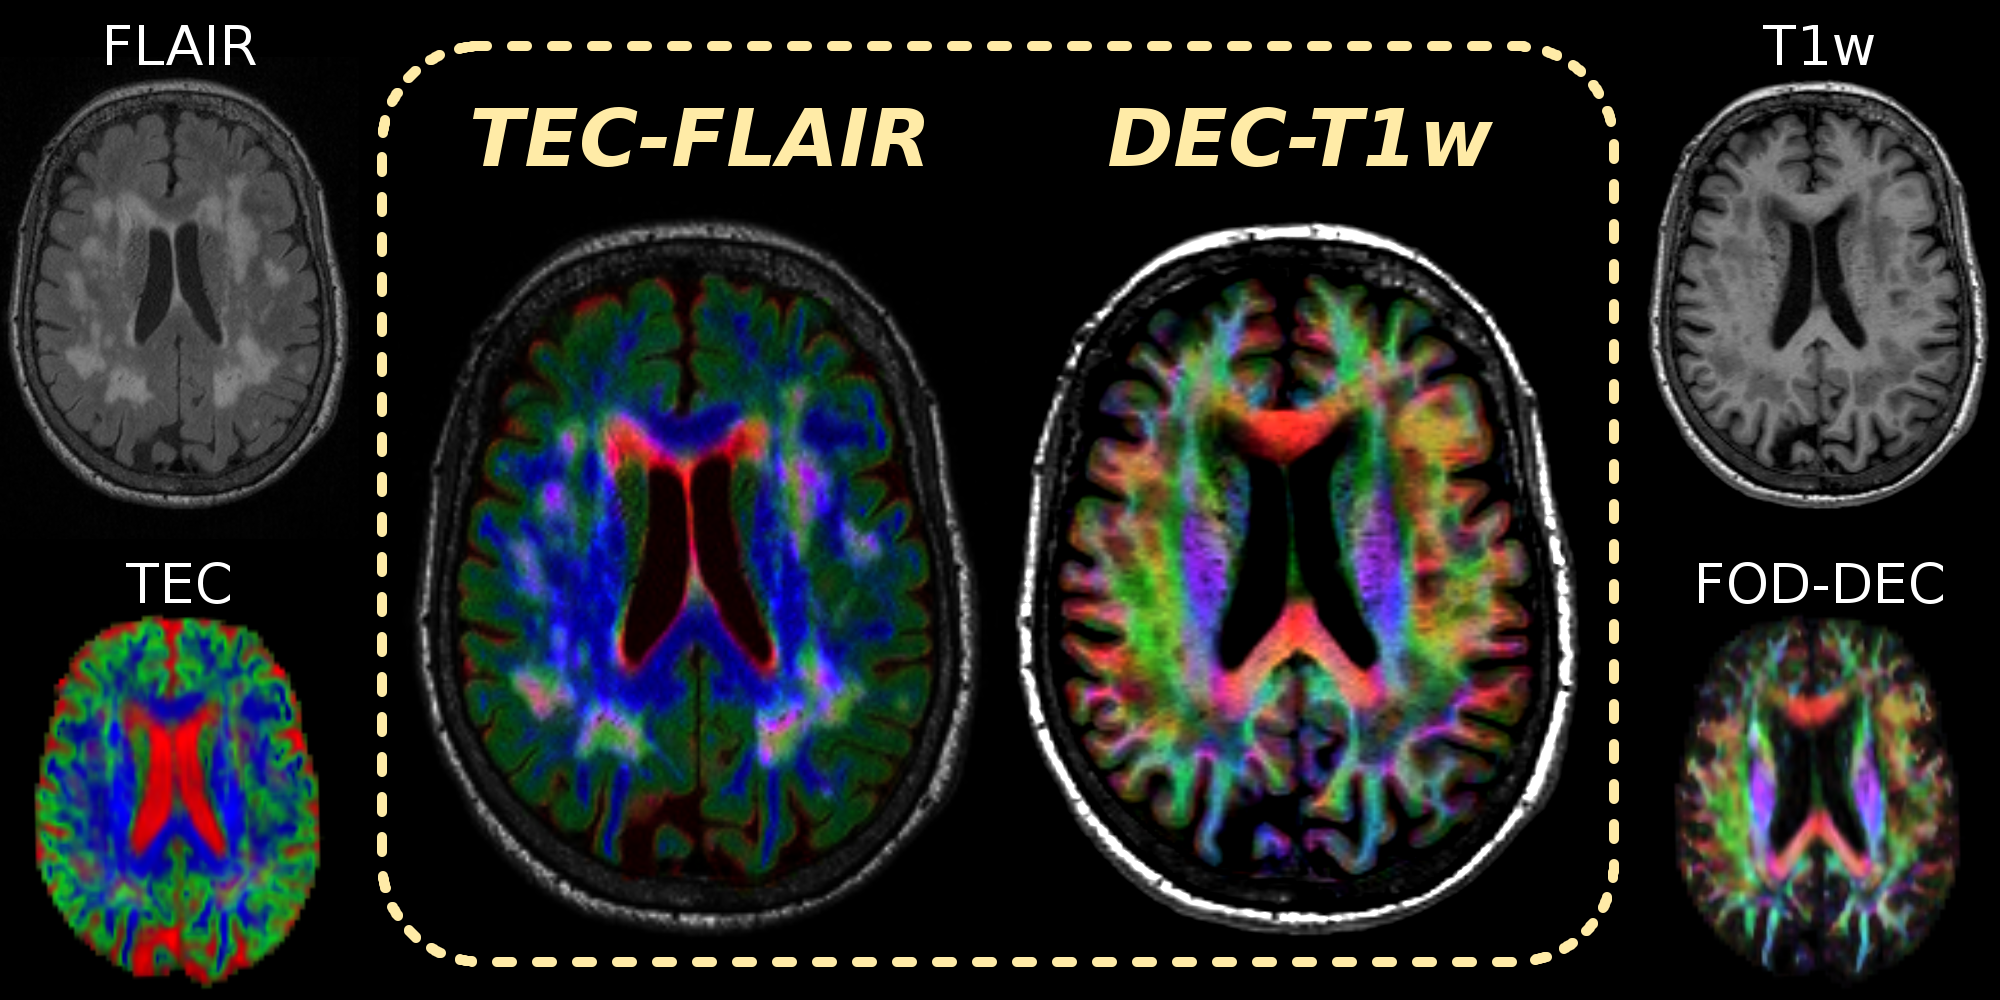
Constrained spherical deconvolution (CSD)[19] of the diffusion-weighted imaging (DWI) signal aims to resolve a white matter (WM) fibre orientation distribution (FOD) in each voxel. Multi-shell multi-tissue CSD (MSMT-CSD)[20] and single-shell 3-tissue CSD (SS3T-CSD)[21] resolve additional grey matter (GM) and CSF compartments. In WMH lesions, GM/CSF-like DWI signals were found to provide extra specificity: CSF-like signals relate to interstitial fluid, GM-like signals may indicate gliosis[22]. Heterogeneous contrast of WM/GM/CSF-like signals can be visualised by a tissue-encoded colour (TEC) map (Fig.1).
In this work, we designed a map featuring fusion of TEC and FLAIR contrasts, using a technique akin to panchromatic sharpening[23], which has successfully been used before to fuse FOD-based directionally-encoded colour (DEC) information[24] and T1-weighted anatomical contrast (Fig.1).
Data and Preprocessing
DWI-data of a healthy elderly subject were acquired using a Siemens 3T Trio, voxel size 2.3×2.3×2.3mm³, b=3000s/mm², 60 gradient directions, 8 b=0 images. A FLAIR-image (0.9×1×1mm³) and T1w-image (1.2×1×1mm³) were also acquired (Fig.1). All data were corrected for motion/distortions[25], bias-fields[26] and susceptibility-induced distortions (in-house method).
3-tissue response functions were estimated from the DWI-data using an unsupervised method[27]. DWI-data were up-sampled to 1.15×1.15×1.15mm³ and SS3T-CSD[21] was performed, resulting in WM-like, GM-like and CSF-like compartments (Fig.1).
Designing an effective TEC-FLAIR map
We resampled the TEC-map to the grid of the FLAIR-image and normalised the tissue compartments to sum to 1, so only relative tissue contributions are encoded in the red-green-blue (RGB) components (Fig.2A, top). This RGB-map is directly weighted by the FLAIR-image (Fig.1) to obtain a first attempt at TEC-FLAIR contrast (Fig.2A, bottom). However, the WMH lesions are hard to identify in this attempted TEC-FLAIR. Due to the normalisation–which essentially uses an L1-norm–mixtures of colours appear visually darker. This happens in particular in the lesions (complex mixture of tissues), counteracting the FLAIR contrast.
A step towards solving this issue consists of using the L2-norm for normalisation instead (as is inherently done in DEC maps[22,23]), which relatively brightens mixtures and darkens more primary colours. While this helps lesions stand out slightly better (Fig.2B), the TEC-FLAIR remains hard to navigate due to strong differences in relative luminance of red, green and blue.
Without going into details, a reasonable solution is to use a weighted Lp-norm for normalisation:
$$\sqrt[2.2]{0.2126\cdot{R}^{2.2}+0.7152\cdot{G}^{2.2}+0.0722\cdot{B}^{2.2}}$$
This essentially accounts for effects of relative luminance of RGB-encoded colours and assumes a gamma-value of 2.2 (which is typical for computer- and TV-screens). The resulting RGB-map (Fig.2C, top) has chrominance contrast only; hence, the luminance of the TEC-FLAIR (Fig.2C, bottom) uniquely describes the FLAIR contrast.
Finally, further improvement of visual contrast is possible by gamma-correction of the luminance channel (FLAIR-image) itself: we chose a gamma-value of 2 for this purpose (Fig.2D, top). The final TEC-FLAIR map is shown in Fig.2D, bottom.
Results and Discussion
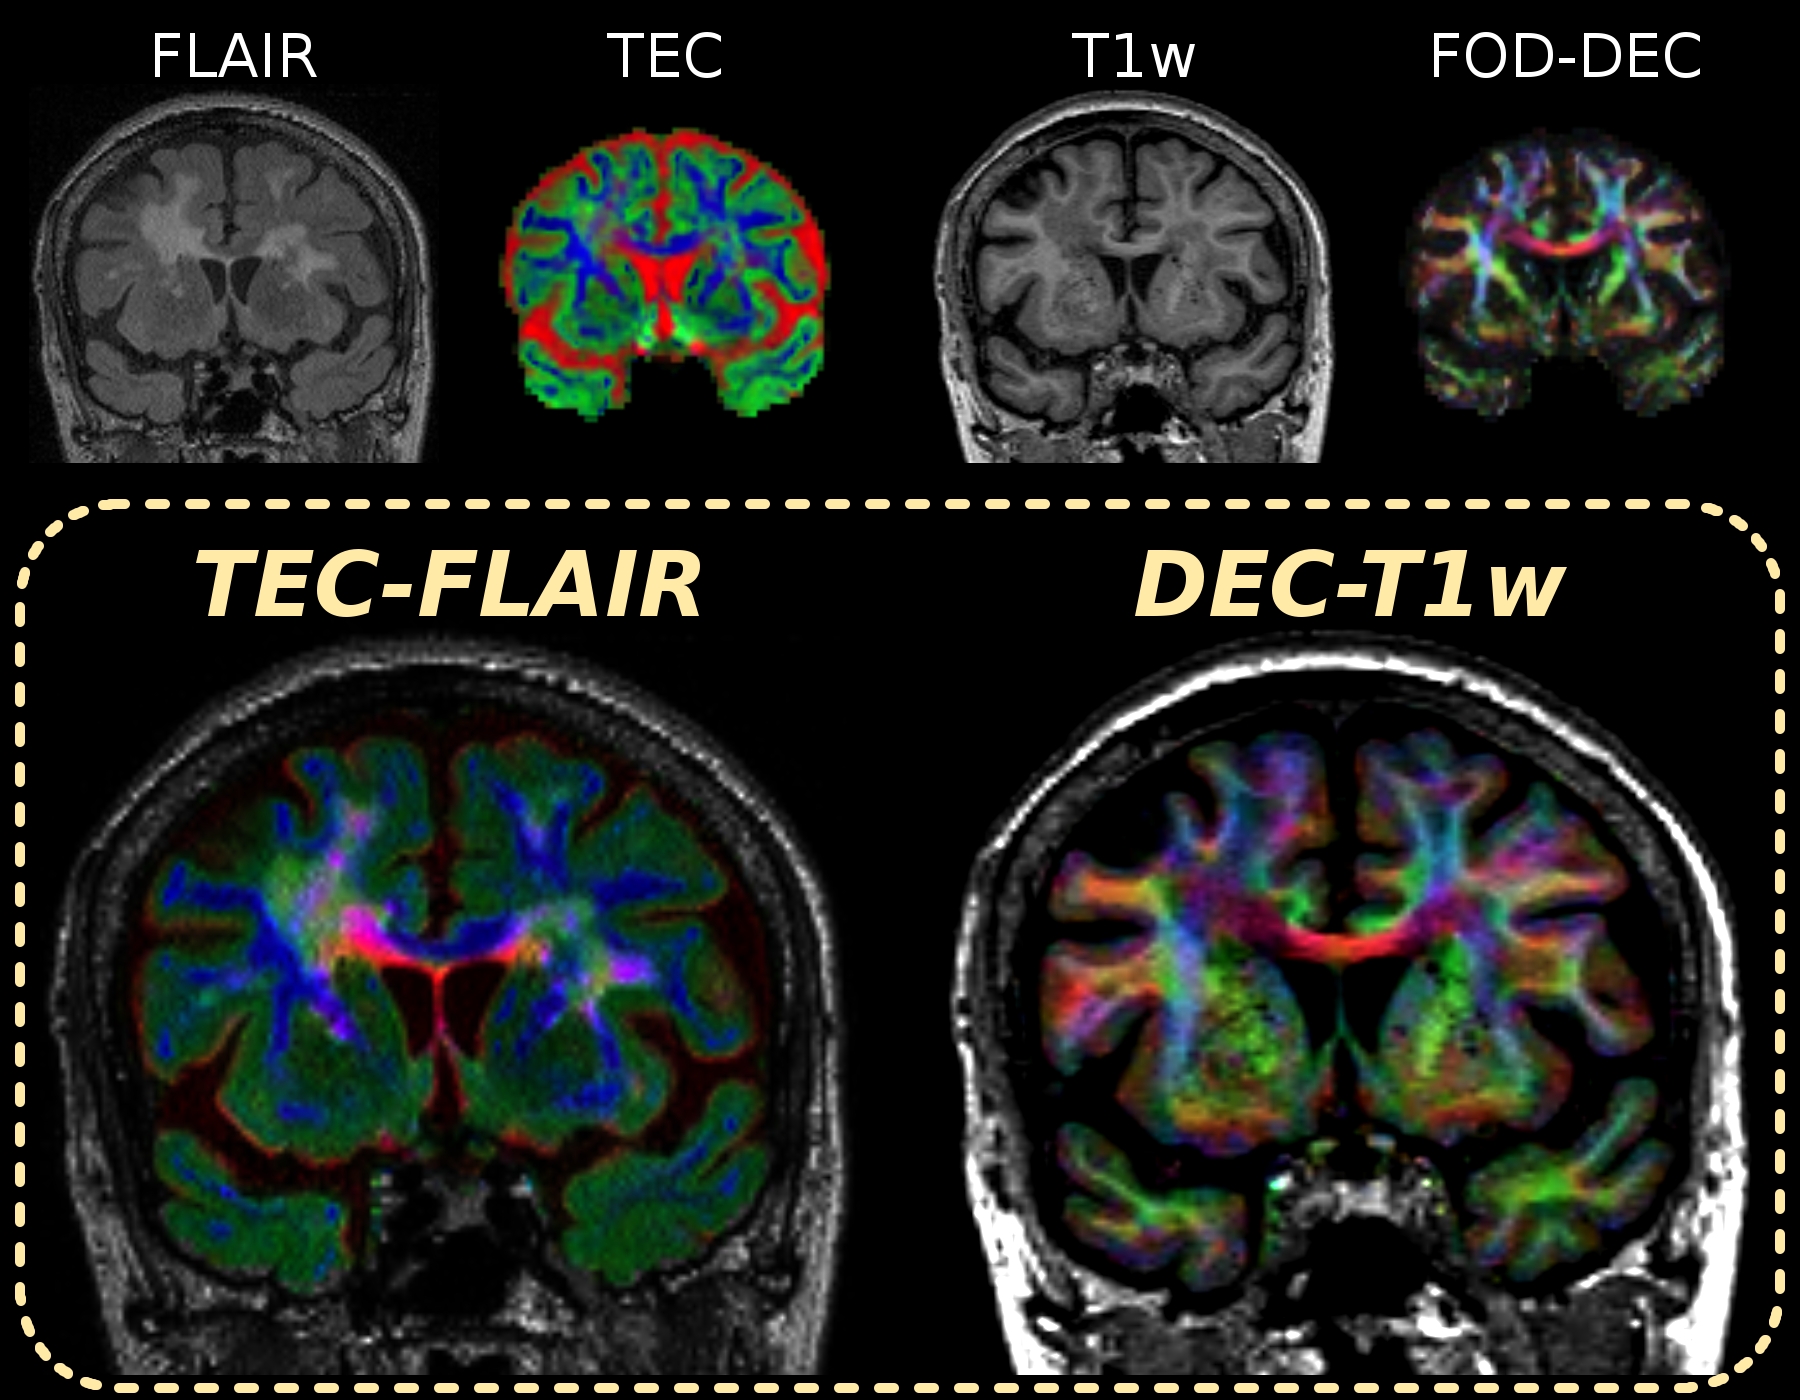
Fig.3–4 present the TEC-FLAIR alongside the DEC-T1w map for an axial and coronal slice. While it is hard to (visually) match spatial features of the original FLAIR and TEC-map separately to each other, the TEC-FLAIR combines the unique specificity of both. The TEC-FLAIR reveals remarkable heterogeneity of tissue properties between as well as within lesions. We observe increased presence of interstitial fluid in periventricular regions of the brain parenchyma, showing as bright red/magenta lesions. Nulling of CSF signal within the ventricles by the FLAIR contrast is particularly useful for this purpose. Heterogeneous presence of gliosis or other (extra-axonal) cellular content may be indicated by bright green (parts of) lesions. The DEC-T1w image (with added gamma-correction) is a powerful companion to the TEC-FLAIR, which allows to locate lesions more accurately with respect to anatomy as well as local specific fibre populations.
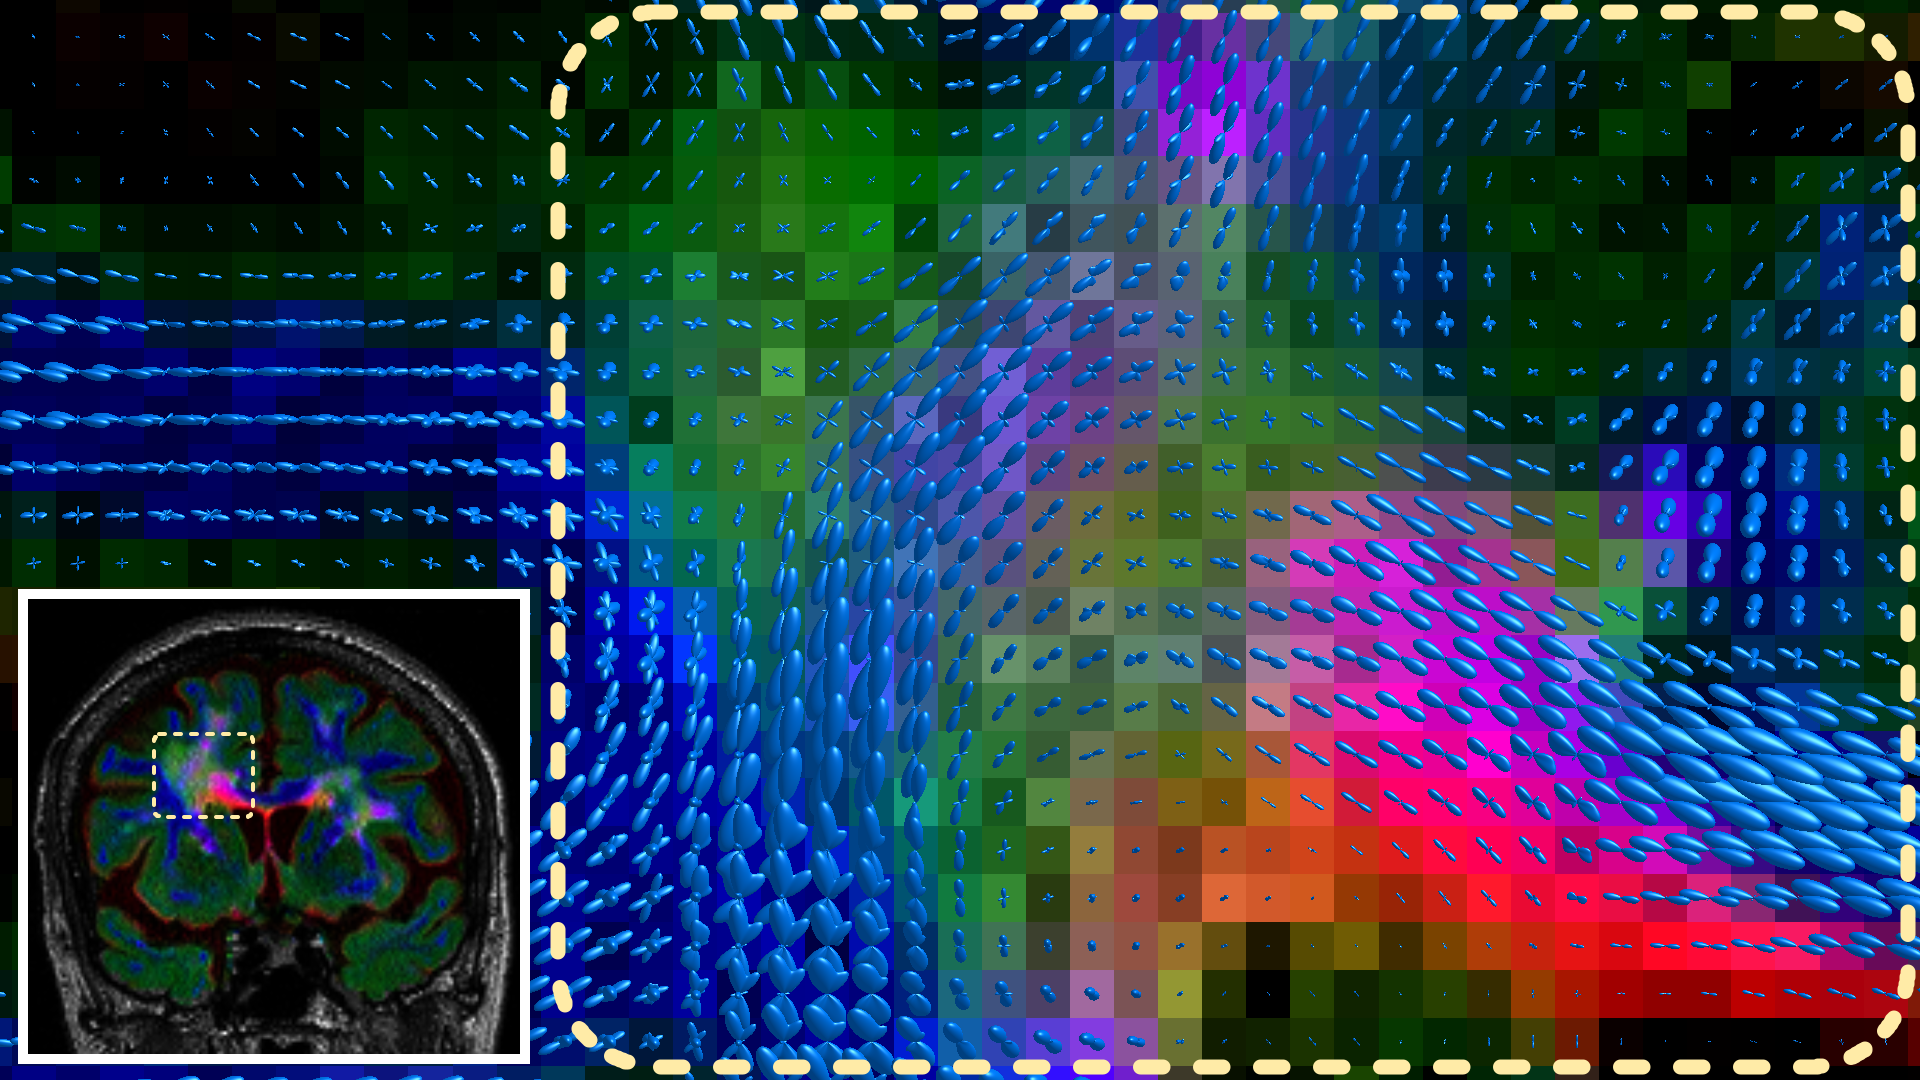
For even more specificity when investigating a particular area/lesion, the WM-FODs can be resampled to and superimposed on the TEC-FLAIR (Fig.5). This allows assessment of the location and tissue properties of lesions directly with respect to the local fibre architecture, potentially revealing differential impact of the lesion on the local fibre populations.
Finally, note that several other popular models of microstructure feature 3 compartments[28,29], and hence may also serve as input for this visualisation framework.
Conclusion
The TEC-FLAIR map combines the unique specificities of the FLAIR-contrast and tissue information from 3-tissue CSD. It enables assessment of tissue-specific properties of WMH lesions and, optionally combined with the DEC-T1w image, accurate localisation with respect to anatomy and local fibre populations.Acknowledgements
No acknowledgement found.References
[1] Coene BD, Hajnal JV, Gatehouse P, Longmore DB, White SJ, Oatridge A, Pennock JM, Young IR, Bydder GM. MR of the brain using fluid-attenuated inversion recovery (FLAIR) pulse sequence. AJNR 1992;13:1555-1564.
[2] Hajnal JV, Bryant DJ, Kasuboski L, Pattany PM, De Coene B, Lewis PD, Pennock JM, Oatridge A, Young IR, Bydder GM. Use of fluid attenuated inversion recovery (FLAIR) pulse sequence in MRI of the brain. J Comput Assist Tomogr 1992;16:841-844.
[3] Coene BD, Hajnal JV, Pennock JM, Bydder GM. MRI of the brain stem using fluid-attenuated inversion recovery pulse sequence. Neuroradiology 1993;35:327-331.
[4] Rydberg JN, Hammond CA, Grimm RC, Erickson BJ, Jack CR Jr, Huston J 3rd, Riederer SJ. Initial clinical experience in MR imaging of the brain with a fast fluid-attenuated inversion-recovery pulse sequence. Radiology 1994;193:173-180.
[5] Bergin PS, Fish DR, Shorvon SD, Oatridge A, deSouza NM, Bydder GM. Magnetic resonance imaging in partial epilepsy: additional abnormalities shown with the fluid attenuated inversion recovery (FLAIR) pulse sequence. J Neurol Neurosurg Psychiatry 1995;58:439-443.
[6] Baratti C, Barkhof F, Hoogenraad F, Valk J. Partially saturated fluid attenuated inversion recovery (FLAIR) sequence in multiple sclerosis with fully relaxed FLAIR and conventional spin-echo. Magn Reson Imaging 1995;13:513-521.
[7] Hashemi RH, Bradley WG, Jr, Chen DY, Jordan JE, Queralt JA, Cheng AE, Henrie JN. Suspected multiple sclerosis: MR imaging with a thin-section fast FLAIR pulse sequence. Radiology 1995;196:505-510.
[8] Murata T, Itoh S, Koshino Y, Sakamoto K, Nishio M, Maeda M, Yamada H, Ishii Y, Isaki K. Serial cerebral MRI with FLAIR sequences in acute carbon monoxide poisoning. J Comput Assist Tomogr 1995;19:631-634.
[9] Noguchi K, Ogawa T, Inugami A, Toyoshima H, Sugawara S, Hatazawa J, Fujita H, Shimosegawa E, Kanno I, Okudera T. Acute subarachnoid hemorrhage: MR imaging with fluid attenuated inversion recovery pulse sequences. Radiology 1995;196:773-777.
[10] Alexander JA, Sheppard S, Davis PC, Salverda P. Adult cerebrovascular disease: role of modified rapid fluid-attenuated inversion recovery sequences. AJNR 1996;17:1507-1513.
[11] Tsuchiya K, Inaoka S, Mizutani Y, Hachiya J. Fast fluid-attenuated inversion-recovery MR of intracranial infections. AJNR 1997;18:909-913.
[12] Sze G, De Armond SJ, Brant-Zawadzki M, Davis RL, Norman D, Newton TH. Foci of MRI signal (pseudo lesions) anterior to the frontal horns: histologic correlations of a normal finding. Am J Roentgenol 1986;147(2):331-337.
[13] Fazekas F, Kleinert R, Offenbacher H, Schmidt R, Kleinert G, Payer F, Radner H, Lechner H. Pathologic correlates of incidental MRI white matter signal hyperintensities. Neurology 1993;43(9):1983-1689.
[14] Haller S, Kövari E, Herrmann FR, Cuvinciuc V, Tomm AM, Zulian GB, Lovblad KO, Giannakopoulos P, Bouras C. Do brain T2/FLAIR white matter hyperintensities correspond to myelin loss in normal aging? A radiologic-neuropathologic correlation study. Acta Neuropathol Commun 2013;1:14.
[15] Shim YS, Yang DW, Roe CM, Coats MA, Benzinger TL, Xiong C, Galvin JE, Cairns NJ, Morris JC. Pathological correlates of white matter hyperintensities on magnetic resonance imaging. Dement Geriatr Cogn Disord 2015;39:92-104.
[16] Maniega SM, Hernández MCV, Clayden JD, Royle NA, Murray C, Morris Z, Aribisala BS, Gow AJ, Starr JM, Bastin ME, Deary IJ, Wardlaw JM. White matter hyperintensities and normal-appearing white matter integrity in the aging brain. Neurobiol Aging 2015;36(2):909-918.
[17] Gouw AA, Seewann A, Vrenken H, van der Flier WM, Rozemuller JM, Barkhof F, Scheltens P, Geurts JJ. Heterogeneity of white matter hyperintensities in Alzheimer's disease: post-mortem quantitative MRI and neuropathology. Brain 2008;131(12):3286-3298.
[18] Kim KW, MacFall JR, Payne ME. Classification of white matter lesions on magnetic resonance imaging in elderly persons. Biol Psychiatry 2008;64(4):273-280.
[19] Tournier JD, Calamante F, Connelly A. Robust determination of the fibre orientation distribution in diffusion MRI: Non-negativity constrained super-resolved spherical deconvolution. NeuroImage 2007;35(4):1459-1472.
[20] Jeurissen B, Tournier JD, Dhollander T, Connelly A, Sijbers J. Multi-tissue constrained spherical deconvolution for improved analysis of multi-shell diffusion MRI data. NeuroImage 2014;103:411-426.
[21] Dhollander T, Connelly A. A novel iterative approach to reap the benefits of multi-tissue CSD from just single-shell (+b=0) diffusion MRI data. Proc ISMRM 2016;24:3010.
[22] Dhollander T, Raffelt D, Connelly A. Towards interpretation of 3-tissue constrained spherical deconvolution results in pathology. Proc ISMRM 2017;25:1815.
[23] Dhollander T, Raffelt D, Smith RE, Connelly A. Panchromatic sharpening of FOD-based DEC maps by structural T1 information. Proc ISMRM 2015;23:566.
[24] Dhollander T, Smith RE, Tournier JD, Jeurissen B, Connelly A. Time to move on: an FOD-based DEC map to replace DTI's trademark DEC FA. Proc ISMRM 2015;23:1027.
[25] Andersson JLR, Xu J, Yacoub E, Auerbach E, Moeller S, Ugurbil K. A comprehensive Gaussian Process framework for correcting distortions and movements in diffusion images. Proc ISMRM 2012;20:2426.
[26] Tustison NJ, Avants BB, Cook PA, Zheng Y, Egan A, Yushkevich PA, Gee JC. N4ITK: Improved N3 bias correction. IEEE TMI 2010;29(6):1310-1320.
[27] Dhollander T, Raffelt D, Connelly A. Unsupervised 3-tissue response function estimation from single-shell or multi-shell diffusion MR data without a co-registered T1 image. Proc ISMRM Workshop on Breaking the Barriers of Diffusion MRI 2016:5.
[28] Zhang H, Schneider T, Wheeler-Kingshott CA, Alexander DC. NODDI: practical in vivo neurite orientation dispersion and density imaging of the human brain. NeuroImage 2012;61(4):1000-1016.
[29] Novikov DS, Veraart J, Jelescu IO, Fieremans E. Mapping orientational and microstructural metrics of neuronal integrity with in vivo diffusion MRI. arXiv:1609.09144v1
Figures
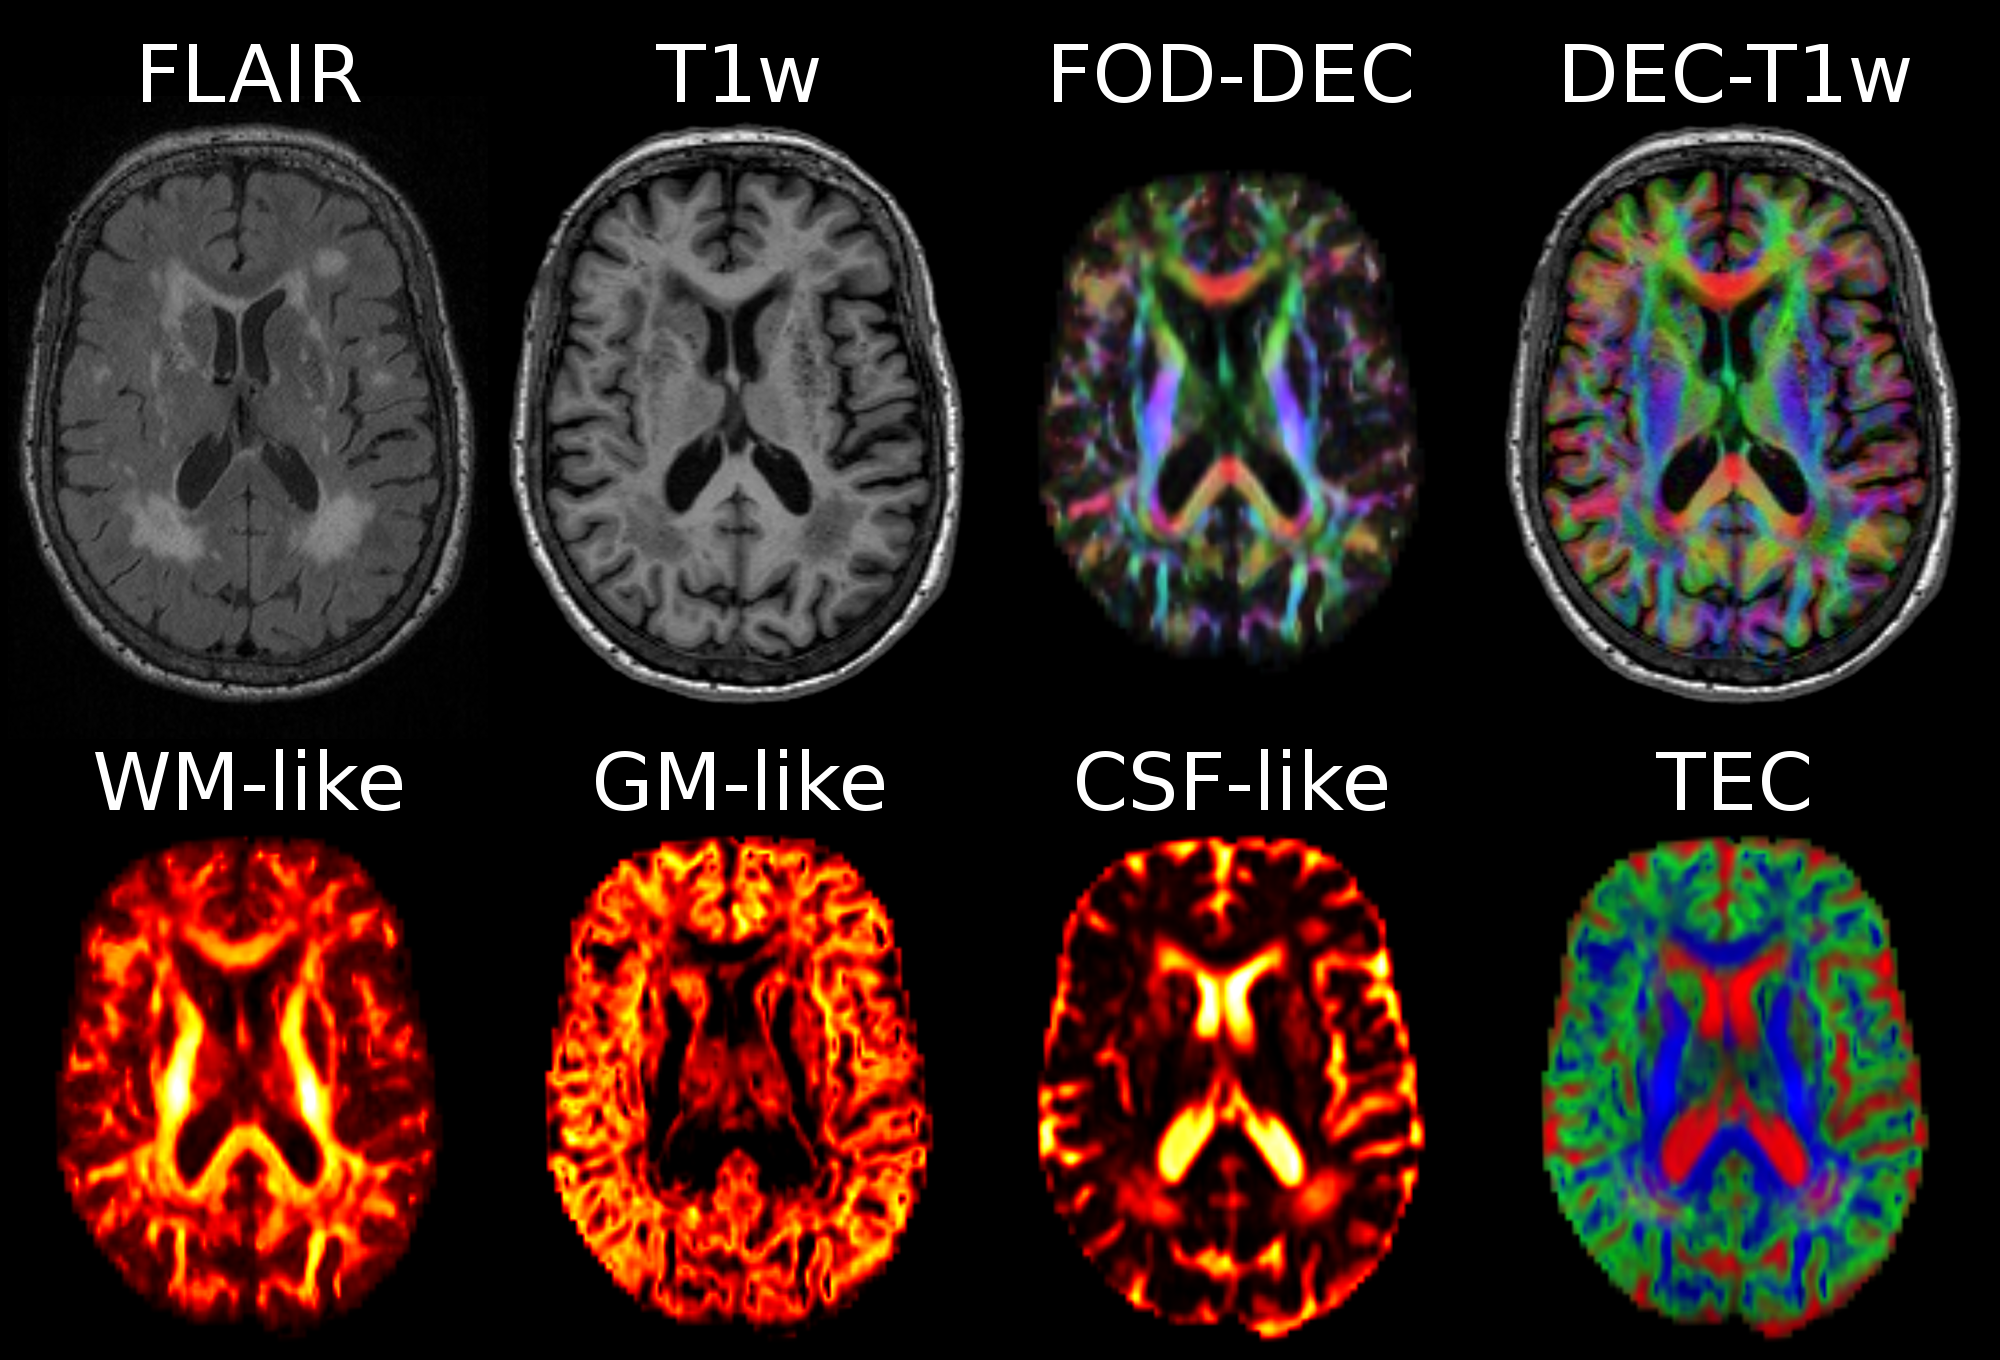
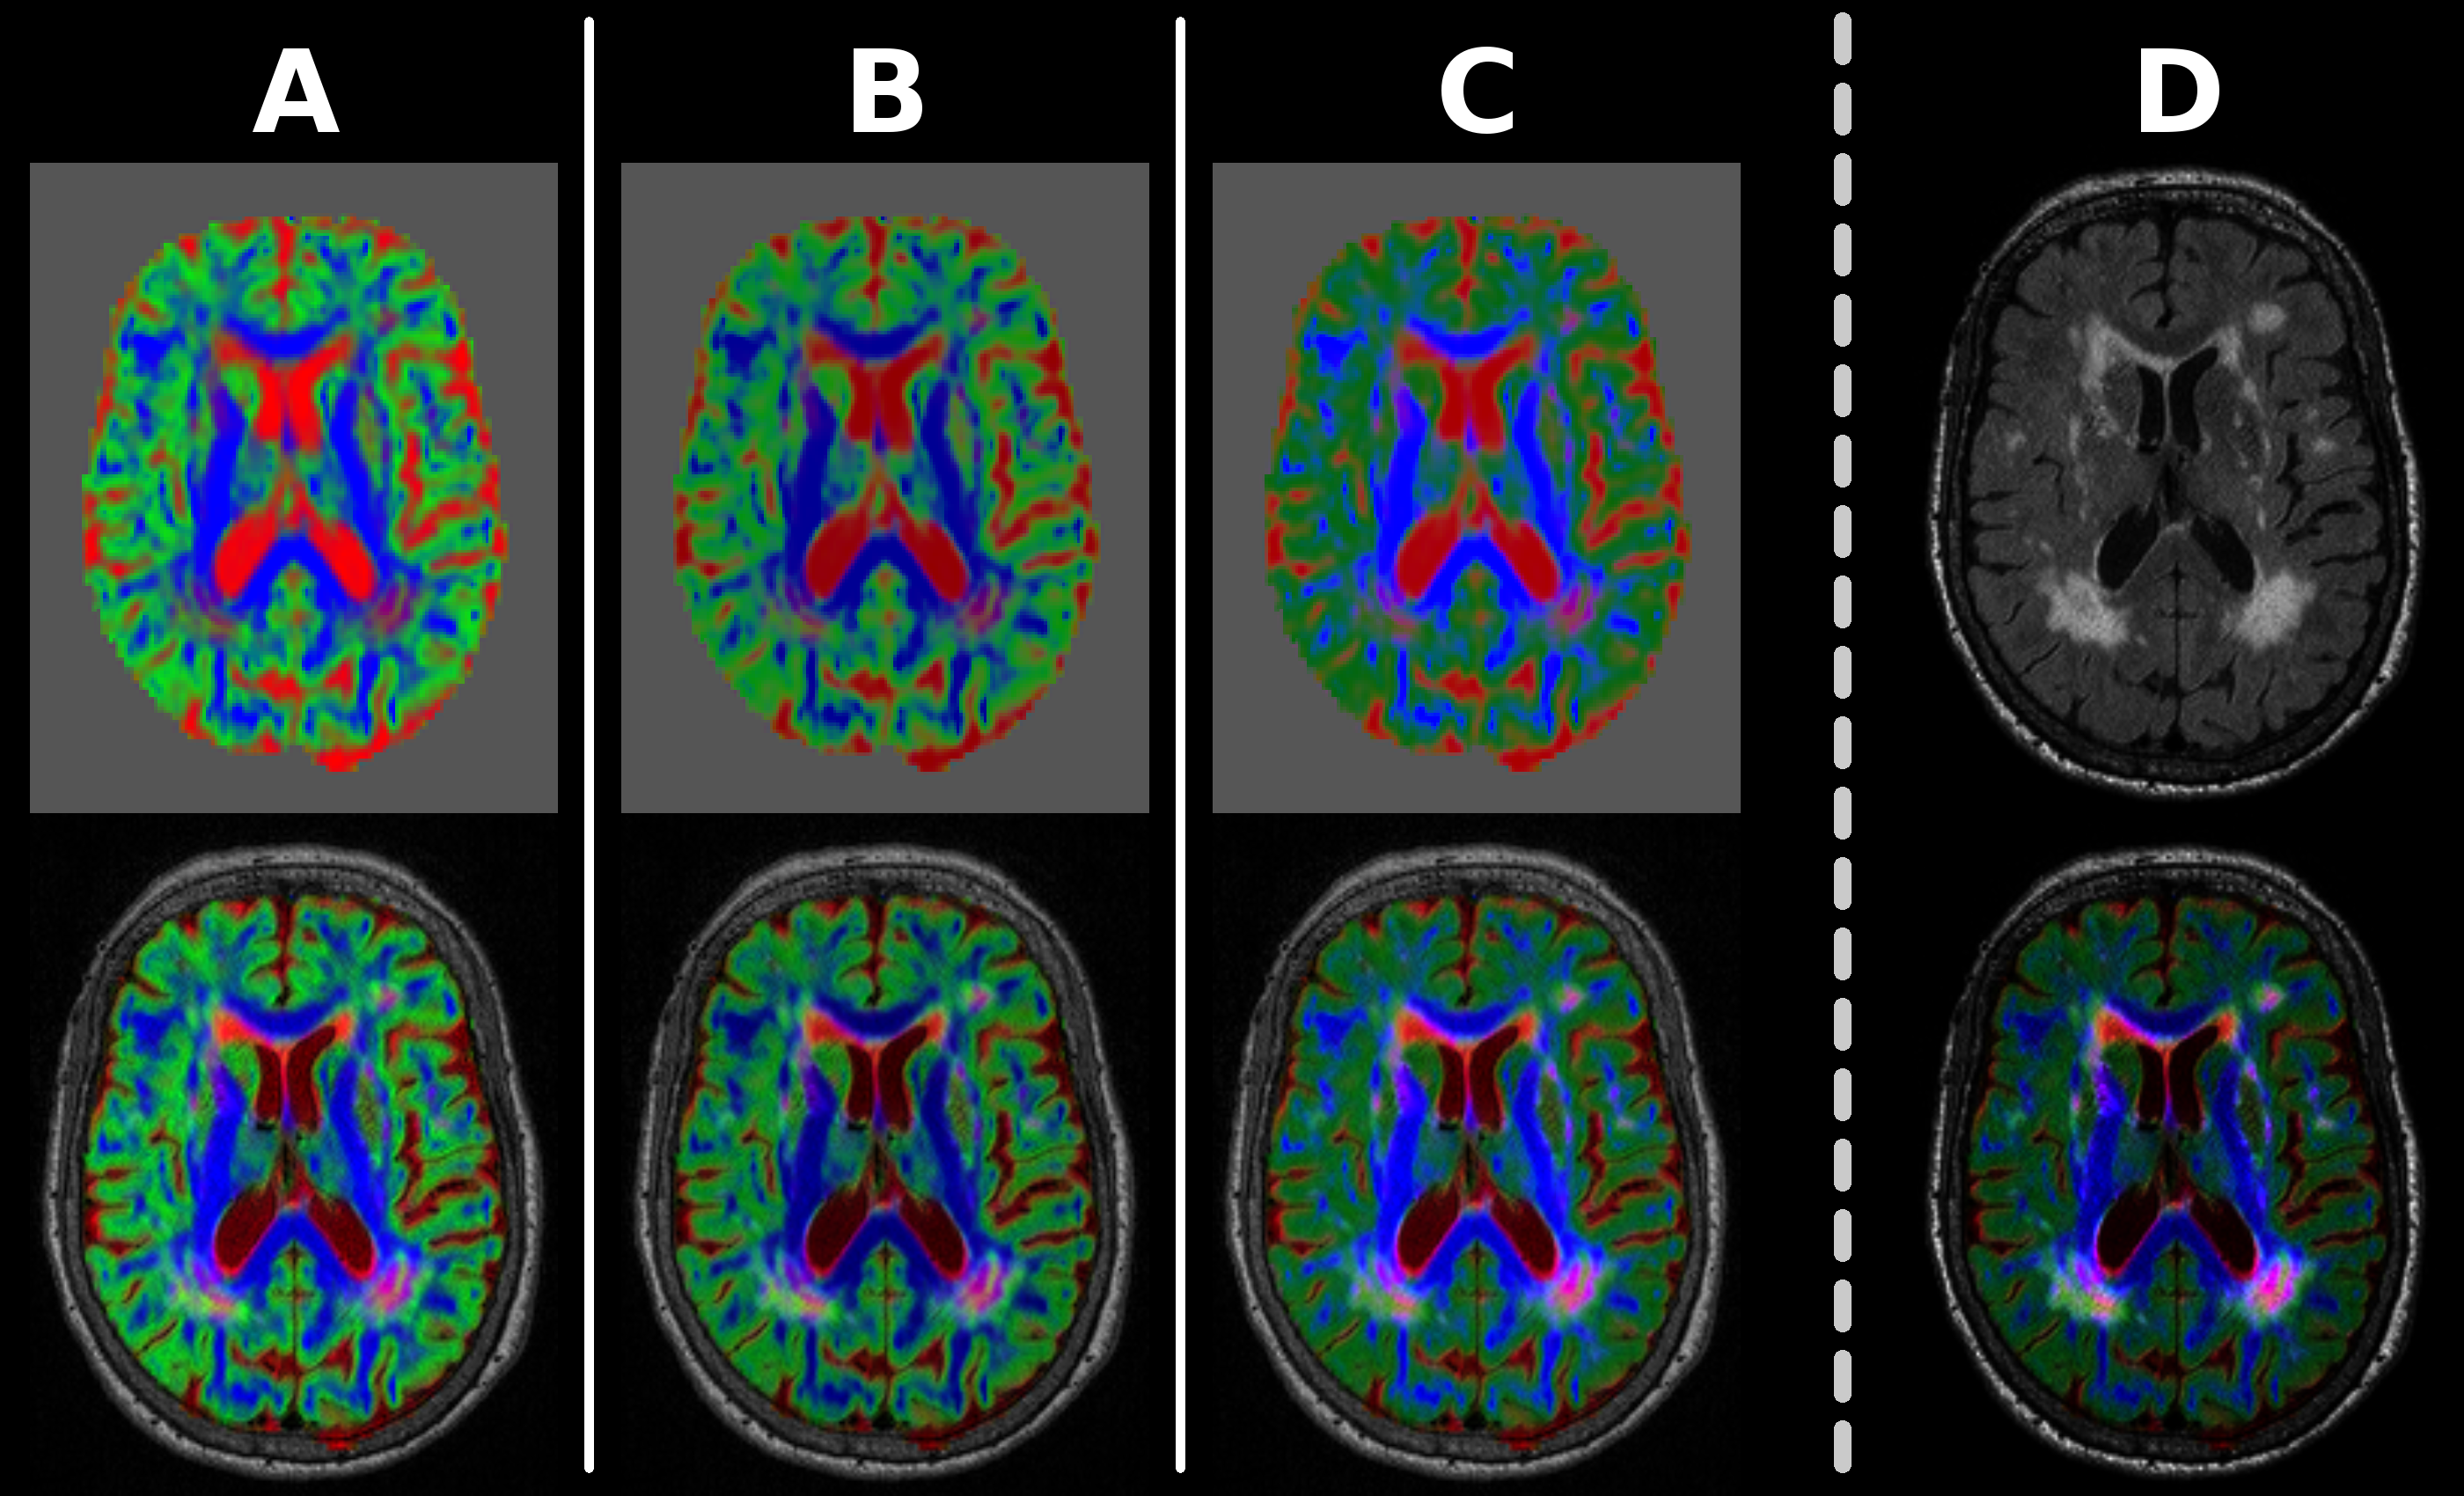
Fig.2: Design of the TEC-FLAIR map.
[A] Using L1-norm to normalise colours artificially darkens colours in lesions, counteracting FLAIR contrast in TEC-FLAIR map.
[B] Using L2-norm instead helps against this, but relative luminance of colours still overwhelms the TEC-FLAIR map.
[C] Using customised Lp-norm to account for relative luminance of colours and gamma-value of most screens results in RGB-map with chrominance only. Luminance of the TEC-FLAIR map uniquely visualises the FLAIR contrast.
[D] Additional gamma-correction of the luminance channel (FLAIR-image) itself results in further improvement of visual contrast of the final TEC-FLAIR map.