1569
Accuracy of response function estimation algorithms for 3-tissue spherical deconvolution of diverse quality diffusion MRI data1The Florey Institute of Neuroscience and Mental Health, Melbourne, Australia, 2The Florey Department of Neuroscience, University of Melbourne, Melbourne, Australia
Synopsis
Multi-shell multi-tissue constrained spherical deconvolution (MSMT-CSD) and single-shell 3-tissue CSD (SS3T-CSD) resolve white matter (WM) fibre orientation distributions and grey matter (GM) and CSF tissue compartments by deconvolving WM, GM and CSF response functions from the diffusion MRI data. To estimate these response functions from the data itself, a T1-based method was originally proposed. Recently, an unsupervised DWI-based method that doesn't rely on a co-registered T1-weighted image was also introduced. We evaluated the performance of both methods on high-quality HCP-data and clinical-quality single-shell data of an elderly patient with extensive lesions. The DWI-based method was more accurate in both scenarios.
Purpose
Constrained spherical deconvolution (CSD)[1] models diffusion-weighted imaging (DWI) data using only a single-fibre white matter (SF-WM) response function, leading to inaccurate WM fibre orientation distributions (FODs) in presence of grey matter (GM) and cerebrospinal fluid (CSF). Multi-shell multi-tissue CSD (MSMT-CSD)[2] adds GM/CSF response functions, but requires multi-shell data. Single-shell 3-tissue CSD (SS3T-CSD)[3,4] also resolves WM/GM/CSF compartments, yet requires just single-shell (+b=0) data.
To obtain WM/GM/CSF response functions, a T1-based method was originally proposed in [2]; whereas a DWI-based method was recently introduced in [4]. The latter is more convenient since it doesn't rely on a co-registered T1-weighted image, yet was also shown to be more accurate for typical quality single-shell and multi-shell data of a healthy subject[4].
This work investigates whether this accuracy benefit of the DWI-based method still holds in case of:
- superior quality data and preprocessing: using a preprocessed subject of the Human Connectome Project (HCP) data[5]
- clinical quality patient data: using data of an elderly patient (diagnosed with Alzheimer's disease), showing severe atrophy and extensive white matter hyperintensities (WMHs)
Data and Preprocessing
- HCP-data: data obtained from the HCP[5]: DWIs at b=0,1000,2000,3000s/mm² for 18,90,90,90 directions, voxel size 1.25×1.25×1.25mm³; T1-weighted image with voxel size 0.7×0.7×0.7mm³; all preprocessed[6].
- Patient-data: individual patient data, acquired on Siemens 3T scanner: DWIs at b=3000s/mm² for 60 directions and 8 b=0 images, voxel size 2.3×2.3×2.3mm³; T1-weighted image with voxel size 1.2×1×1mm³, all corrected for distortions/motion[7] & bias-fields[8].
Methods
Main steps of the T1-based method[2]:
- T1-weighted image co-registration to DWI-data
- Probabilistic segmentation of T1-weighted image; re-gridding to DWI-space
- WM/GM/CSF tissue probability threshold (95%)
- Extraction of 300 best SF-WM voxels from WM[9]; upper fractional anisotropy (FA) threshold (0.2) of GM/CSF
Main steps of the DWI-based method[4]:
- Brain-masking using optimal thresholds[10] and spatial filtering
- Crude WM/GM/CSF segmentation using FA and optimal diffusivity thresholds[10]
- More conservative WM/GM/CSF segmentation using optimal diffusivity thresholds[10] and outlier rejection
- Extraction of best SF-WM/GM/CSF voxels (0.5%,2%,10%) from WM/GM/CSF
We used the open source implementations of both of these methods, as available in MRtrix[11].
Both methods were applied to both datasets to estimate anisotropic SF-WM and isotropic GM/CSF response functions. For the HCP-data, the multi-shell response functions were used to perform MSMT-CSD. For the patient-data, the data were up-sampled to 1.15×1.15×1.15mm³, and the single-shell (+b=0) response functions were used to perform SS3T-CSD.
Results and Discussion
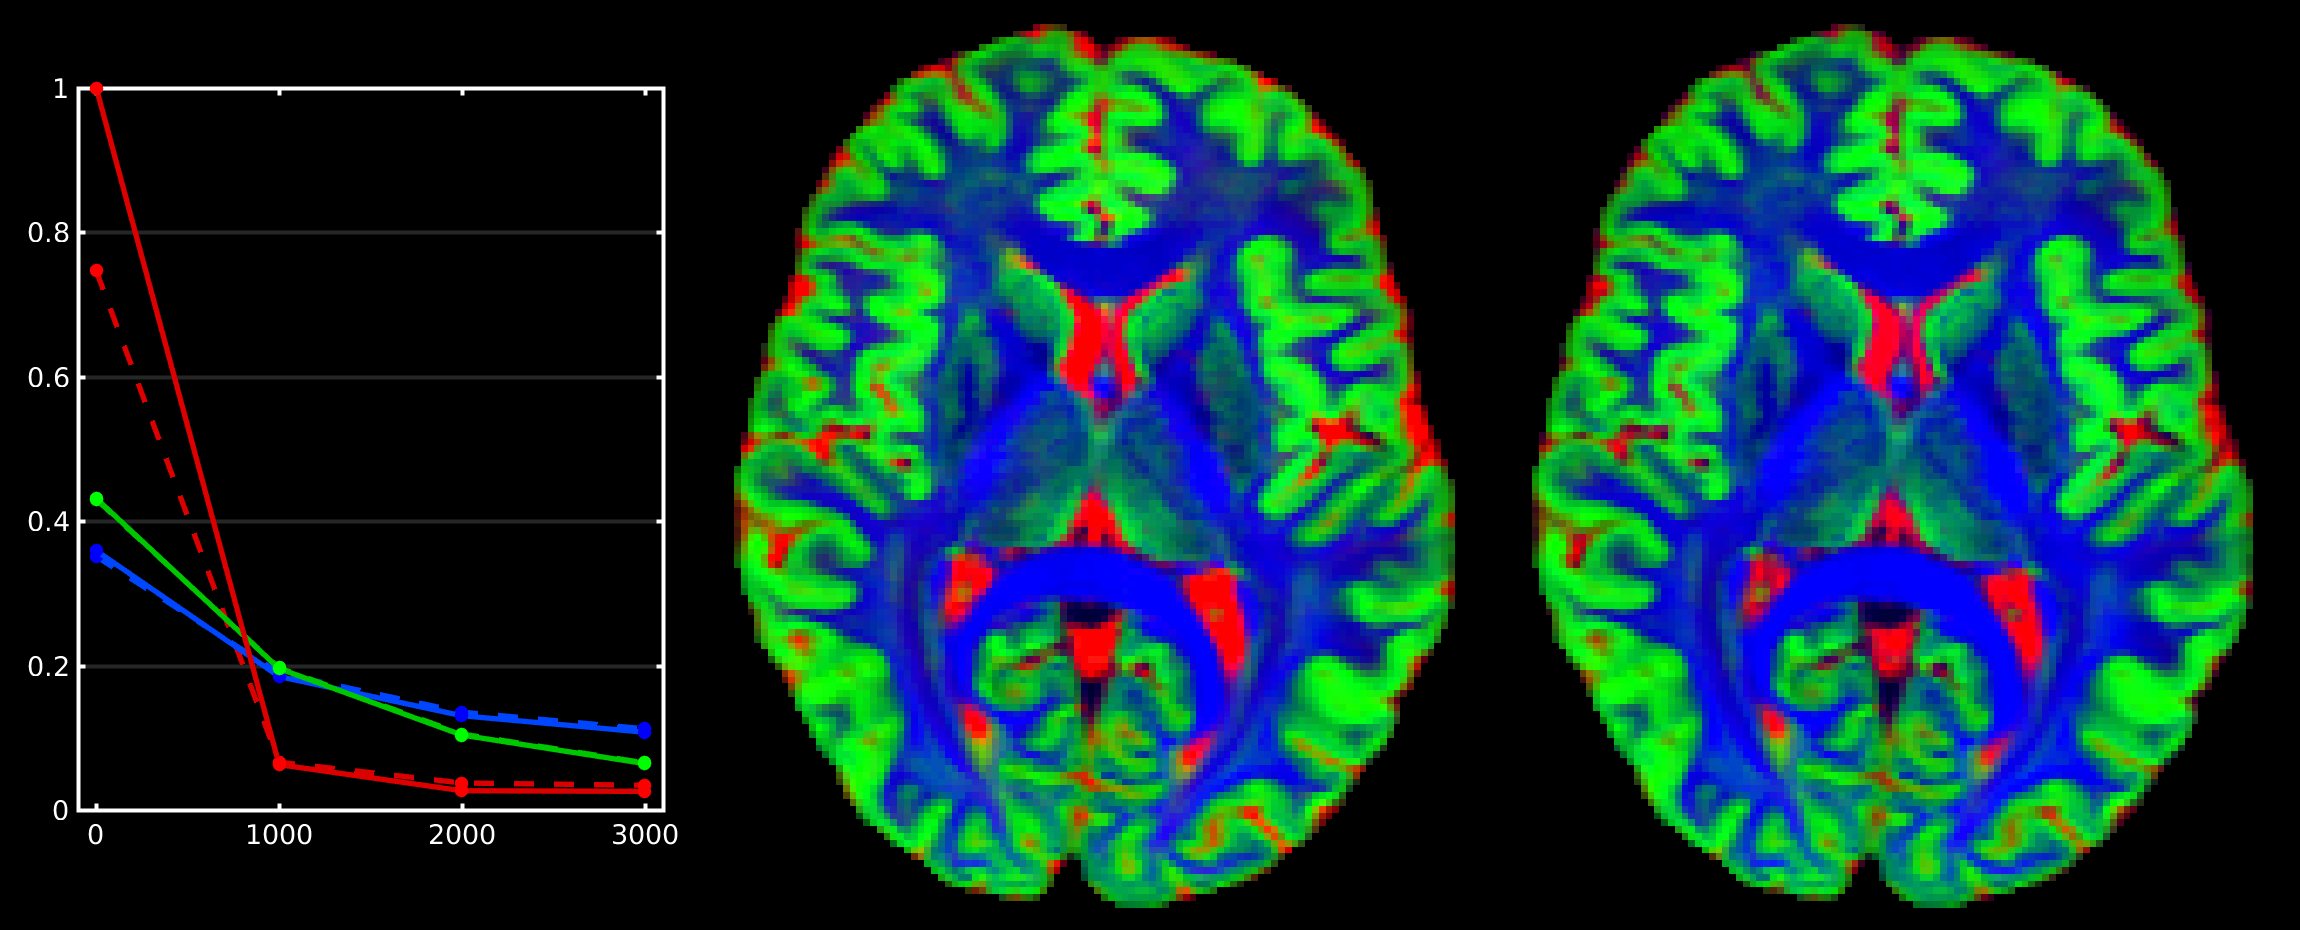
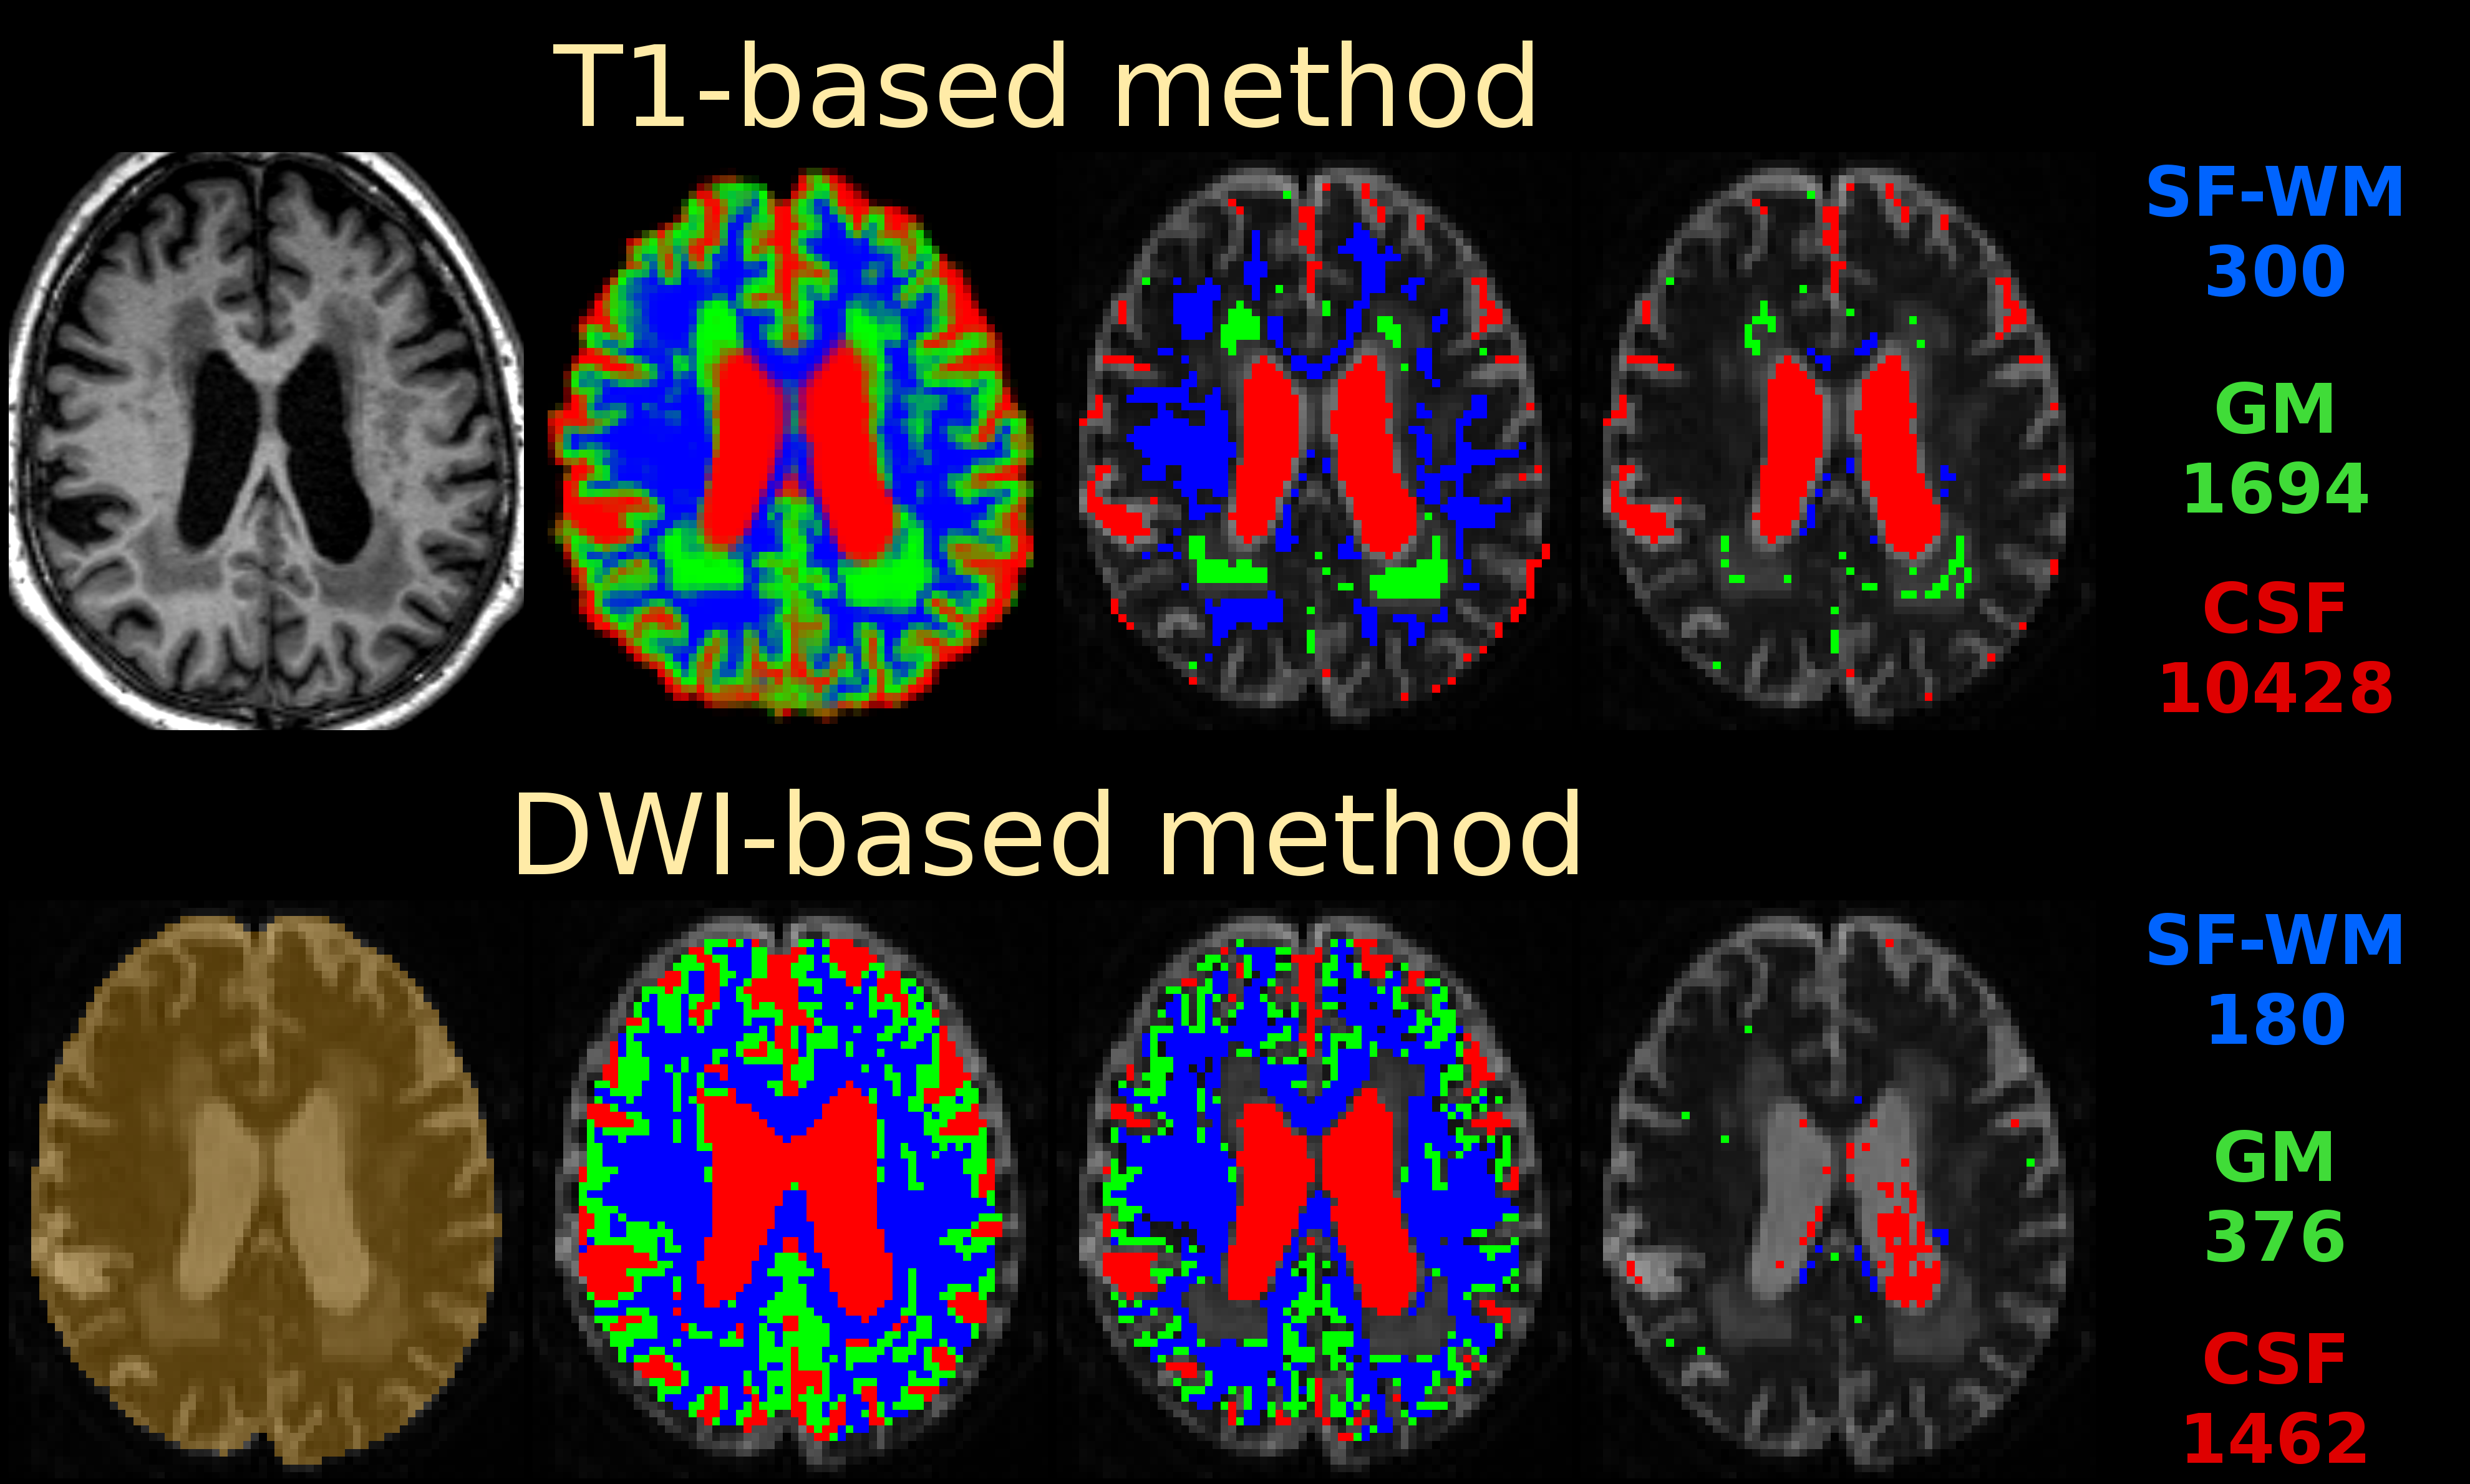
HCP-data: Fig.1 shows the T1-based method retains a large number of GM/CSF voxels, whereas the DWI-based method is more selective in its final step. The T1-based method always selects 300 SF-WM voxels, regardless of spatial resolution or available WM volume. The resulting SF-WM & GM response functions (Fig.2) are remarkably similar between both methods, even though the strategies and numbers of voxels selected by both methods differ substantially. The T1-based method underestimates the CSF b=0 intensity by more than 20%. Other than the explanations provided in [4], we noticed the T1-based method includes non-(pure) CSF voxels beyond the edge of the brain and in structures such as the choroid plexus, which the DWI-based method successfully manages to exclude (Fig.1). Using the CSF response from the T1-based method for MSMT-CSD leads to overestimation of CSF (Fig.2; middle, as compared to right) and underestimation of WM-FODs at the WM-CSF interface (not shown), in line with [4].
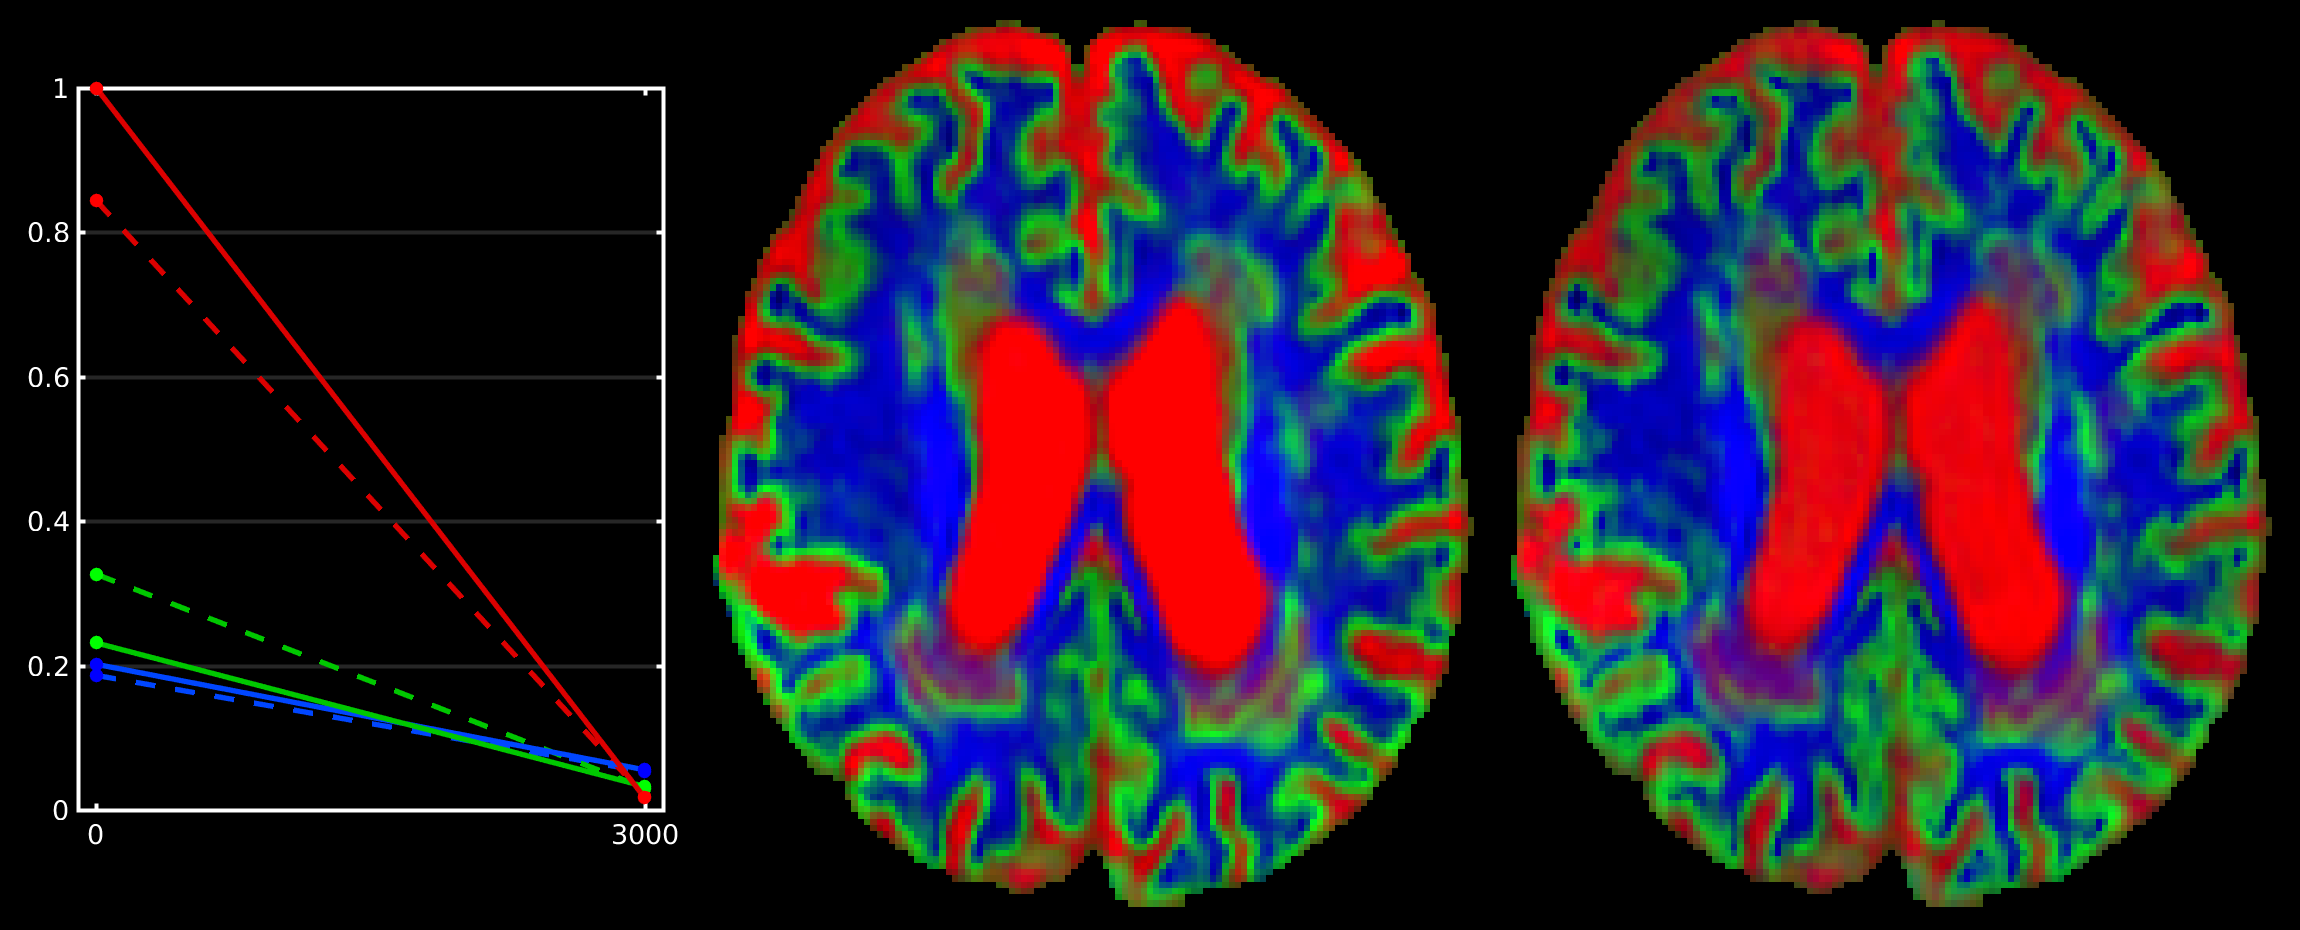
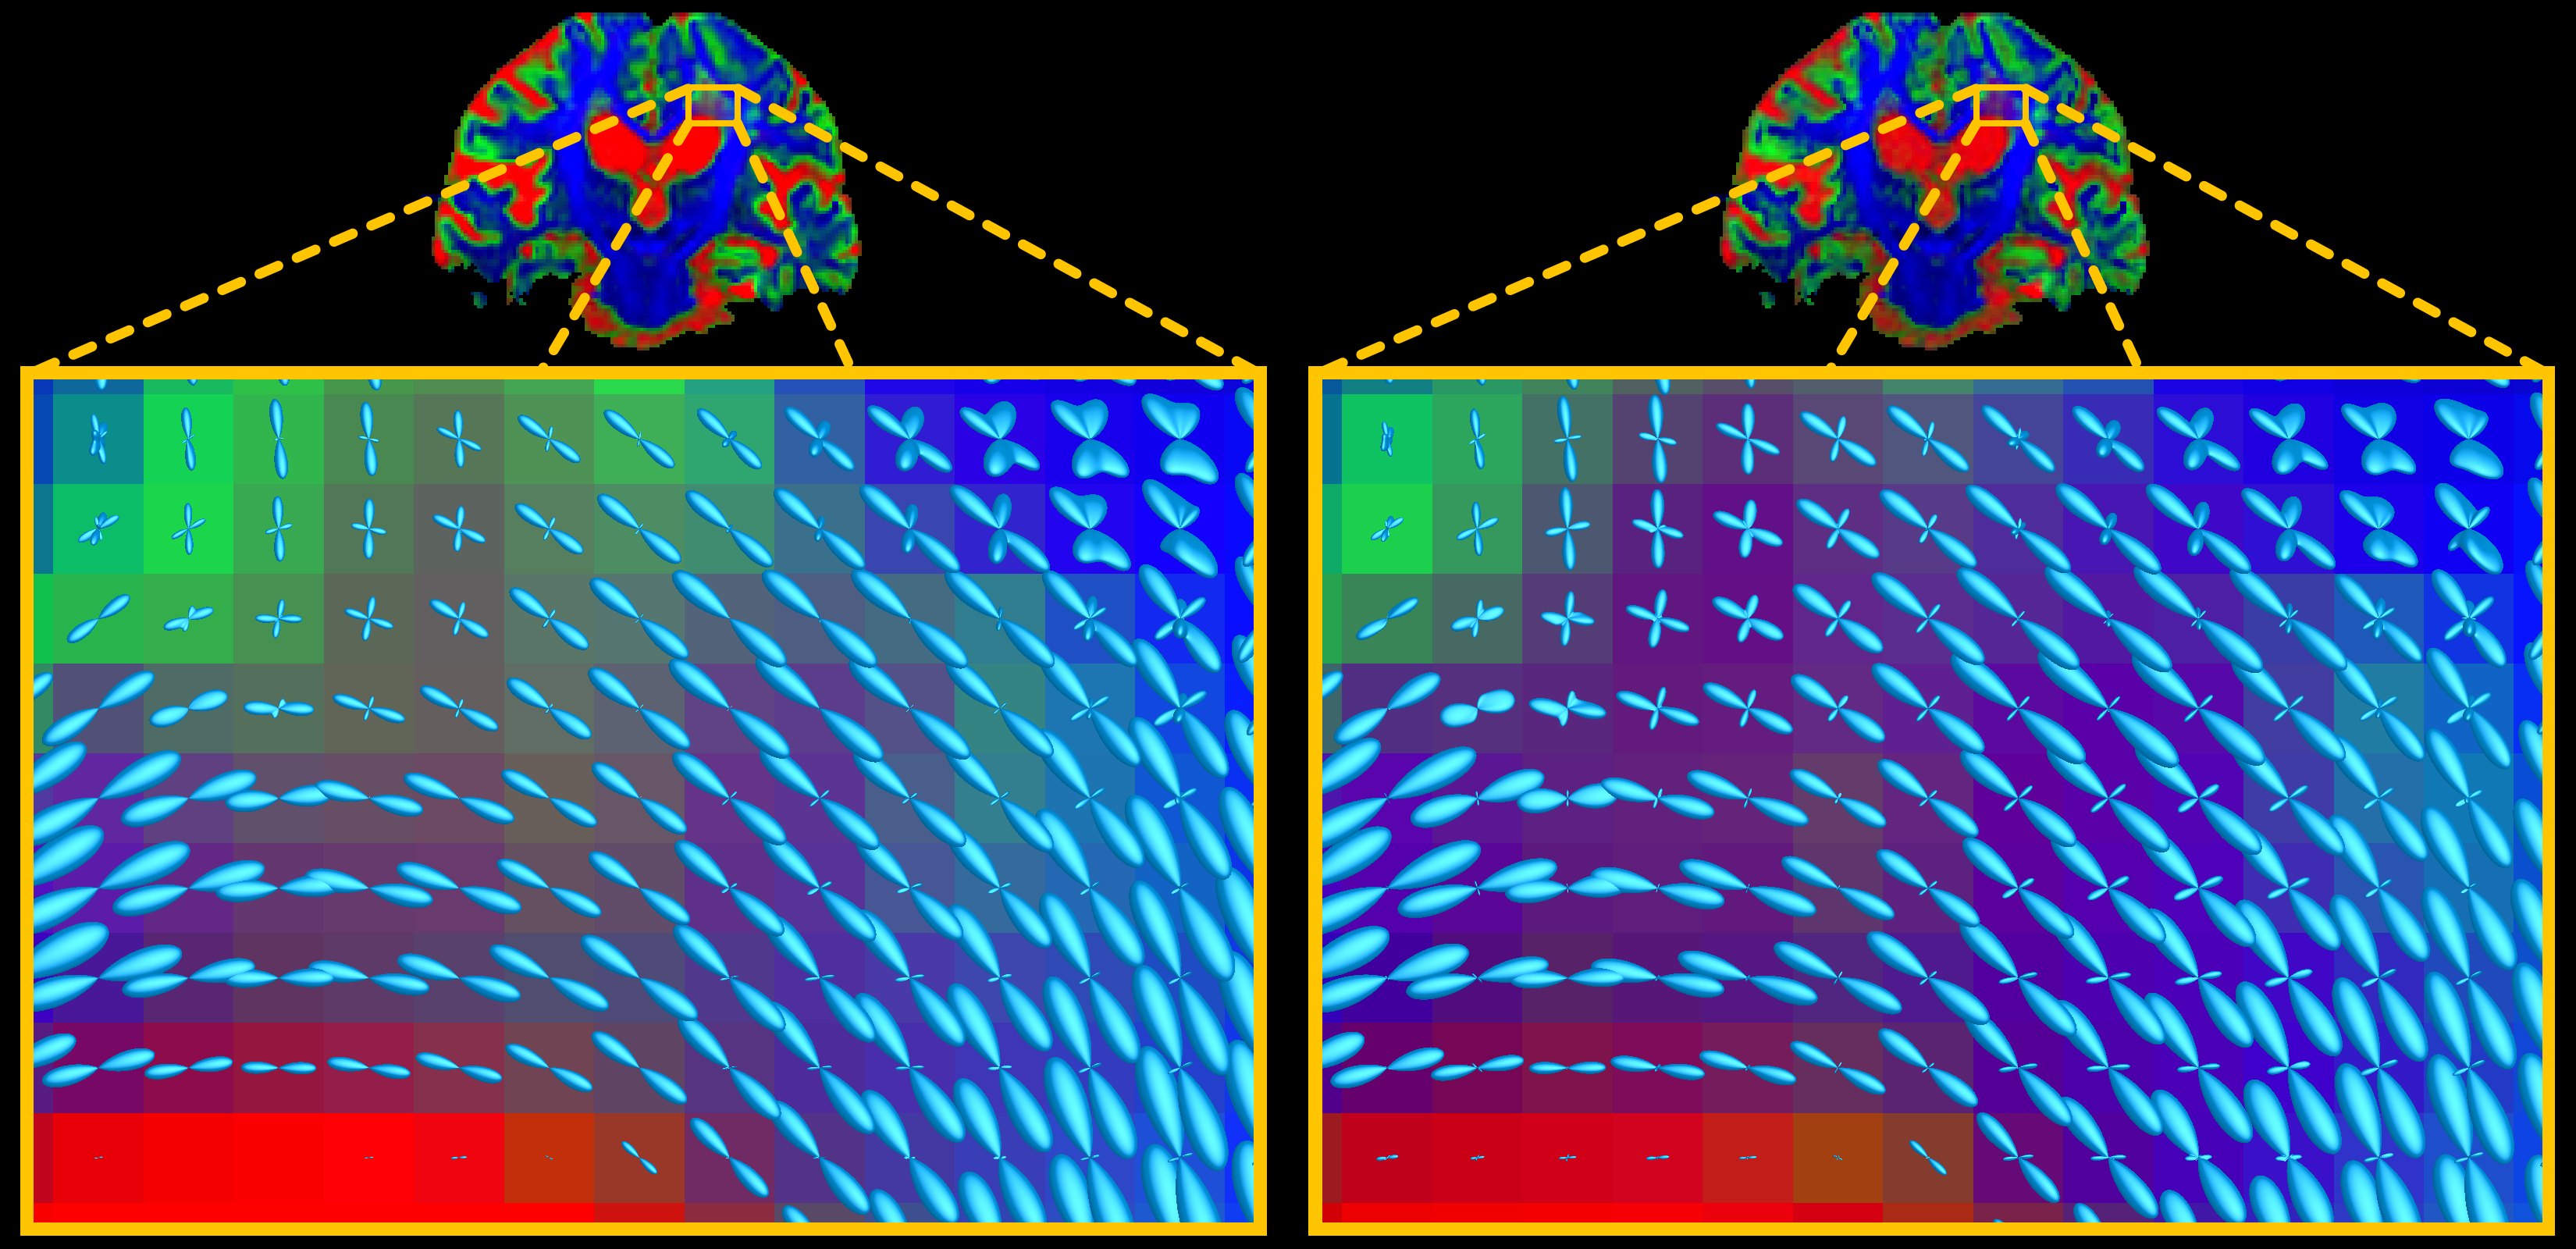
Patient-data: The T1-based method again retains more voxels for CSF response function estimation (Fig.3) and underestimates the CSF b=0 intensity. However, the large volume of white matter hyperintensities (WMHs) poses a serious problem for the T1-based method: it segments these entirely as "GM" (Fig.3), and due to lower spatial resolution most of the actual cortical GM doesn't survive the 95% threshold. Consequently, the "GM" response function is estimated mostly from WMH lesion voxels by the T1-based method. Perhaps surprisingly, the DWI-based method copes very well with WMH lesions: they get excluded almost entirely from any segmentation already in the third step of the algorithm (Fig.3), due to the outlier rejection based on non-parametric thresholds. The miscalibration of both GM & CSF response functions by the T1-based method (Fig.4, left) affects the SS3T-CSD outcome (Fig.4, middle, as compared to right): overestimation of CSF, artificial thinning of the cortex and non-trivial changes to tissue-contrast in lesions. It also results in underestimation and loss of WM-FOD features in lesions (Fig.5), which are successfully resolved by SS3T-CSD using the DWI-based response functions. Finally, this may also affect interpretation of the underlying microstructure in these lesions[12].
Conclusion
The DWI-based method[4] for 3-tissue response function estimation is not only more convenient, but also more accurate–even for data/preprocessing of superior quality–but especially for more "realistic" data and in the presence of gross pathology.Acknowledgements
The "HCP-data" were provided by the Human Connectome Project, WU-Minn Consortium (Principal Investigators: David Van Essen and Kamil Ugurbil; 1U54MH091657) funded by the 16 NIH Institutes and Centers that support the NIH Blueprint for Neuroscience Research; and by the McDonnell Center for Systems Neuroscience at Washington University.References
[1] Tournier JD, Calamante F, Connelly A. Robust determination of the fibre orientation distribution in diffusion MRI: Non-negativity constrained super-resolved spherical deconvolution. NeuroImage 2007;35(4):1459-1472.
[2] Jeurissen B, Tournier JD, Dhollander T, Connelly A, Sijbers J. Multi-tissue constrained spherical deconvolution for improved analysis of multi-shell diffusion MRI data. NeuroImage 2014;103:411-426.
[3] Dhollander T, Connelly A. A novel iterative approach to reap the benefits of multi-tissue CSD from just single-shell (+b=0) diffusion MRI data. Proc ISMRM 2016;24:3010.
[4] Dhollander T, Raffelt D, Connelly A. Unsupervised 3-tissue response function estimation from single-shell or multi-shell diffusion MR data without a co-registered T1 image. Proc ISMRM Workshop on Breaking the Barriers of Diffusion MRI 2016:5.
[5] Van Essen DC, Smith SM, Barch DM, Behrens TEJ, Yacoub E, Ugurbil K, for the WU-Minn HCP Consortium. The WU-Minn Human Connectome Project: An overview. NeuroImage 2013;80:62-79.
[6] Glasser MF, Sotiropoulos SN, Wilson JA, Coalson TS, Fischl B, Andersson JL, Xu J, Jbabdi S, Webster M, Polimeni JR, Van Essen DC, Jenkinson M. The minimal preprocessing pipelines for the Human Connectome Project. NeuroImage 2013;80:105-124.
[7] Andersson JLR, Xu J, Yacoub E, Auerbach E, Moeller S, Ugurbil K. A comprehensive Gaussian Process framework for correcting distortions and movements in diffusion images. Proc ISMRM 2012;20:2426.
[8] Tustison NJ, Avants BB, Cook PA, Zheng Y, Egan A, Yushkevich PA, Gee JC. N4ITK: Improved N3 bias correction. IEEE TMI 2010;29(6):1310-1320.
[9] Tournier JD, Calamante F, Connelly A. Determination of the appropriate b value and number of gradient directions for high-angular-resolution diffusion-weighted imaging. NMR Biomed 2013;26(12):1775-1786.
[10] Ridgway GR, Omar R, Ourselin S, Hill DLG, Warren JD, Fox NC. Issues with threshold masking in voxel-based morphometry of atrophied brains. NeuroImage 2009;44(1):99-111.
[11] http://www.mrtrix.org ; at the time of writing, open source implementations of both methods were available via the "dwi2response" command of the MRtrix3 software package.
[12] Dhollander T, Raffelt D, Connelly A. Towards interpretation of 3-tissue constrained spherical deconvolution results in pathology. Proc ISMRM 2017;25:1815.
Figures
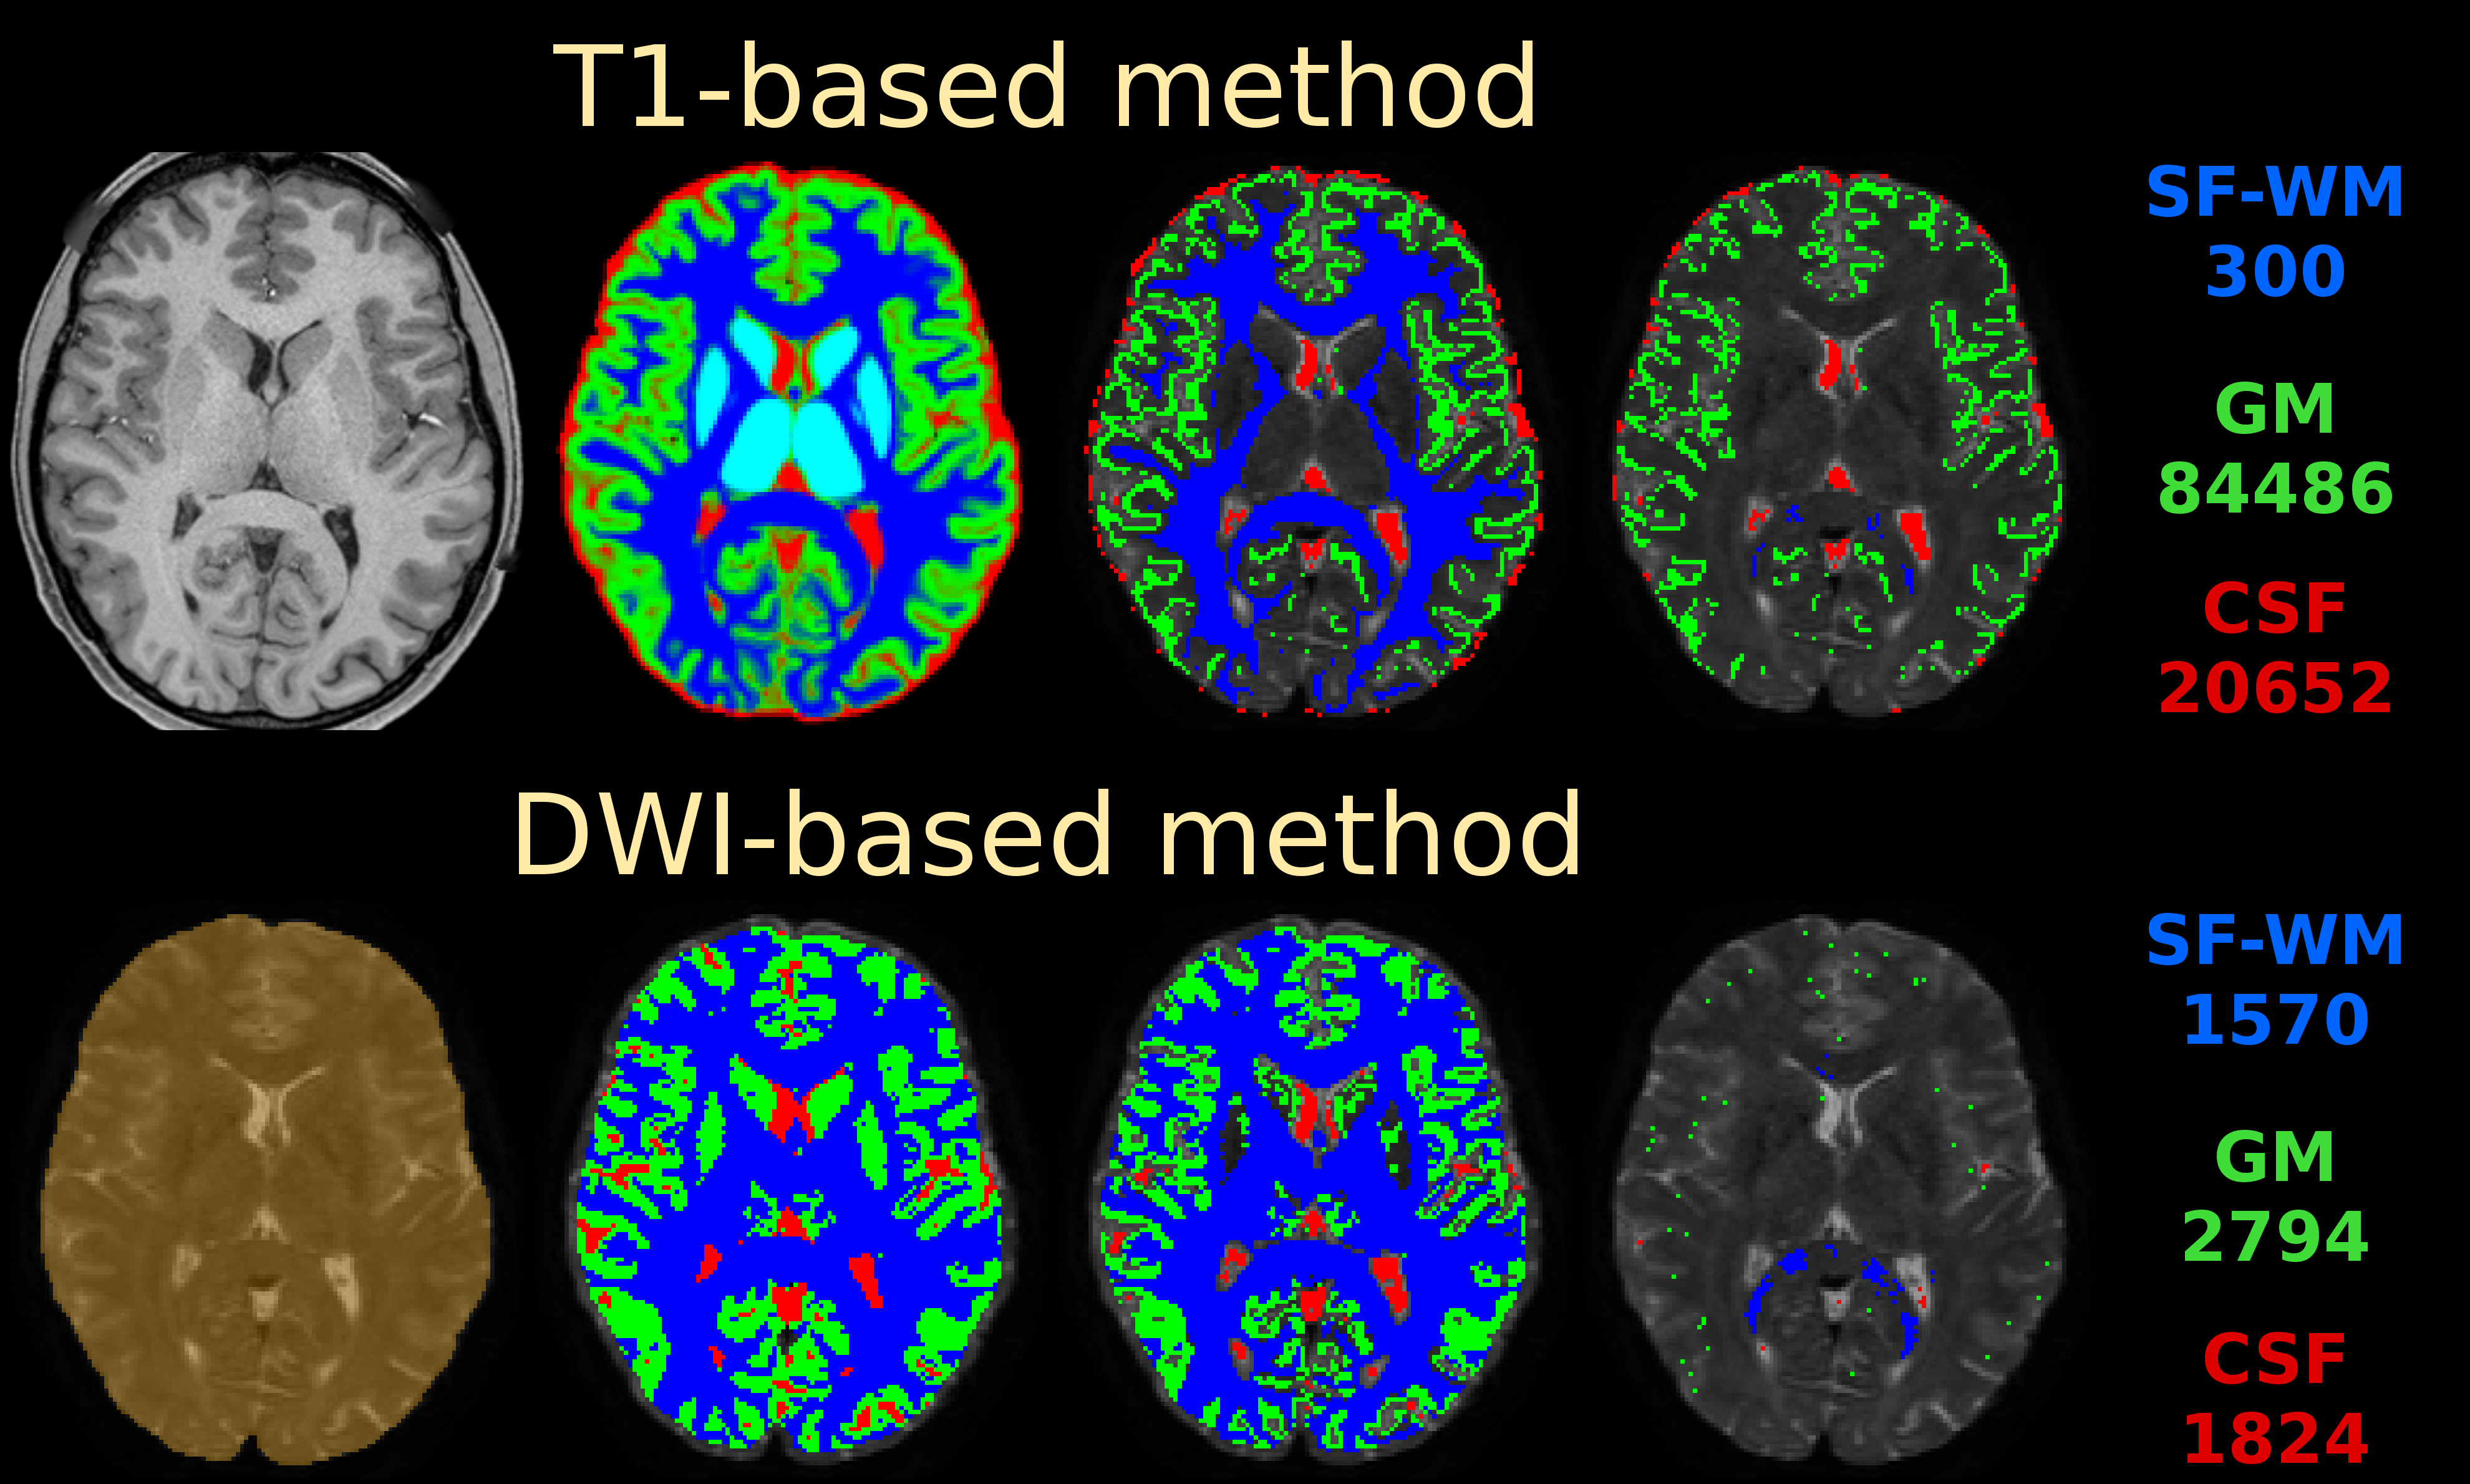
Fig.1: main steps of the T1-based method (top) and the DWI-based method (bottom), as applied to the HCP-data. Refer to the "Methods" section for description of each step. The numbers (right) reflect the voxel count of the final selection for each tissue type.
Use of colours: blue = WM (single-fibre in last column); green = GM, red = CSF; cyan = subcortical deep GM (in initial T1-based segmentation); orange = brain mask (in initial step of the DWI-based method). All visualisations are overlaid on a b=0 image for reference.