1565
Automatic reconstruction of cortico-striato-thalamo-cortical loops with application to obsessive-compulsive disorder1Keck School of Medicine of USC, Los Angeles, CA, United States, 2Emory University, Atlanta, GA, United States, 3Shandong University Cheeloo College of Medicine, Shandong, China, 4SUNY Downstate Medical Center, Brooklyn, NY, United States
Synopsis
Cortico-striato-thalamo-cortical (CSTC) loops are thought to play critical roles in the pathophysiology of several brain disorders. Despite the widespread evidence of CSTC circuits' crucial roles in brain disorders, a systematic approach to map their fiber pathways is missing. In order to advance our understanding on these critical circuits and how they are related to brain disorders, we propose a fully automatic approach for the in-vivo reconstruction based on diffusion MRI tractography. To demonstrate our approach, we studied MRI data from 19 patients with obsessive-compulsive disorder and 15 controls. Our approach enables in-dept analysis of the individual connections and also the full CSTC networks of the motor and lateral orbitofrontal loops.
Introduction
Cortico-striato-thalamo-cortical (CSTC) loops (or circuits or networks) are thought to play critical roles in the pathophysiology of several brain disorders such as Tourette syndrome [1], depression [2], Parkinson's syndrome [2,3] and addiction [4]. In particular the abnormal neural activity in the CSTC circuits are thought to implicate obsessive-compulsive disorder (OCD) [5]. The classical description of CSTC circuits by Alexander et al. [6] consists of five parallel but functionally segregated basal ganglia-thalamocortical loops. These are the (i) motor (ii) lateral orbitofrontal (iii) dorsolateral prefrontal (iv) oculomotor (v) anterior cingulate loops. Despite the widespread evidence of CSTC loops' crucial roles in brain disorders, a systematic approach to map their fiber pathways is missing. In order to advance our understanding on these critical circuits of the brain and how they are related to brain disorders, we propose a fully automatic approach for in-vivo reconstruction of the motor and lateral orbitofrontal CSTC loops based on diffusion MRI (dMRI) tractography using connectome imaging data.
Materials and data collection
For this study, we collected MRI data from 19 patients with OCD and 15 controls. For each subject, T1 and dMRI are acquired at the Center for Image Acquisition, Stevens Neuroimaging and Informatics Institute at USC using a 3T Prisma MRI scanner. For dMRI, cutting-edge MRI protocols from the Human Connectome Project (HCP) [7] protocol are used: 1.25mm isotropic resolution with b-values of 1500 s/mm2 , 2250 s/mm2 and 3000 s/mm2 along 97, 98 and 99 directions respectively. Data from two phase encodings (AP/PA) are acquired to better correct the susceptibility-induced distortions, that are particularly important for orbitofrontal cortex and brain stem regions. All images are visually inspected to ensure high quality data. Necessary permissions for the study are obtained from the USC Institutional Review Board.Methods
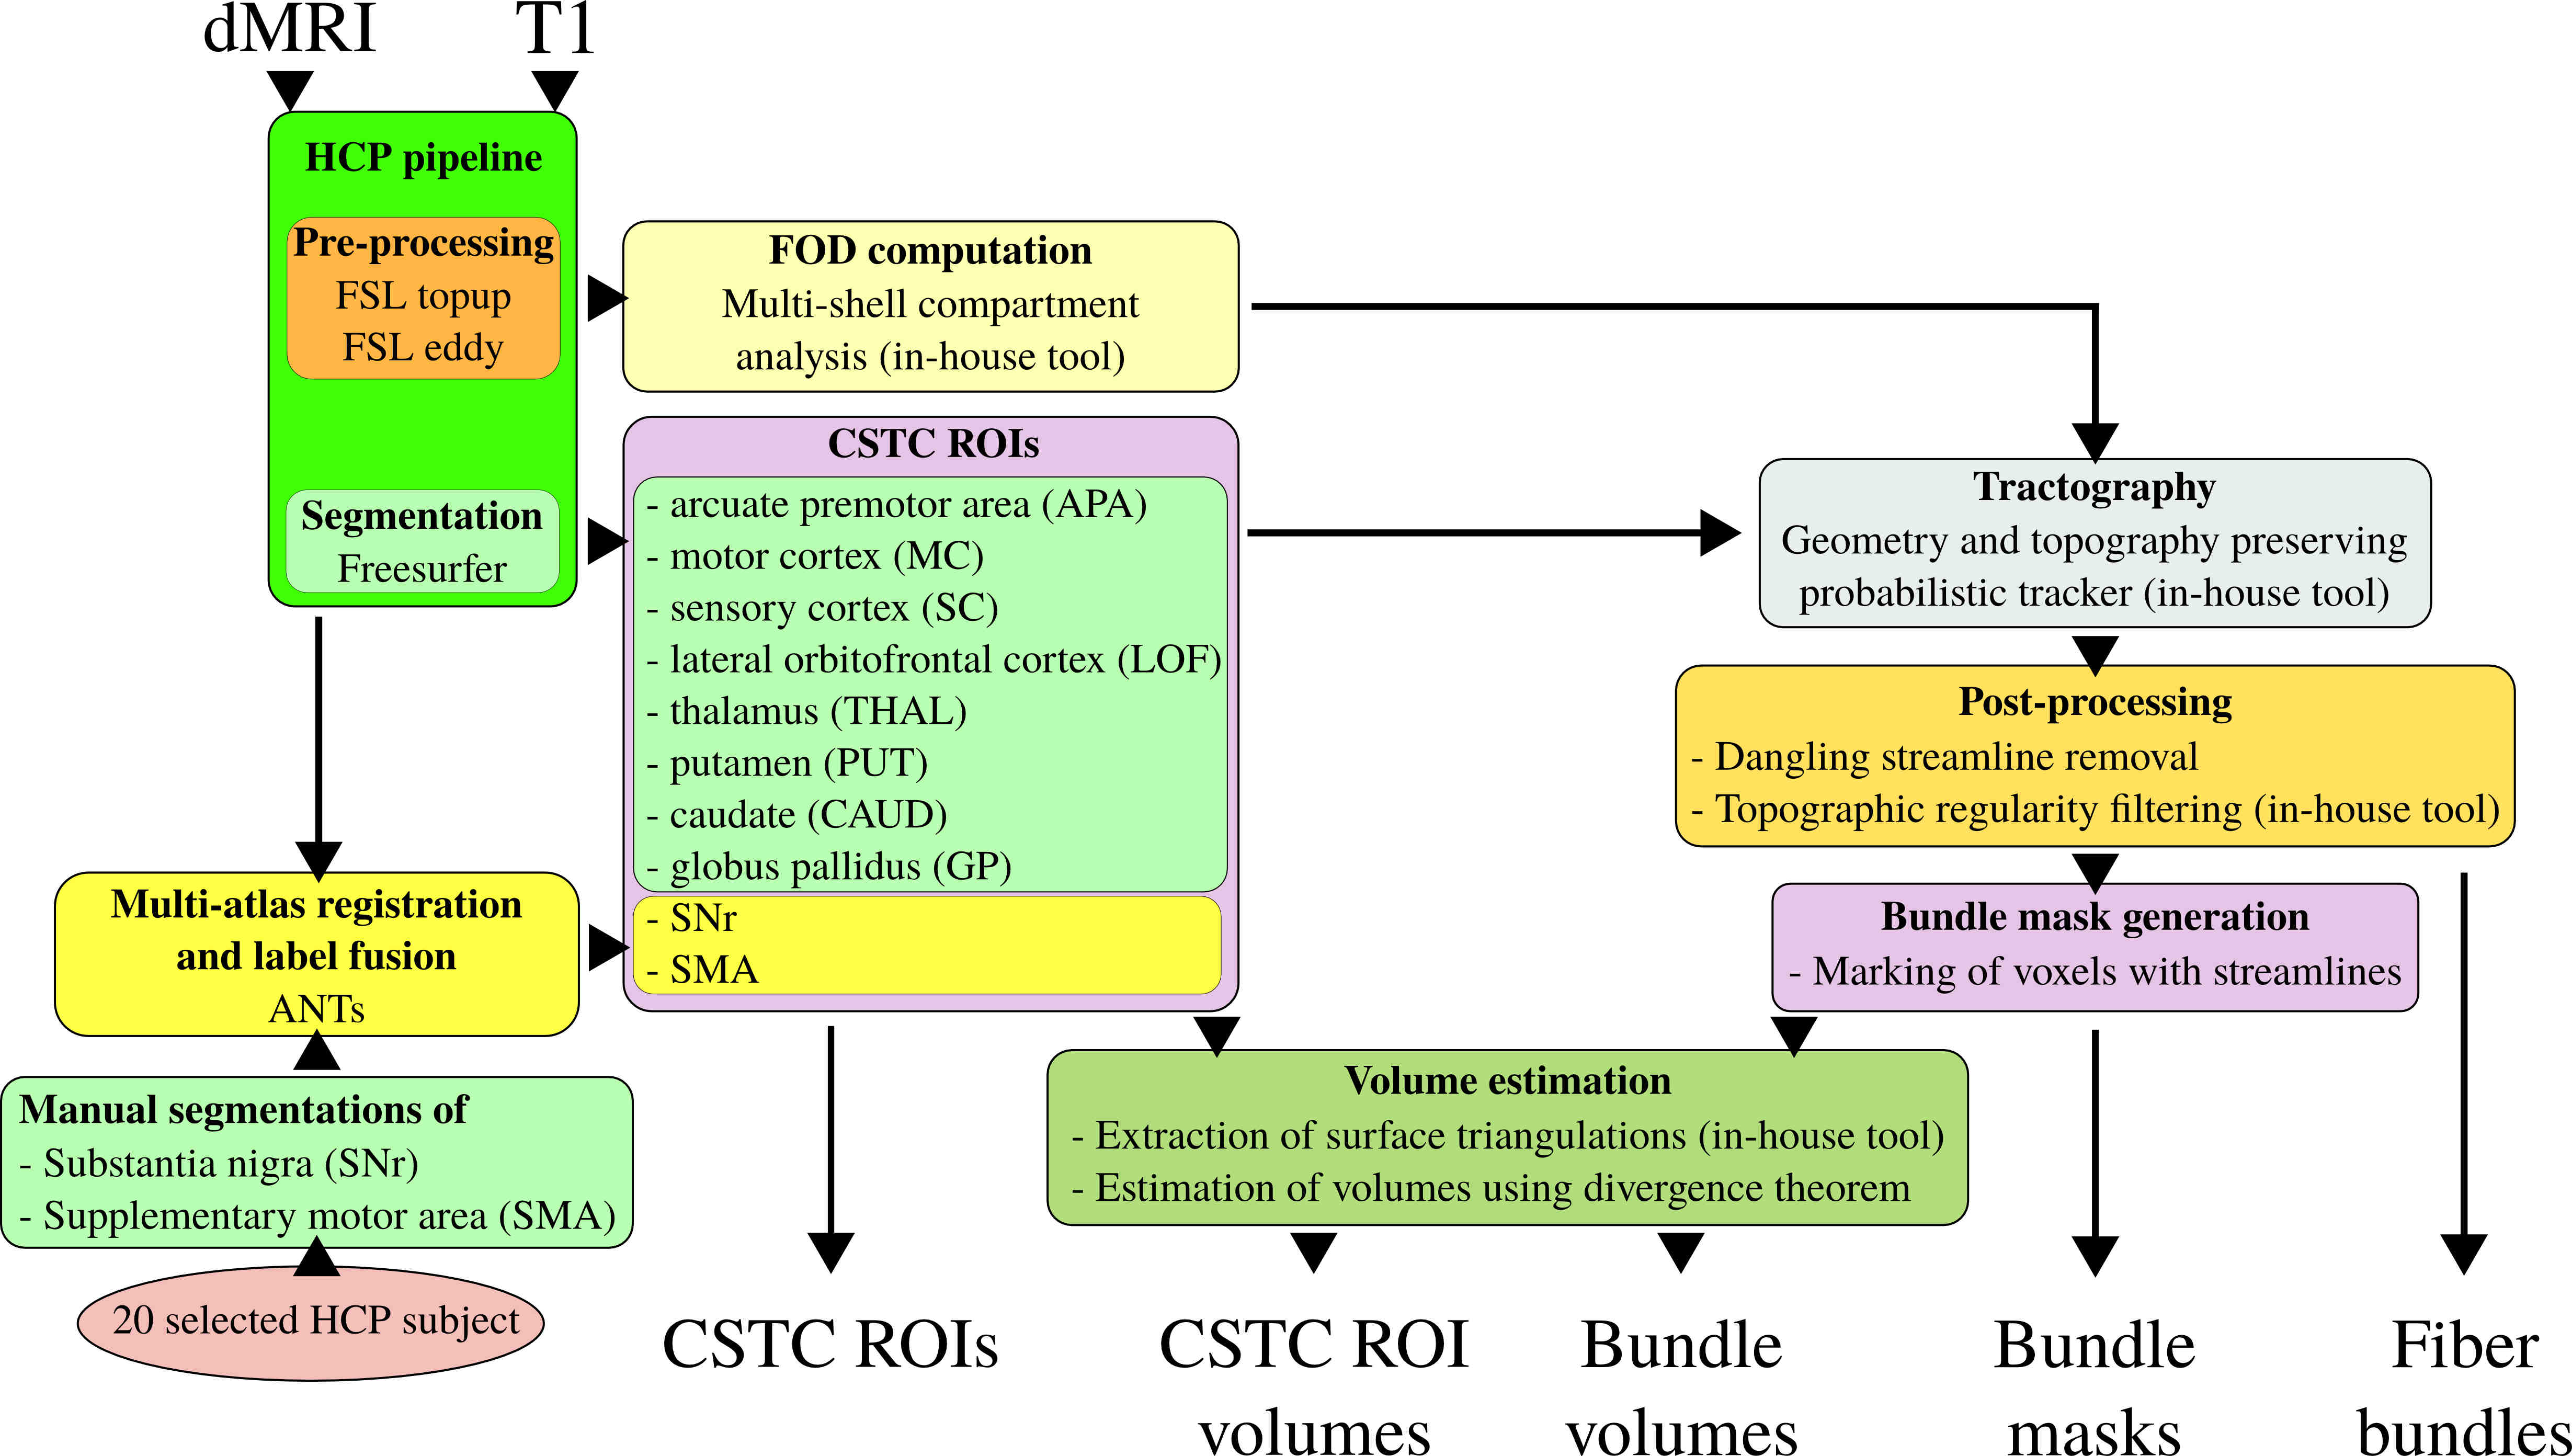
The complete workflow of the proposed automatic reconstruction of motor and lateral orbitofrontal CSTC loops is shown Figure 1. We followed the state-of-the-art HCP pipeline for the pre-processing of dMRI data and used FSL's topup [8,9] and eddy [10] tools. For structural processing of the T1 images, we performed a whole brain segmentation using Freesurfer [11].
CSTC loops involve several cortical and subcortical regions. The necessary region of interests (ROIs) for the motor and lateral orbitofrontal loops are listed in Figure 1 inside the CSTC ROIs box. We used the Freesurfer labels for all the regions when available. However, because the supplementary motor area (SMA) is missing and we were not able to obtain substantia nigra (SNr) reliably for all our subjects using Freesurfer, we manually segmented these regions on 20 selected subjects of the HCP dataset based on image quality. For each OCD and control subjects, SMA and SNr are then obtained by multi-atlas registration and label fusion using ANTs [12].
We jointly estimate the fiber orientation distributions (FOD) and compartment parameters using our algorithm in [13]. The FODs and the ROIs are used to reconstruct the fiber bundles of the CSTC loops using our geometry and topography preserving tractography algorithm proposed in [14]. All fiber bundles are removed of dangling streamlines and further cleaned up to ensure topographic regularity [15]. For each bundle, masks are created that are used for volume estimations based on the surface extraction algorithm proposed in [16].
The output of our fully automatic workflow yields (1) ROIs of the motor and lateral orbitofrontal CSTC loops (2) fiber bundles that form these CSTC circuits (3) masks of the fiber bundles (4) volumes of the ROIs and (5) volumes of the fiber bundles.
Results and discussions
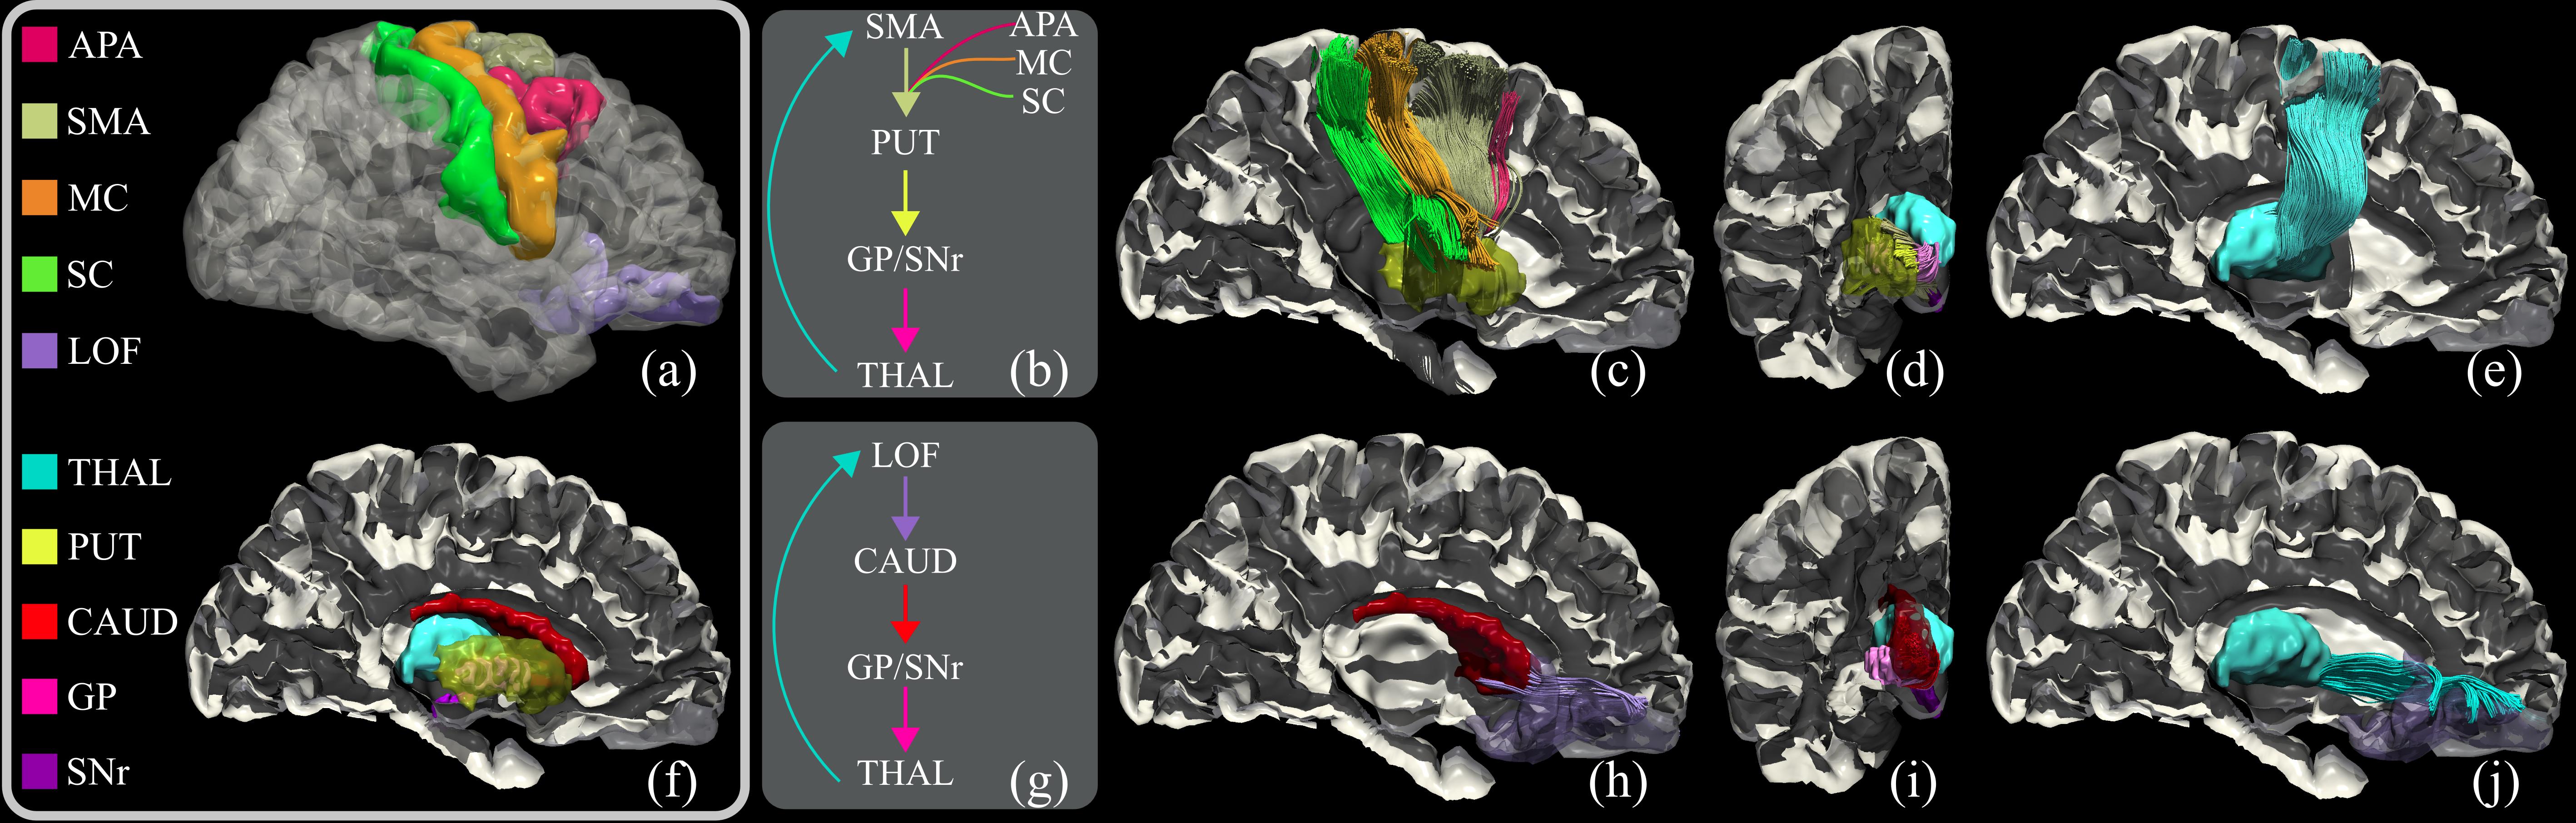
The reconstructed motor and lateral orbitofrontal CSTC loops for one of the control subjects are shown in Figure 2. Visualizations of the results based on our automatic approach show very clean and organized fiber bundle networks.
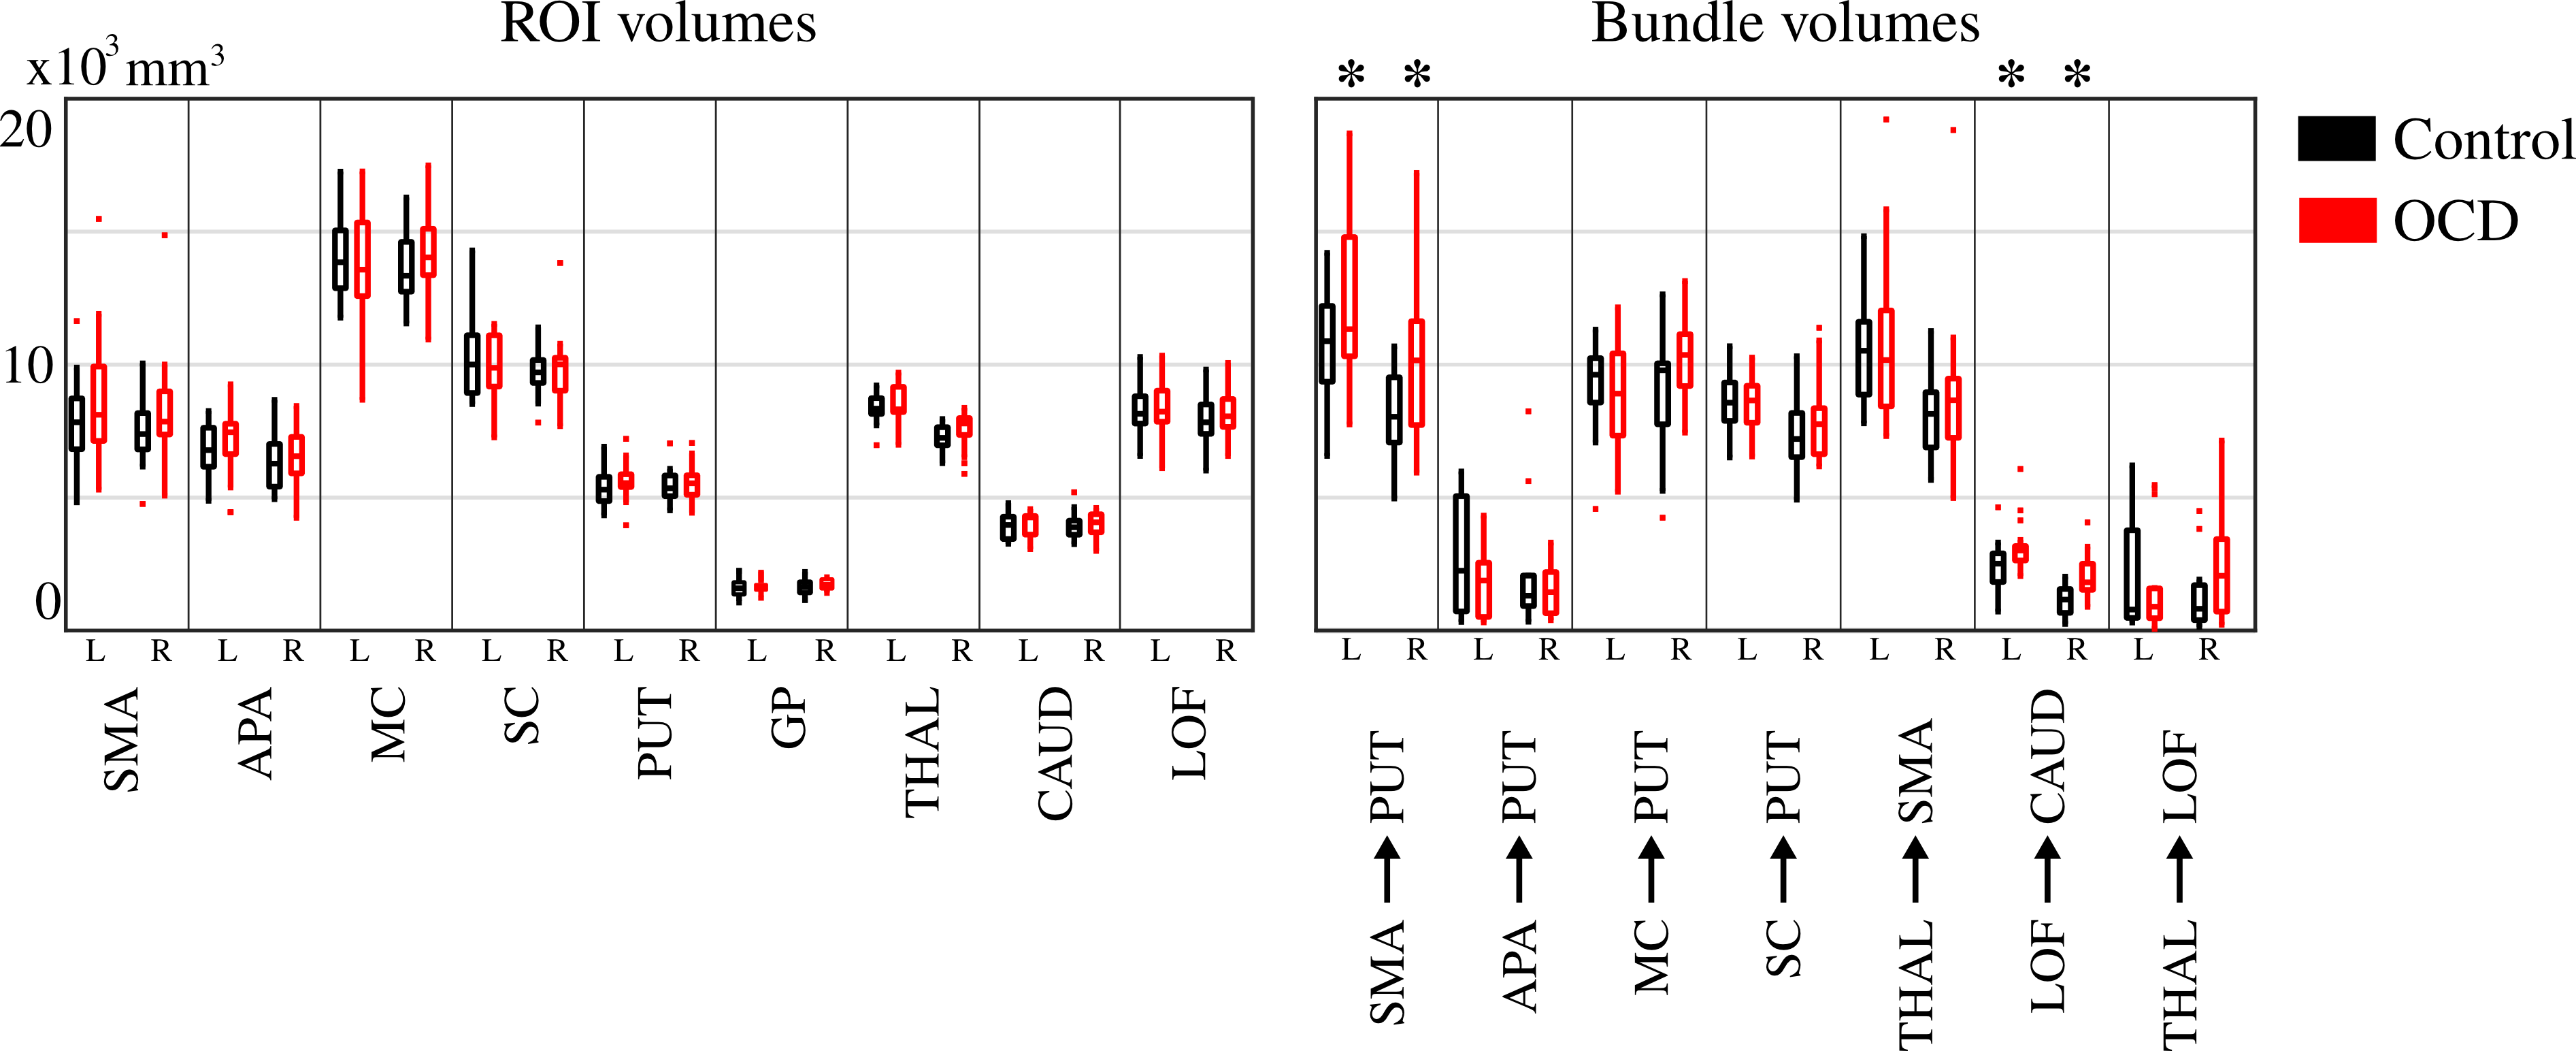
Volumes of the segmented ROIs and the fiber bundles are shown in Figure 3. Stars on top indicate that the volumes show statistically significant differences (p<0.05) between control and OCD groups obtained using t-test. The results point out that non of the segmented ROIs show significant volume differences between the two groups. The only significant differences are obtained using the fiber bundle volumes. These connections are the SMA to putamen (both left and right) of the motor loop and the lateral orbitofrontal cortex to caudate (both left and right) connections of the lateral orbitofrontal CSTC loop.
Conclusions
We proposed a fully automatic approach to reconstruct important CSTC loops that are relevant to several disorders such as OCD exemplified in this work. Our approach enables in-dept analysis of the individual connections and also the complete CSTC networks of the motor and lateral orbitofrontal loops.Acknowledgements
This work was supported by the National Institute of Health (NIH) under grants R01MH103657 and R01EB022744.References
[1] Martino D, Defazio G, Church AJ, Dale RC, Giovannoni G, Robertson MM, et al. Antineuronal antibody status and phenotype analysis in Tourette’s syndrome. Mov Disord. 2007 Jul 30;22(10):1424–9
[2] Vriend C, Pattij T, van der Werf YD, Voorn P, Booij J, Rutten S, et al. Depression and impulse control disorders in Parkinson’s disease: Two sides of the same coin? Neuroscience & Biobehavioral Reviews. 2014 Jan 1;38(Supplement C):60–71
[3] Takeshita S, Kurisu K, Trop L, Arita K, Akimitsu T, Verhoeff NPLG. Effect of subthalamic stimulation on mood state in Parkinson’s disease: evaluation of previous facts and problems. Neurosurg Rev. 2005 Jul 1;28(3):179–86
[4] Taylor SB, Lewis CR, Olive MF. The neurocircuitry of illicit psychostimulant addiction: acute and chronic effects in humans. Subst Abuse Rehabil. 2013 Feb 8;4:29–43
[5] Milad MR, Rauch SL. Obsessive-compulsive disorder: beyond segregated cortico-striatal pathways. Trends Cogn Sci (Regul Ed). 2012 Jan;16(1):43–51
[6] Alexander GE, DeLong MR, Strick PL. Parallel Organization of Functionally Segregated Circuits Linking Basal Ganglia and Cortex. Annual Review of Neuroscience. 1986;9(1):357–81
[7] Van Essen DC, Smith SM, Barch DM, Behrens TE, Yacoub E, Ugurbil K, Consortium WU-MH. The WU-Minn Human Connectome Project: an overview. Neuroimage. 2013;80:62-79
[8] Andersson JLR, Skare S, Ashburner J. How to correct susceptibility distortions in spin-echo echo-planar images: application to diffusion tensor imaging. NeuroImage, 20(2):870-888, 2003
[9] Smith SM, Jenkinson M, Woolrich MW, Beckmann CF, Behrens TEJ, Johansen-Berg H, Bannister PR, De Luca M, Drobnjak I, Flitney DE, Niazy R, Saunders J, Vickers J, Zhang Y, De Stefano N, Brady JM, and Matthews PM. Advances in functional and structural MR image analysis and implementation as FSL. NeuroImage, 23(S1):208-219, 2004
[10] Andersson JLR and Sotiropoulos SN. An integrated approach to correction for off-resonance effects and subject movement in diffusion MR imaging. NeuroImage, 125:1063-1078, 2016
[11] Fischl B. FreeSurfer. Neuroimage, vol. 62, no. 2, pp. 774–781, Aug. 2012
[12] Avants BB, Tustison NJ, Song G, Cook PA, Klein A, Gee JC. 2011. A reproducible evaluation of ANTs similarity metric performance in brain image registration. Neuroimage 54:2033-2044
[13] Tran G, Shi Y. 2015. Fiber Orientation and Compartment Parameter Estimation from Multi-Shell Diffusion Imaging. IEEE Trans Med Imaging 34:2320-2332
[14] Aydogan DB, Shi Y. Probabilistic Tractography for Topographically Organized Connectomes. Medical Image Computing and Computer-Assisted Intervention – MICCAI 2016: 19th International Conference, Athens, Greece, October 17-21, 2016, Proceedings, Part I. 2016:201-9
[15] Wang J, Aydogan DB, Varma R, Toga AW and Shi Y. Topographic Regularity for Tract Filtering in Brain Connectivity. in Information Processing in Medical Imaging, 2017, pp. 263–274
[16] Shi Y, Lai R, Morra JH, Dinov I, Thompson PM and Toga AW. Robust surface reconstruction via Laplace-Beltrami eigen-projection and boundary deformation. IEEE Trans Med Imaging, vol. 29, no. 12, pp. 2009–2022, Dec. 2010.
Figures