1564
A multi-shell self-calibrating Richardson-Lucy deconvolution approach for the simultaneous quantification of ODF and tissue properties of different diffusion domains in the kidneys.1Image Sciences Institute, UMC Utrecht and University Utrecht, Utrecht, Netherlands, 2Department of Radiology, UMC Utrecht, Utrecht, Netherlands
Synopsis
The advent of multi-shell diffusion MRI (dMRI) offers a viable substrate to apply deconvolution profiles in tissues characterized by partial volume of multiple diffusion domains, as the kidneys. In this work we present a modified damped Richardson-Lucy (mdRL) algorithm to perform spherical deconvolution over multiple diffusion domains. This method does not need to define a prior response function, which is dynamically estimated for each voxel, and allows to compute a fiber orientation distribution as well as relevant scalar metrics, as mean diffusivity and fractional anisotropy, for each diffusion domain. Applicability on two sample datasets is demonstrated as proof of concept.
Purpose
The damped Richardson-Lucy algorithm (dRL) has been originally proposed to deal with single-shell diffusion MRI (dMRI) data in the brain context(1). The advent of multi-shell dMRI offers a substrate to extend such approach outside the brain, where the assumptions of uniform response function do not hold(2). In this study we show the results achieved on the kidneys with a modified Richardson-Lucy deconvolution algorithm.Methods
The original dRL approach expresses the dMRI signal S acquired at diffusion weighting b and gradient directions g, as function of a kernel K(b,g,V,λ) and of the fibre orientation distribution (fod):
$$ S(b) = K({\tt{b}},{\bf{g}},{\tt{V}},{\lambda}) [1]$$.
K is generated with the diffusion tensor model for pre-defined eigenvalues (λ) of the assumed diffusion process over a set of solutions (V). Eq. [1] can be extended to accommodate multi-shell data by concatenating multiple instances of K. If n fod coexist in the same voxel, i.e. due to different processes as perfusion and tissue diffusion, this can be further extended:
$$S=[K_{1} ... K_{n}]*{[fod_{1} ... fod_{n}]}^{T} [2]$$
defining our modified damped Richardson-Lucy (mDRL) approach. Given a MD value for each class i, a grid of possible fractional anisotropy (FA) values can be exploited to generate K. Here we considered 10 FA values between 0 and 1. Once the individual fod have been computed, the associated signal fractions f were the sum of the respective fod amplitudes, while FA and MD values of each class were defined as:
$$\sum_{}^{}fod_i\cdot\bar{FA_i}/\sum_{}^{}fod_i$$
$$\sum_{}^{}fod_i\cdot\bar{MD_i}/\sum_{}^{}fod_i$$
where $$$\bar{FA_i}, \bar{MD_i}$$$ refer to the generative values used for K.
The method was tested on the MRI data of two left kidneys previously presented(2). The data of one kidney was arithmetically averaged across voxels and geometrically over diffusion weightings. This signal was fit with a as in a previous work(3) to derive the number of tissues classes n used for the data analysis of both kidneys.
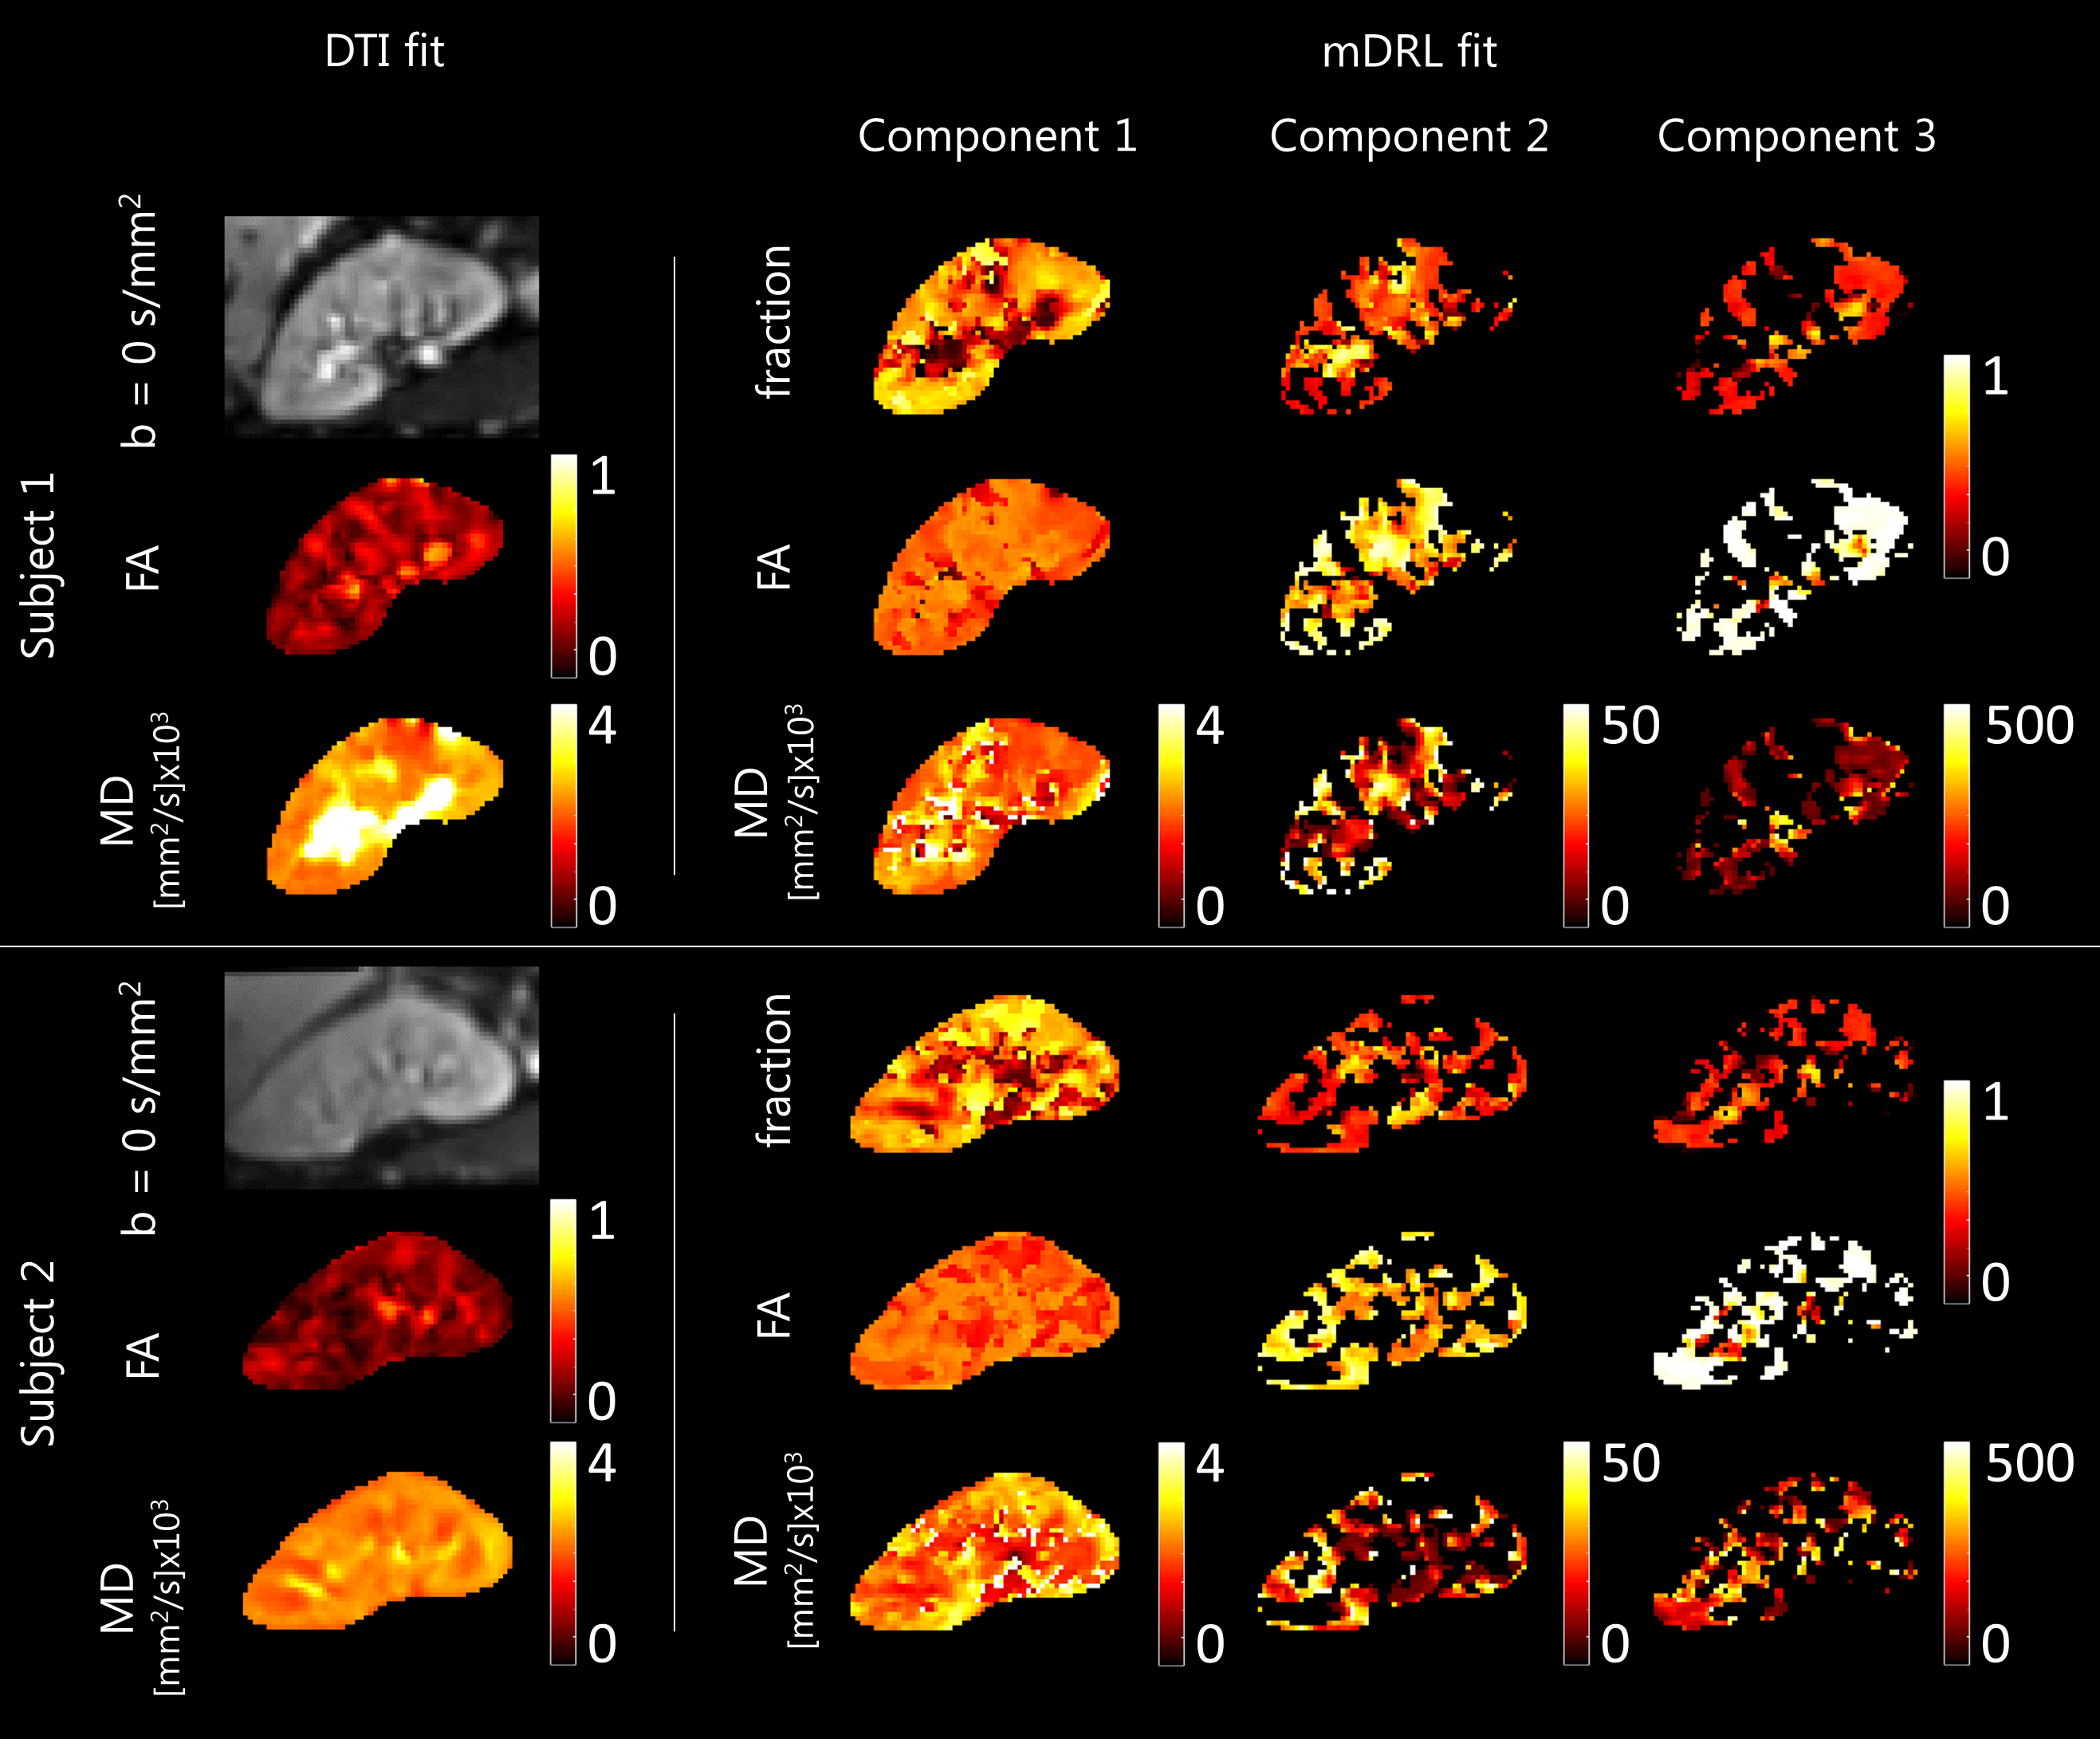
For each voxel, the geometric average and NNLS fit was performed to determine the MD value of each class i, then K was generated accordingly and the mdRL deconvolution performed as above described. A DTI fit(4) was performed on a subset of the data, b = 0, 100 and 300 s/mm2, from which FA and MD maps were computed for visual comparison.
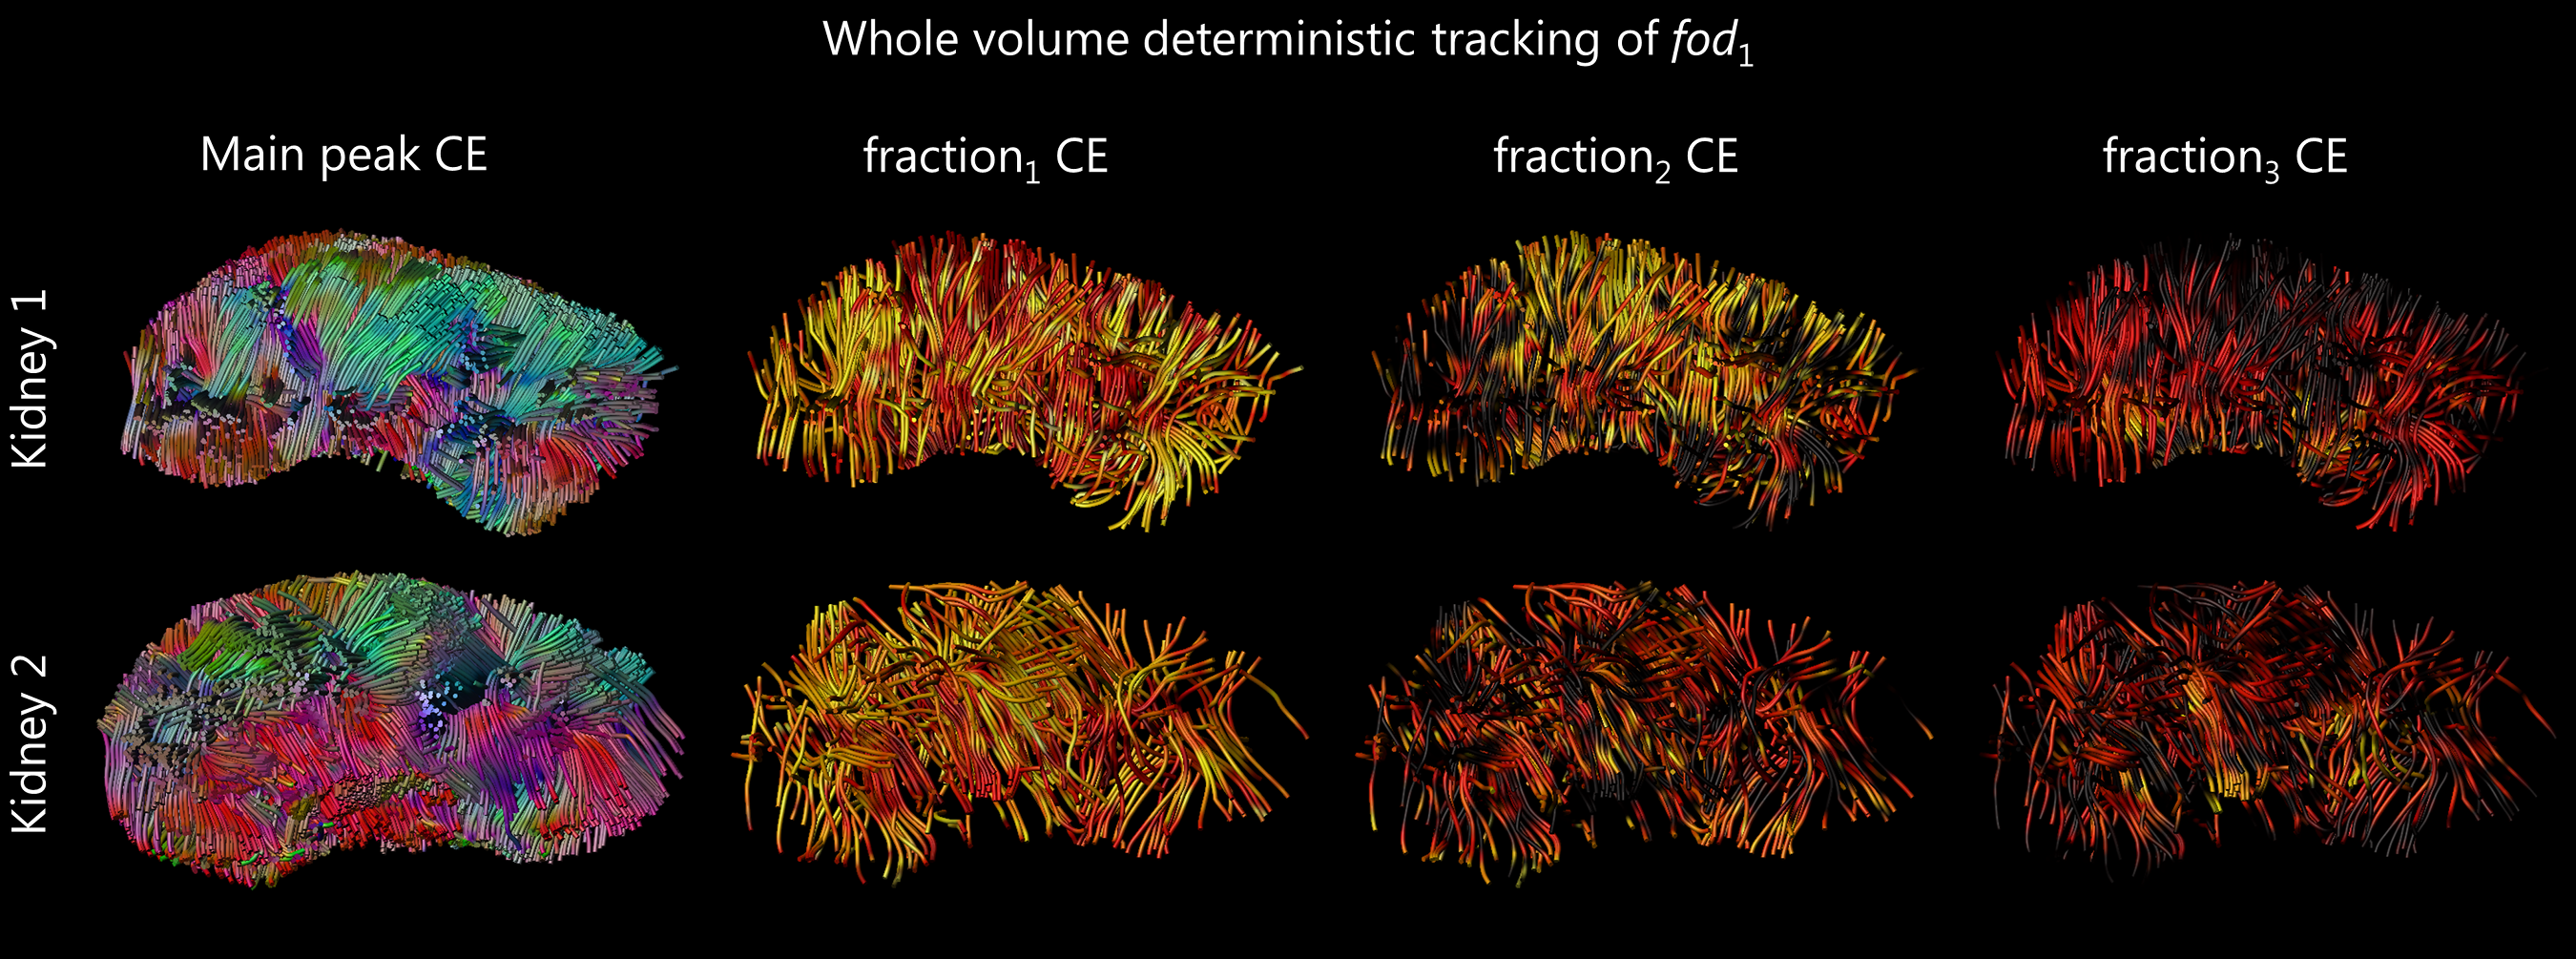
Finally, feasibility of the whole volume tracking using the mDRL results was exploited performing the whole brain tractography of fod1 with ExploreDTI(5).
Results
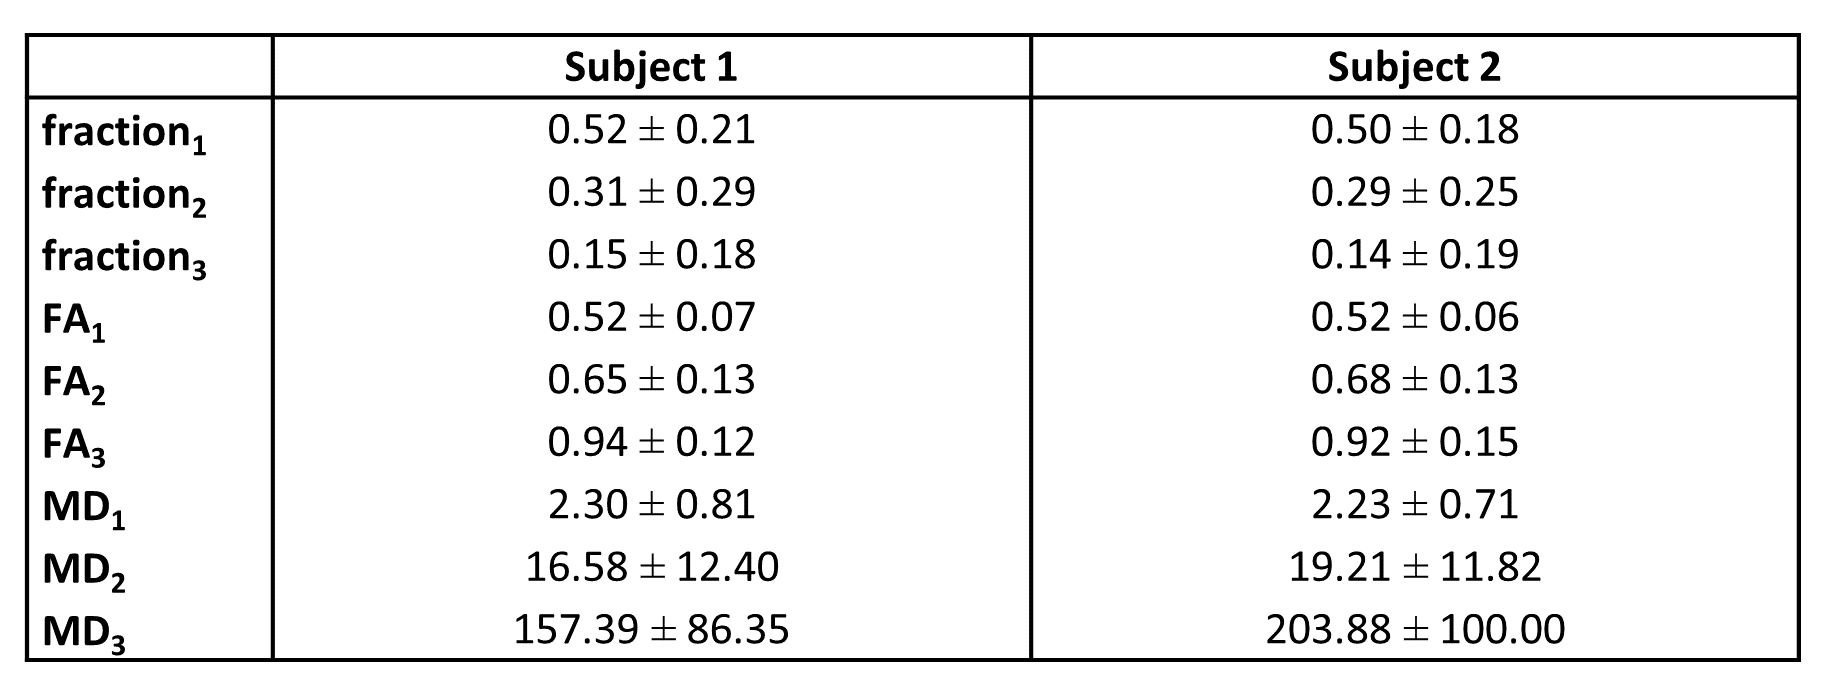
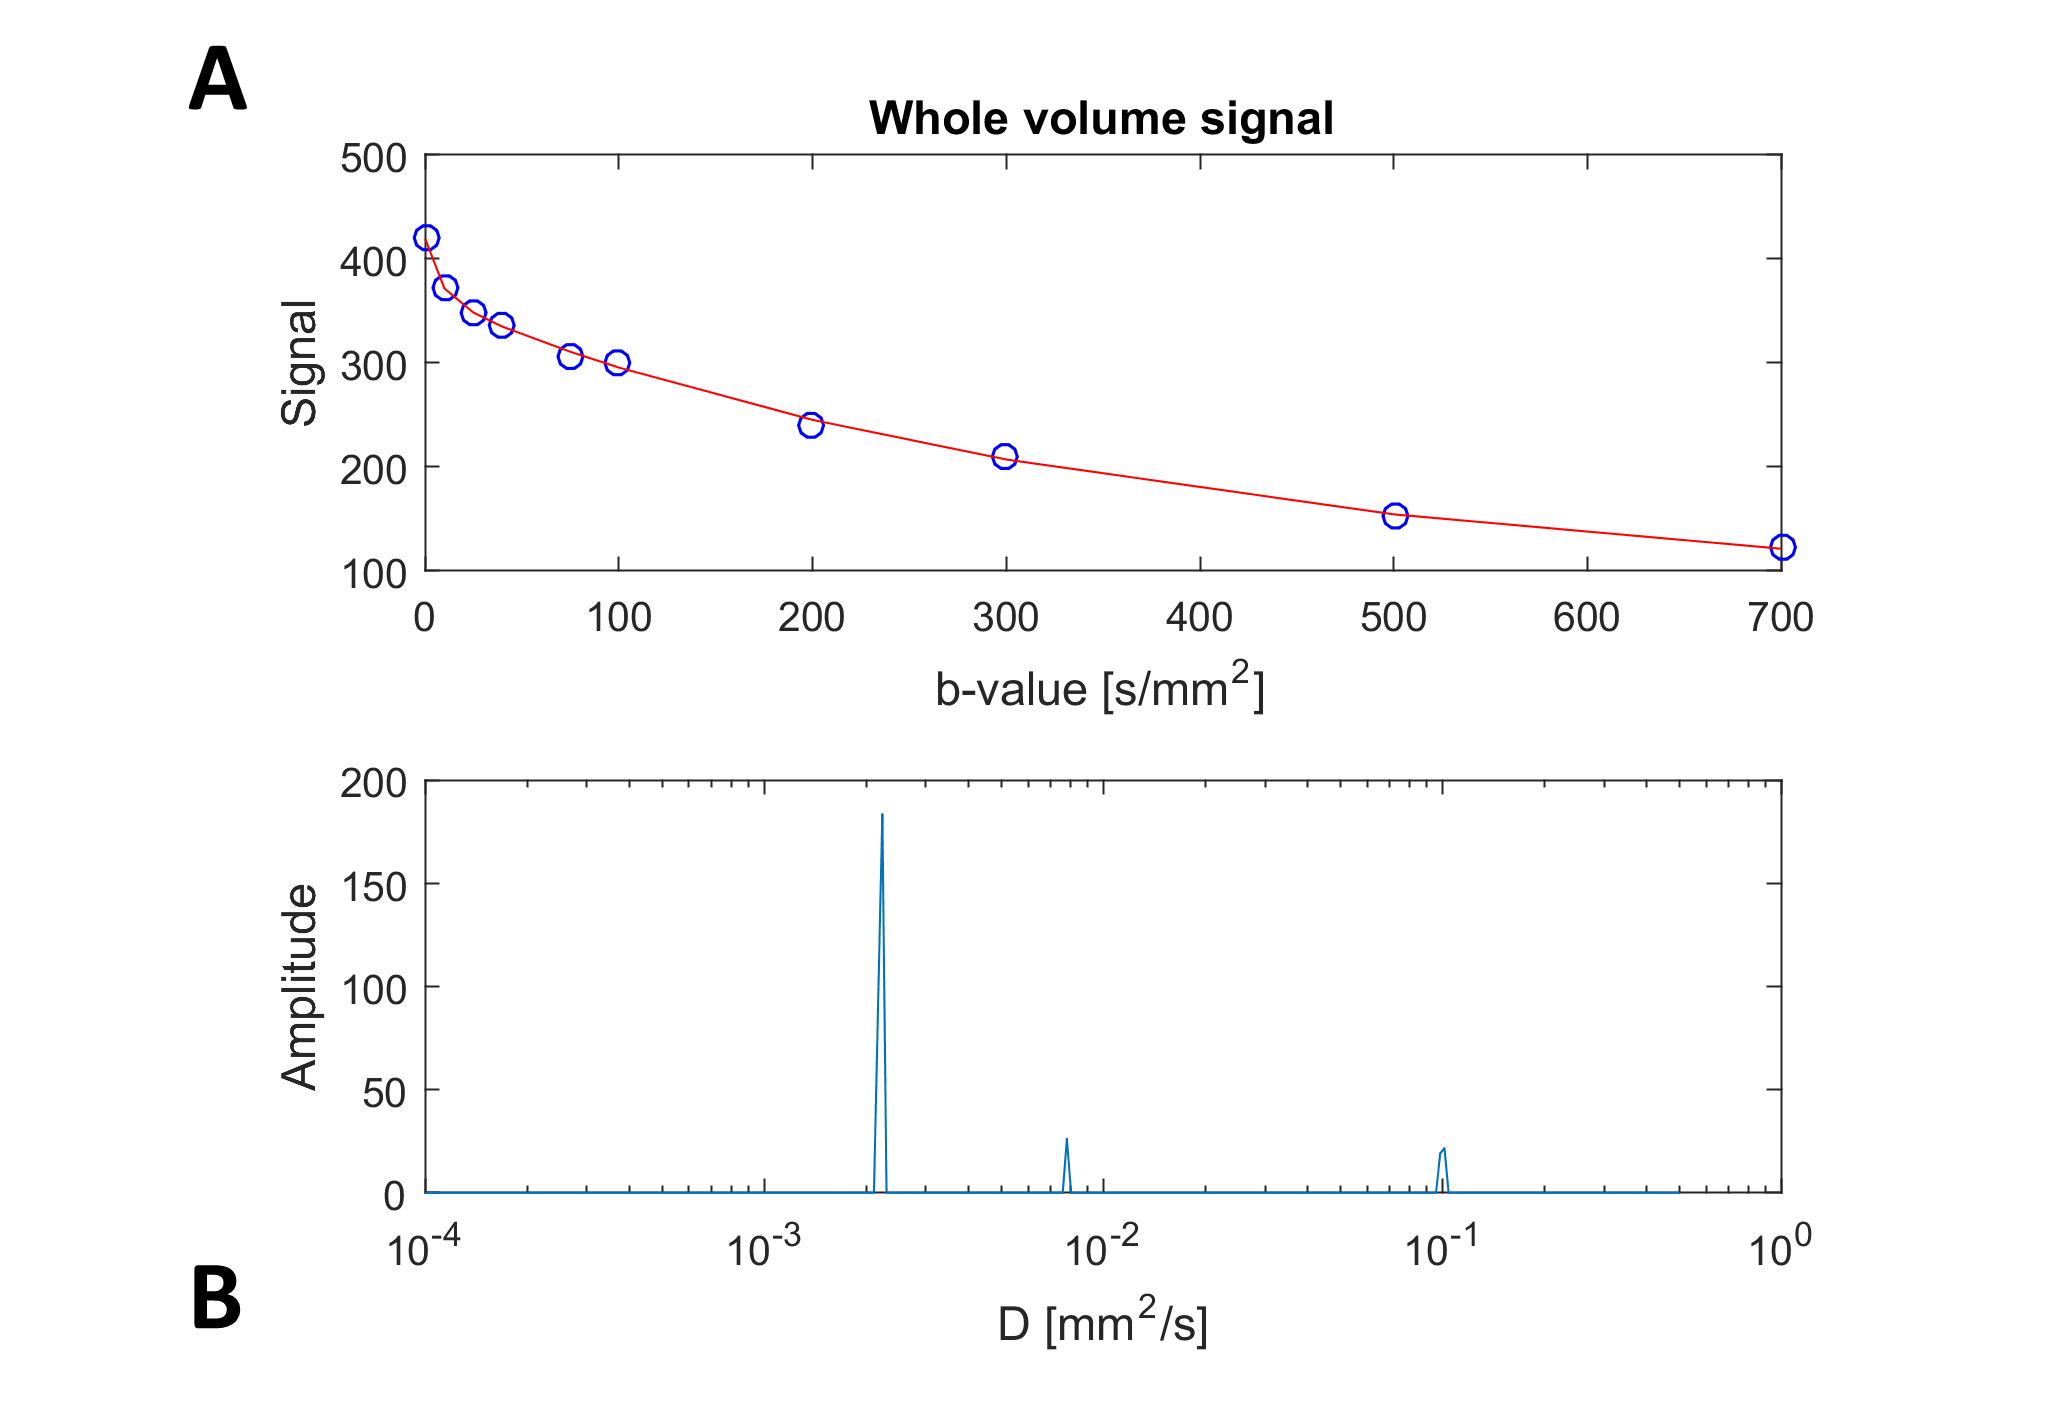
Figure 1A shows averaged signal of the dMRI data acquired on the first kidney and the performed NNLS fit. Three diffusion processes (n=3) were observed, as shown in Figure 1B, corresponding to diffusion coefficients D=2.2, 7.8 and 101.4 x 10⁻³mm2/s. Figure 2 shows an example slice of the derived voxel-wise fractions, FA and MD maps, as well as those from the DTI fit. Table 1 shows the average values of signal fractions, FA and MD of each class for both subjects. Very similar signal fractions were computed on both datasets, with the perfusion class representing around 15% of the total signal.
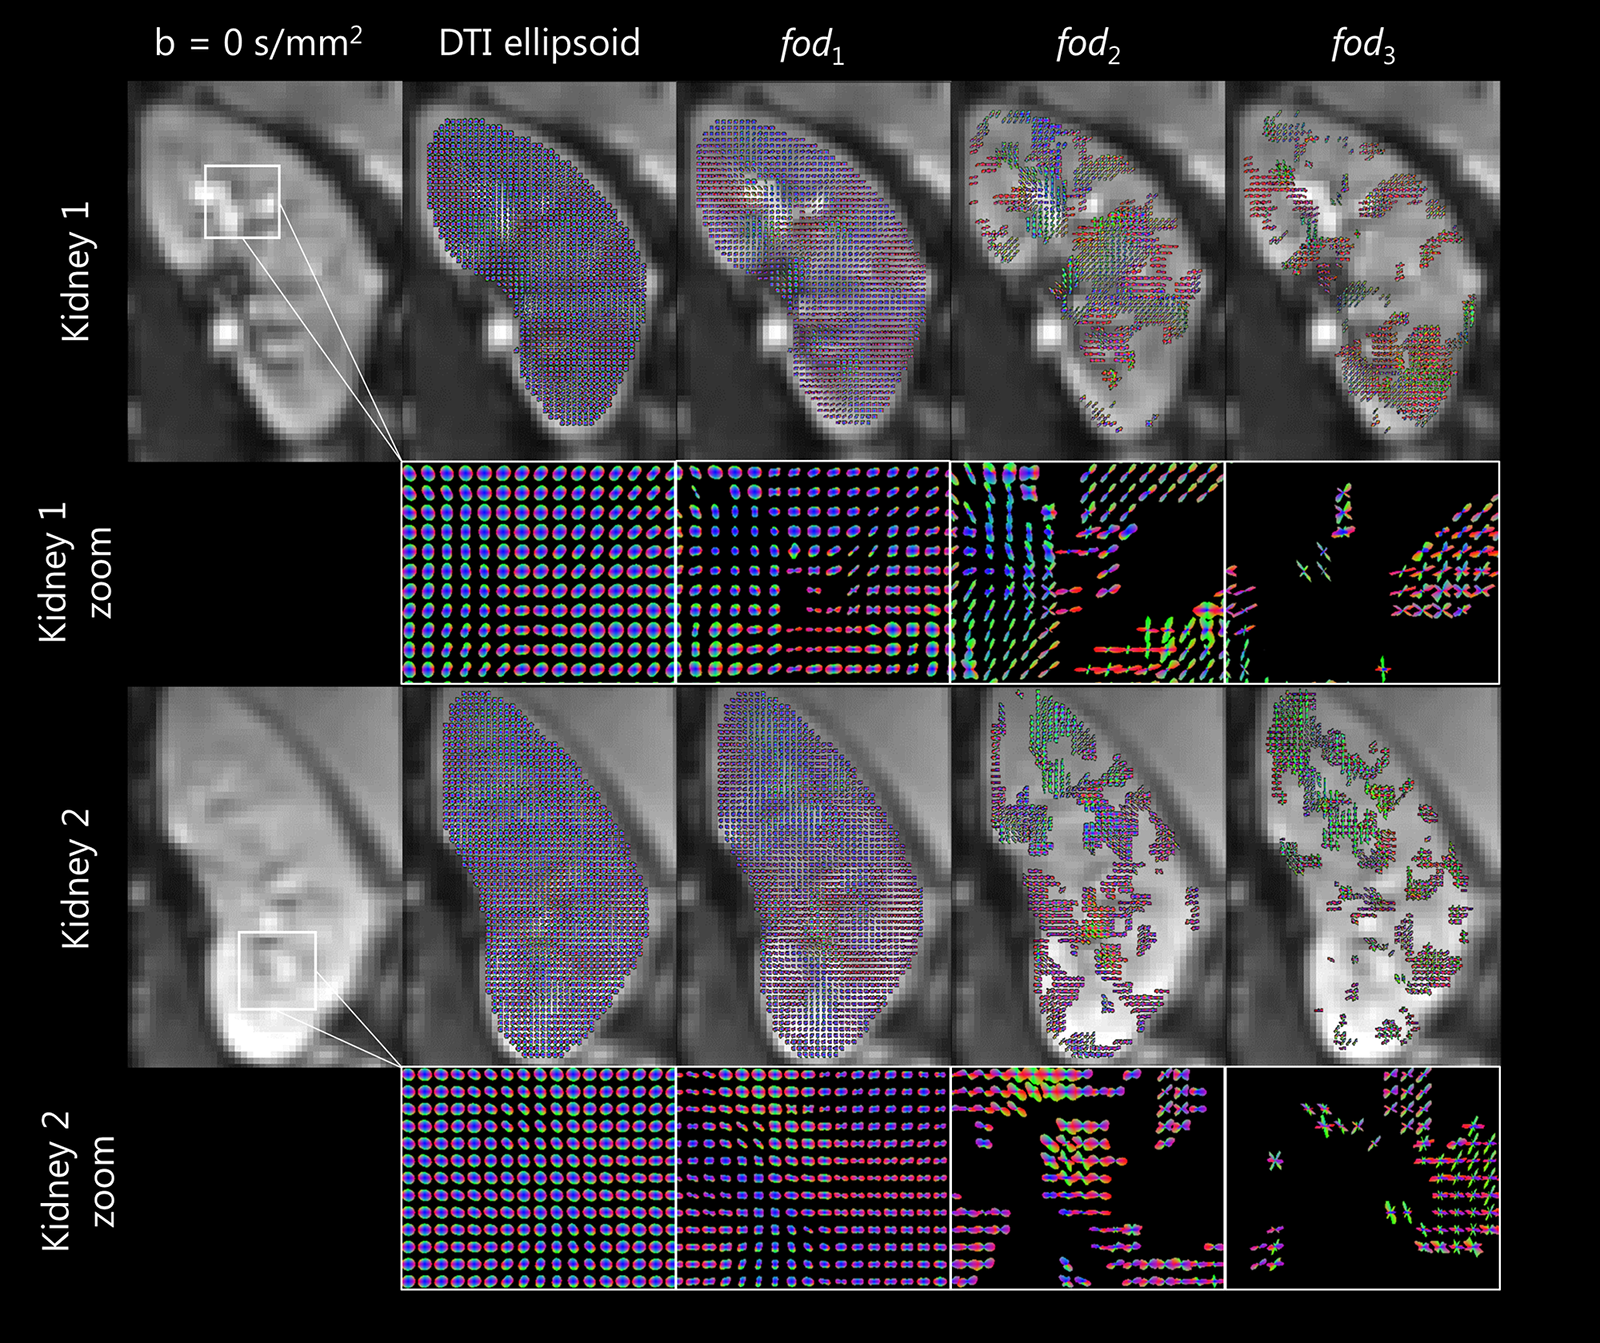
Figure 3, shows the 3D rendering of each fod on the example axial slice. All fod appeared to be generally sharper than the corresponding DTI ellipsoid, especially fod 2 and 3, in line with the aforementioned higher FA values. fod1 was non-zero in the whole volume, and represented the main diffusion component. The direction colour encoded tracking of fod1, which is shown in Figure 4, covered the whole kidney volume, and was plausible with known anatomy. Figure 4 also shows the tracts colour encoded by traversed fod fraction, which point the prominence of partial volume effects.
Discussion
In this work we have shown the feasibility of extending the mDRL approach outside the brain, achieving the reconstruction of diffusion process specific fod and associated scalar metrics. Three tissues classes with similar characteristics were identified on both dataset. We observed very high FA values for the perfusion component, suggesting anisotropy of the microvascular network(6). However, this study is characterized by some limitations. The very small number of tested datasets, only 2, points the need of further testing on more subjects. Finally, the estimation of fod2 and fod3 was very sensitive to motion artefacts. A further extension of mDRL toward robust deconvolution is now considered.Conclusion
The dRL approach has been extended to accommodate multi-shell data and multiple tissue types with a dynamically generated kernel, allowing to decompose data into diffusion process specific fod while computing relevant scalar metrics. Initial results on two kidney dataset suggest the feasibility of this approach on clinical compatible data.Acknowledgements
This research is supported by VIDI Grant 639.072.411 from the Netherlands Organisation for Scientific Research (NWO)References
1. Dell’acqua F, Scifo P, Rizzo G, Catani M, Simmons A, Scotti G, Fazio F. A modified damped Richardson-Lucy algorithm to reduce isotropic background effects in spherical deconvolution. Neuroimage [Internet] 2010;49:1446–58. doi: 10.1016/j.neuroimage.2009.09.033.
2. van Baalen S, Leemans A, Dik P, Lilien MR, ten Haken B, Froeling M. Intravoxel incoherent motion modeling in the kidneys: Comparison of mono-, bi-, and triexponential fit. J. Magn. Reson. Imaging 2016. doi: 10.1002/jmri.25519.
3. De Luca A, Arrigoni F, Bertoldo A, Froeling M. Deconvolution based approaches for the simultaneous quantification of IVIM, Free Water and non-Gaussian behavior in Diffusion MRI. In: International Society for Magnetic Resonance in Medicine. Hawaii; 2017.
4. Veraart J, Sijbers J, Sunaert S, Leemans A, Jeurissen B. Weighted linear least squares estimation of diffusion MRI parameters: Strengths, limitations, and pitfalls. Neuroimage [Internet] 2013;81:335–346. doi: 10.1016/j.neuroimage.2013.05.028.
5. Leemans A, Jeurissen B, Sijbers J, Jones DK. ExploreDTI: a graphical toolbox for processing, analyzing, and visualizing diffusion MR data. In: International Society for Magnetic Resonance in Medicine. Hawaii; 2009.
6. Karampinos DC, King KF, Sutton BP, Georgiadis JG. Intravoxel partially coherent motion technique: Characterization of the anisotropy of skeletal muscle microvasculature. J. Magn. Reson. Imaging 2010;31:942–953. doi: 10.1002/jmri.22100.
Figures