1561
Is removal of weak connections necessary for dense weighted structural connectomes?1Florey Institute of Neuroscience and Mental Health, Melbourne, Australia, 2Florey Department of Neuroscience and Mental Health, University of Melbourne, Melbourne, Australia
Synopsis
Recent advances in tractography enable the generation of weighted structural connectomes where connection strengths are biologically meaningful. However, use of probabilistic tracking algorithms leads to dense graphs with many low-strength connections, many of which may be considered erroneous. Historically, the existence of such false positives necessitated thresholding of weak connections; this was especially relevant when constructing binary connectomes. Here we show that in dense weighted structural connectomes, the contribution of weak connections to network metrics is negligible and, thus, their removal is not necessary; indeed, the confounds introduced by an arbitrary cut-off value may in fact render this process undesirable.
INTRODUCTION
A major theme in structural connectomics is the reconstruction of erroneous connections (i.e. false positives or FPs). This problem is exacerbated when constructing connectomes using modern techniques such as constrained spherical deconvolution (CSD) 1,2 followed by probabilistic tractography. Whereas these techniques are able to detect more biologically valid connections than was previously possible 3,4 – resulting in a dense weighted connectome, which is expected to provide a deeper understanding of brain networks 5 -- they might also reconstruct more FPs.6
Because FPs can have a detrimental effect on graph topological properties,7-9 it is a common practice to attempt to remove them by stringent thresholding of weaker connections.7 However, thresholding entails the assumption that most FPs are weak connections, and is also arbitrary.8 Therefore, it would be desirable to utilize connectomes that do not require such thresholding.
Here we investigate the hypothesis that for dense weighted structural connectomes (as opposed to either sparse 8 or binary 7 connectomes), it is not necessary anymore to remove weak connections.
METHODS
We analyzed 97 preprocessed HARDI datasets from the Human Connectome Project (HCP).10-12 For each subject, we performed bias-field correction 13 and multi-shell multi-tissue CSD to estimate fibre orientation distributions.14 We generated 10 million probabilistic streamlines using the iFOD2 algorithm 15 and anatomically-constrained tractography (ACT),16 and computed a weight for each streamline using SIFT2 17 to make quantification of connectivity more biologically meaningful.18 Each subject’s connectome was constructed using 84 regions parcellated in native space 18 (cortex and cerebellum using freesurfer 19; subcortical regions using FIRST 20); connection strengths were computed by summing the weights of the relevant streamlines. All processing was performed using MRtrix3.21
To examine the contribution of weak connections to the resulting dense connectomes, we removed varying amounts of weak connections (each time, keeping only the X% strongest connections, resulting in a graph pruned to X% density), and investigated the effect on a range of (weighted) network metrics. This was performed with stepwise decreasing connectome density, to detect the point where each metric has an effective change, based on two criteria: it reaches either 5% or 1 SD change compared to its value in the original connectome (SD being the standard deviation of each metric in the original connectome).
RESULTS
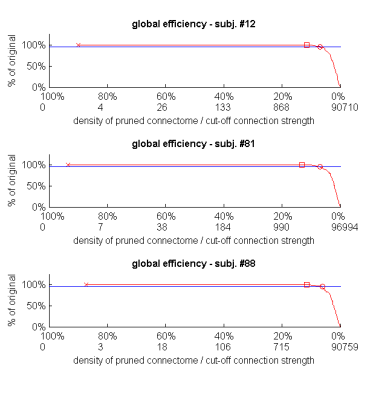
The 97 generated connectomes had an average density of 93.6%. When progressively removing weak connections, there was no detectable change in global efficiency down to densities of 13.2% on average (Fig. 1, squares). A 5% reduction in global efficiency relative to the original connectome of each subject finally occurred at the average density of 6.5% (circles).
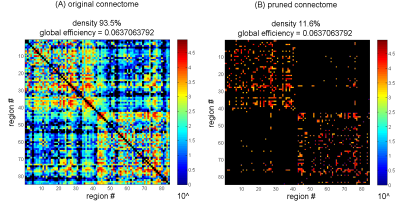
These results are qualitatively demonstrated in Fig. 2: pruning one of the connectomes to a density as low as 11.6% revealed no detectable change in global efficiency.
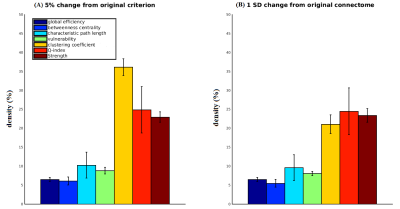
Fig. 3A shows how far density had to be reduced in each subject to reach a 5% change in selected networks metrics (circles in Fig. 1). Similar densities for the 1 SD criterion (Fig. 3B) suggest that our results are not greatly dependent on the choice of criteria (excluding clustering coefficient).
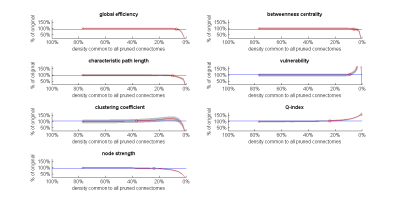
Fig. 4 shows similar trends in the effect of weak-connection removal, but this time, at the group level, i.e., when examining each metric averaged across all 97 subjects rather than for each subject individually.
DISCUSSION
Our results show that, in the context of dense weighted structural connectomes, removal of weak connections is inconsequential down to quite low densities, demonstrating that the contribution of weak connections (whether FPs or not) to network metrics is generally limited. This is especially pronounced in the metrics that rely on shortest path calculation (global efficiency, betweenness centrality, characteristic path length, vulnerability) where pruning the connectome to densities as low as 6.1%-10.2% produces only a slight change -- presumably due to the long/heavy tail distribution of this class of connectomes. On the other hand, pruning the connectome even further leads to unstable behavior, as evident by the rapid continuous change in all metrics studied except maybe for clustering coefficient (Fig. 4). This instability is likely a consequence of true positives being removed at these high cut-off values.CONCLUSION
We conclude that removal of weak connections is not necessary for dense weighted structural connectomes. Moderate pruning (down to densities of around 10%-35%, depending on network metric) is inconsequential, whereas more substantial pruning does have an effect on network metrics but leads to instability as a function of density; given the lack of benefits, the drawbacks of pruning (an extra step in the analysis, and an arbitrary cut-off value that complicates statistical inference and inter-study comparisons) do not support its use.Acknowledgements
This research was supported by the National Health
and Medical Research Council of Australia, the Australian Research Council, the
Victorian Government’s Operational Infrastructure Support Grant, and Melbourne
Bioinformatics at the University of Melbourne, grant number UOM0048. Data were provided by the Human Connectome Project, WU-Minn Consortium
(Principal Investigators: David Van Essen and Kamil Ugurbil; 1U54MH091657)
funded by the 16 NIH Institutes and Centers that support the NIH Blueprint for
Neuroscience Research; and by the McDonnell Center for Systems Neuroscience at
Washington University.
References
1. Tournier JD, Calamante F, Gadian DG, Connelly A. Direct estimation of the fiber orientation density function from diffusion-weighted MRI data using spherical deconvolution. NeuroImage. 2004; 23(3):1176-85.
2. Tournier JD, Calamante F, Connelly A. Robust determination of the fibre orientation distribution in diffusion MRI: non-negativity constrained super-resolved spherical deconvolution. Neuroimage. 2007; 35(4):1459-72.
3.
Jeurissen B, Leemans A, Tournier
JD, et al. Investigating the prevalence of complex fiber configurations in
white matter tissue with diffusion magnetic resonance imaging. Human brain
mapping. 2013; 34(11):2747-66.
4.
Farquharson S, Tournier JD,
Calamante F, et al. White matter fiber tractography: why we need to move beyond
DTI. Journal of neurosurgery. 2013; 118(6):1367-77.
5.
Bassett DS, Bullmore ET.
Small-world brain networks revisited. The Neuroscientist. 2017; 23(5):499-516.
6.
Maier-Hein KH. et al. The
challenge of mapping the human connectome based on diffusion tractography.
Nature communications. 2017; 8:1349:
7.
Zalesky A, Fornito A, Cocchi L, et
al. Connectome sensitivity or specificity: which is more important?.
NeuroImage. 2016; 142:407-20.
8.
Drakesmith M, Caeyenberghs K, Dutt
A, et al. Overcoming the effects of false positives and threshold bias in graph
theoretical analyses of neuroimaging data. NeuroImage. 2015; 118:313-33.
9.
Ginestet CE, Nichols TE, Bullmore
ET, Simmons A. Brain network analysis: separating cost from topology using
cost-integration. PloS one. 2011; 6(7):e21570.
10. Van Essen DC, Smith SM, Barch DM, et al. The WU-Minn human connectome project: an overview. Neuroimage. 2013; 80:62-79.
11. Andersson JL, Skare S, Ashburner J. How to correct
susceptibility distortions in spin-echo echo-planar images: application to
diffusion tensor imaging. Neuroimage. 2003; 20(2):870-88.
12. Andersson JL, Sotiropoulos SN. An integrated approach to
correction for off-resonance effects and subject movement in diffusion MR
imaging. Neuroimage. 2016; 125:1063-78.
13. Tustison NJ, Avants BB, Cook PA, et al. N4ITK: improved N3 bias
correction. IEEE transactions on medical imaging. 2010; 29(6):1310-20.
14. Jeurissen B, Tournier JD, Dhollander T, et al. Multi-tissue
constrained spherical deconvolution for improved analysis of multi-shell
diffusion MRI data. NeuroImage. 2014; 103:411-26.
15. Tournier JD, Calamante F, Connelly A. Improved probabilistic
streamlines tractography by 2nd order integration over fibre orientation
distributions. InProc. 18th Annual Meeting of the Intl. Soc. Mag. Reson.
Med.(ISMRM) 2010 (p. 1670).
16. Smith RE, Tournier JD, Calamante F, Connelly A.
Anatomically-constrained tractography: improved diffusion MRI streamlines
tractography through effective use of anatomical information. Neuroimage. 2012;
62(3):1924-38.
17. Smith RE, Tournier JD, Calamante F, Connelly A. SIFT2: Enabling
dense quantitative assessment of brain white matter connectivity using
streamlines tractography. NeuroImage. 2015; 119:338-51.
18. Smith RE, Tournier JD, Calamante F, Connelly A. The effects of
SIFT on the reproducibility and biological accuracy of the structural connectome.
Neuroimage. 2015; 104:253-65.
19. Desikan RS, Ségonne F, Fischl B, et al. An automated labeling
system for subdividing the human cerebral cortex on MRI scans into gyral based
regions of interest. Neuroimage. 2006; 31(3):968-80.
20. Patenaude B, Smith SM, Kennedy DN, Jenkinson M. A Bayesian model
of shape and appearance for subcortical brain segmentation. Neuroimage. 2011;
56(3):907-22.
21. Tournier J, Calamante F, Connelly A. MRtrix: diffusion
tractography in crossing fiber regions. International Journal of Imaging
Systems and Technology. 2012; 22(1):53-66.
22. Rubinov M, Sporns O. Complex network measures of brain
connectivity: uses and interpretations. Neuroimage. 2010; 52(3):1059-69.
23. Zhang B, Horvath S. A general framework for weighted gene
co-expression network analysis. Statistical applications in genetics and
molecular biology. 2005; 4(1).
24. Yeh CH, Smith RE, Liang X, et al. Correction for diffusion MRI
fibre tracking biases: The consequences for structural connectomic metrics.
Neuroimage. 2016; 142:150-62.
25. Iturria-Medina Y, Sotero RC, Canales-Rodríguez EJ, et al.
Studying the human brain anatomical network via diffusion-weighted MRI and
Graph Theory. Neuroimage. 2008; 40(3):1064-76.
Figures

Fig. 1. The effect of weak-connection removal on global efficiency (weighted version) of dense weighted structural connectomes.
For 3 random subjects, global efficiency (red line) at different densities is shown as a percentage of the global efficiency of the original connectome. The horizontal blue line represents 5% change in global efficiency. The x-axis specifies both the pruned connectome densities, and the weight up to which connections are removed to achieve each density. Cross: density of the original connectome. Square: the lowest density reached without detectable change in global efficiency. Circle: global efficiency is exactly 95% of its original connectome value.

Fig. 2. Removal of weak connections produces no detectable change in global efficiency down to relatively low densities.
This example shows the original connectome of subject #12 from Fig. 1 (A) and the same connectome pruned to the lowest density that produced no detectable change (B) (top square mark in Fig. 1). Total connection weight was 5,122,728 and 4,372,539 respectively (excluding intra-node connections). For the pruning, all connections whose weight falls below 2361 were removed. Colorbar shows connection strength. Missing/removed connections are in black. Global efficiency was calculated on connection weights normalized by max weight, and excluding intra-node connections.

Fig. 3. The effect of weak-connections removal on network metrics (weighted versions) of dense weighted structural connectomes.
For each network metric, bar height indicates average connectome density (+/- standard deviation) required to produce 5% (A) or 1 SD (B) change in metric value relative to the original connectome (when progressively reducing density in each of the 97 subjects studied). Metrics are adopted from the Brain Connectivity Toolbox 22 other than clustering coefficient 23,24 and vulnerability 25. Intra-node connections were excluded from all calculations. The results are similar for both criteria, with the exception of the clustering coefficient.

Fig. 4. The effect of weak-connections removal on group-average network metrics of dense weighted structural connectomes.
For each metric, group-averages (red) are shown as a percentage of the group-average metric calculated on the original connectomes (SD in light grey). Density on x-axis is the density to which all individual connectomes are pruned to before each averaging. Blue lines and marks are as in Fig. 1. The variability of metric values across subjects is generally low, with clustering coefficient having somewhat higher variability. Connectome densities required for 5% change in network metrics (circles) resemble those from the individual-level analysis (Fig. 3A).