1559
Spherical deconvolution of diffusion MRI data with tensor-valued encodings1imec-Vision Lab, Dept. of Physics, University of Antwerp, Antwerp, Belgium, 2Clinical Sciences, Lund, Lund University, Lund, Sweden, 3Random Walk Imaging AB, Lund, Sweden
Synopsis
Multi-tissue constrained spherical deconvolution (MT-CSD) exploits the characteristic b-value dependency of each tissue type to estimate both the apparent tissue densities and the full white matter (WM) fiber orientation distribution function from diffusion MRI data. In this work, we extend the MT-CSD approach to account for data acquired with nonlinear and multiple b-tensor shapes and show that multiple b-tensor shapes can provide a new means of contrast between tissue types, in particular between gray matter and WM. Our approach provides high-quality apparent tissue density maps and high-quality fiber tracking from data with multiple b-tensor shapes, even with sparse q-space samplings.
Introduction
Multi-tissue constrained spherical deconvolution (MT-CSD) simultaneously estimates the full white matter (WM) fiber orientation distribution function (fODF) and the apparent densities of cerebrospinal fluid (CSF) and grey matter (GM) directly from multi-shell diffusion MRI (dMRI) data1. Up till now, MT-CSD has been limited to conventional scans with stick-shaped (linear) b-tensors. However, several measuring approaches have been proposed that yield b-tensors of variable shapes, e.g. planes and spheres2–4. These unconventional schemes have mainly been used for quantification of tissue parameters while discarding orientation information through powder averaging5,6. In this work, we extend MT-CSD to data with (multiple) arbitrary tensor encoding shapes and explore the capabilities of this new approach to discriminate tissue types and infer fiber orientations.Methods
Acquisition: Data were acquired on a 3T MAGNETOM Prisma with a 20-channel head coil array (Siemens Healthcare GmbH, Erlangen, Germany) with a prototype spin-echo sequence that enables linear (LTE), planar (PTE) and spherical tensor encoding (STE)3,7. Maxwell-compensated waveforms8 were optimized numerically9, and were spectrally matched10. For each b-tensor, data was acquired using b = [0,700,1200,2800] s/mm2, distributed over 5, 17, 29 and 49 directions, respectively, TR/TE = 8000/110 ms/ms, voxel-size = 2.5×2.5×2.5 mm3, FOV = 240×240×120 mm3, partial-Fourier = 6/8, iPAT = 2 (GRAPPA), and bandwidth = 1930 Hz/pix.
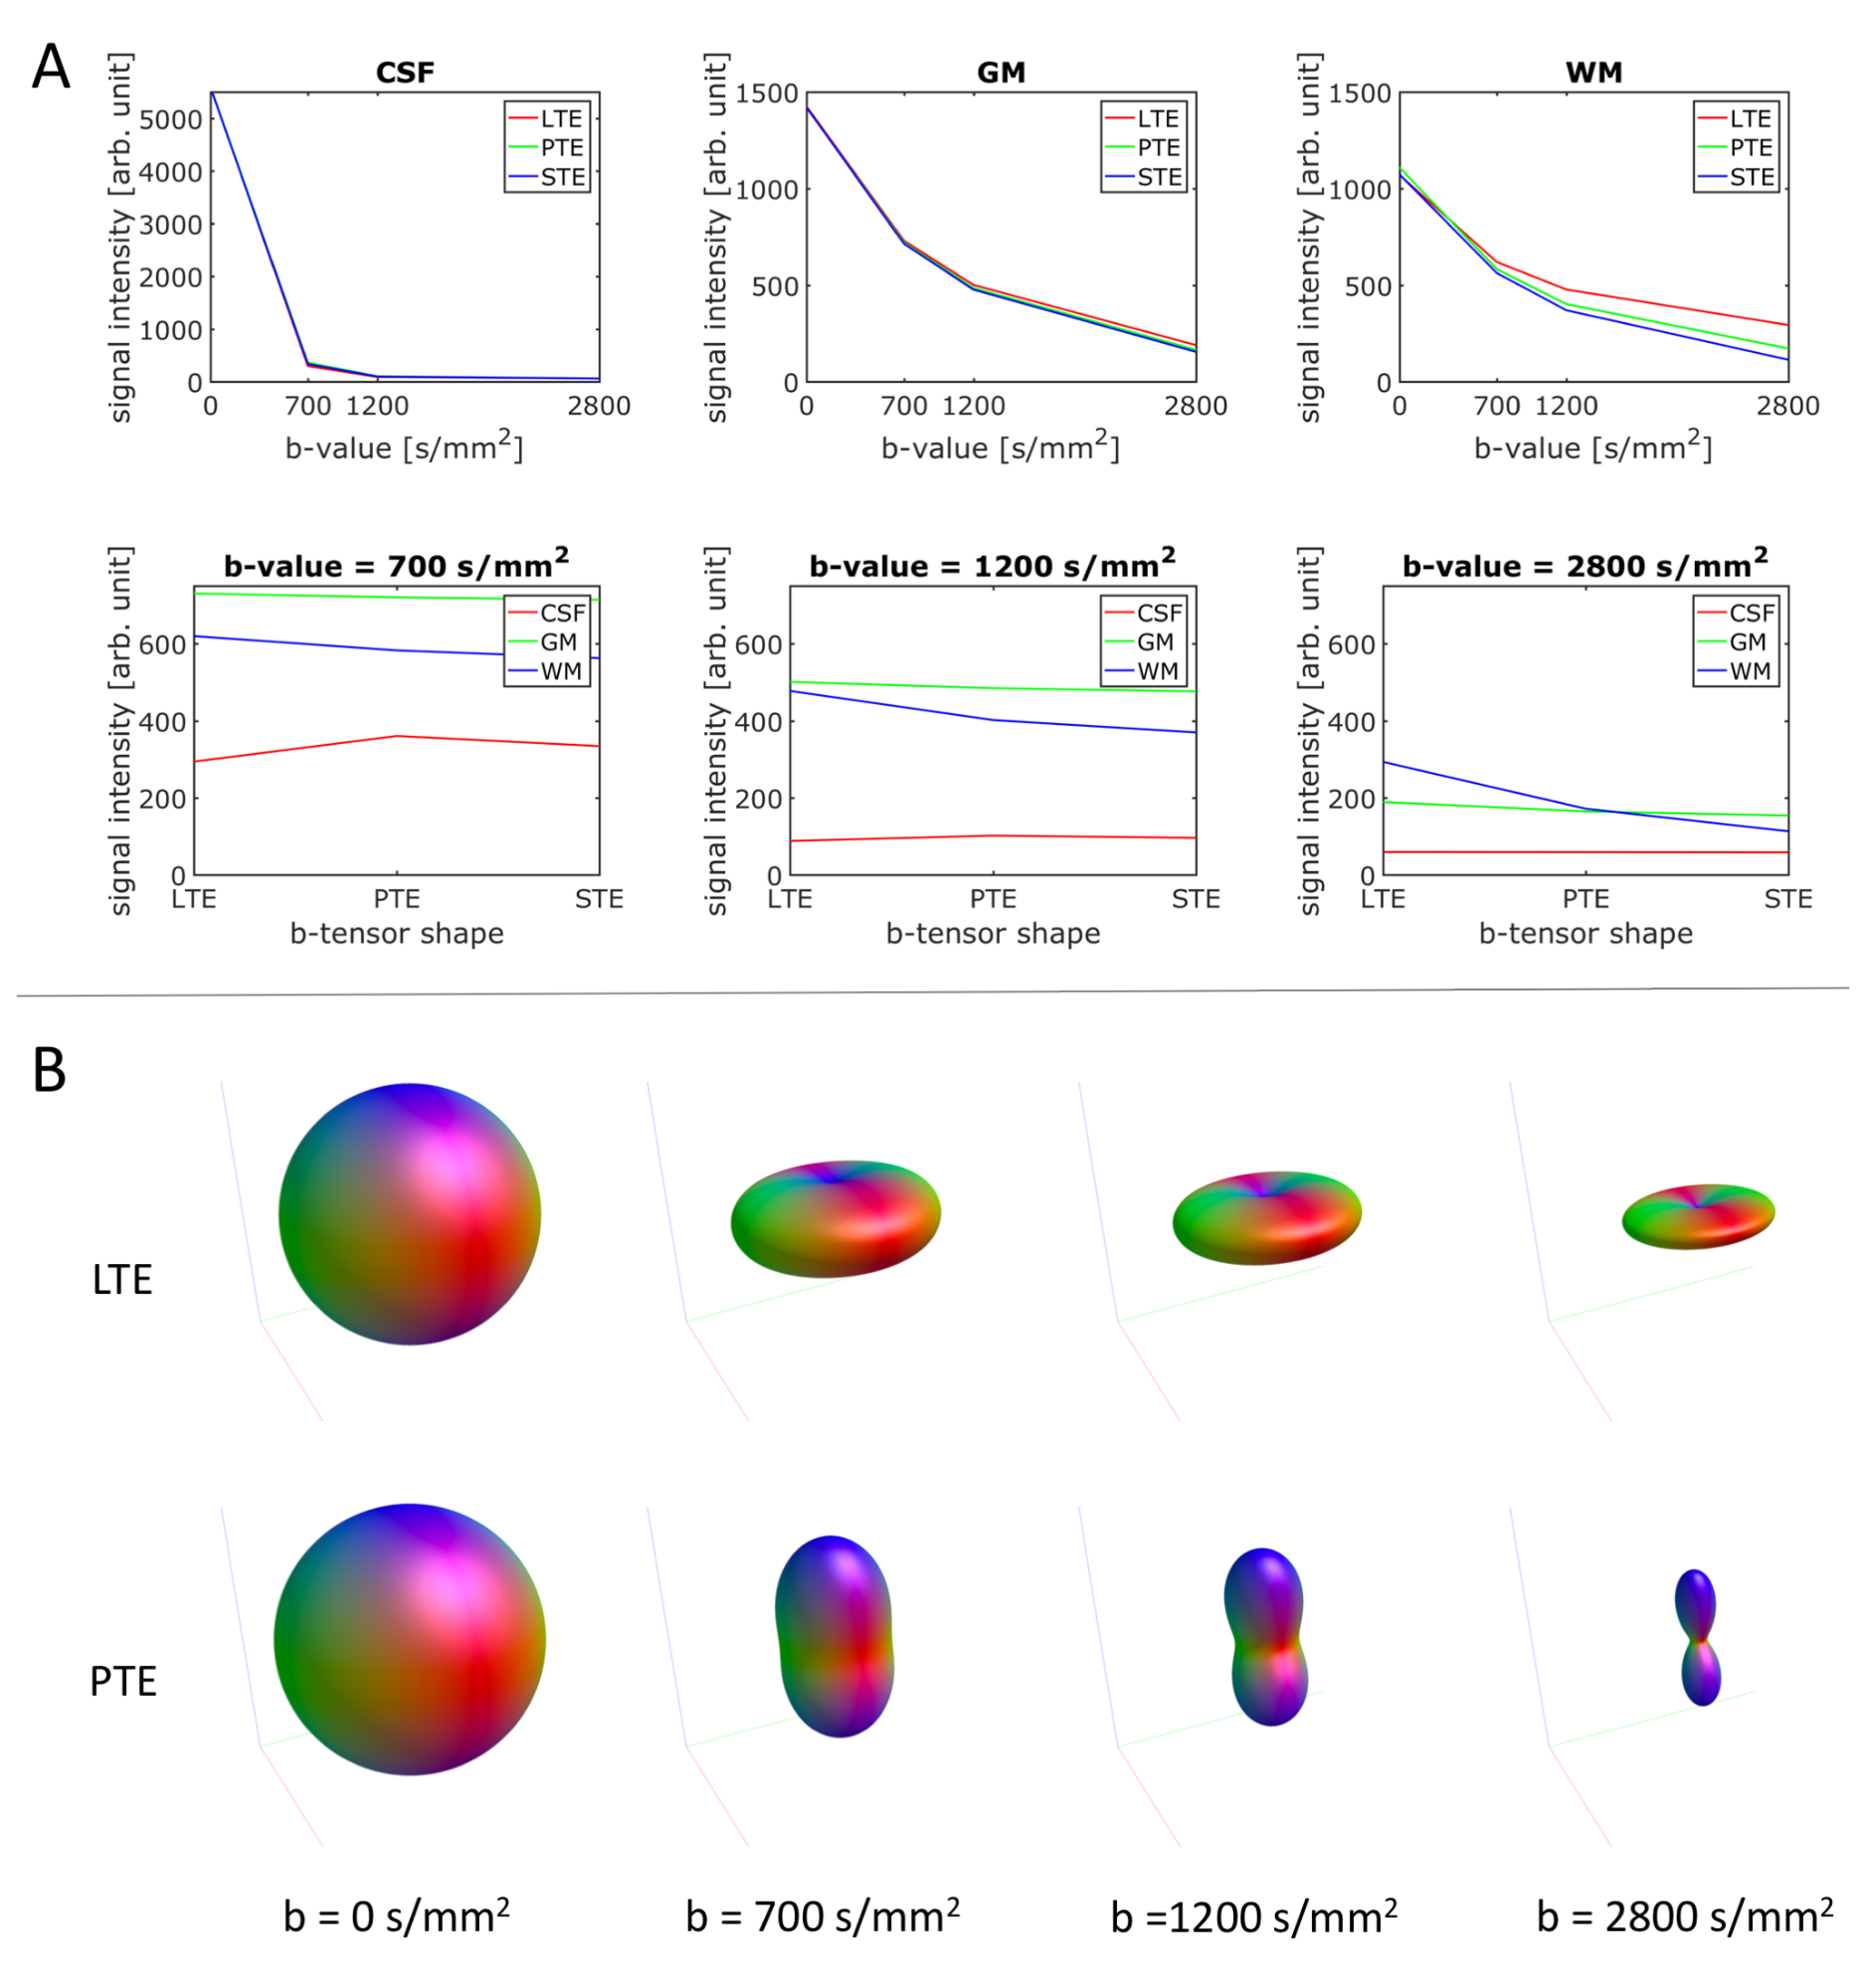
Spherical deconvolution: Using tissue-specific responses for each b-tensor shape and b-value (see Fig. 2), MT-CSD was performed on subsets of the full data using various combinations of b-tensor shapes and b-values (see Figs. 3,4). The formalism of MT-CSD naturally extended to data acquired with (multiple) b-tensor shapes by replacing the forward convolution matrix that translates the tissue ODFs into measured data with the b-tensor-shape specific convolution matrices.
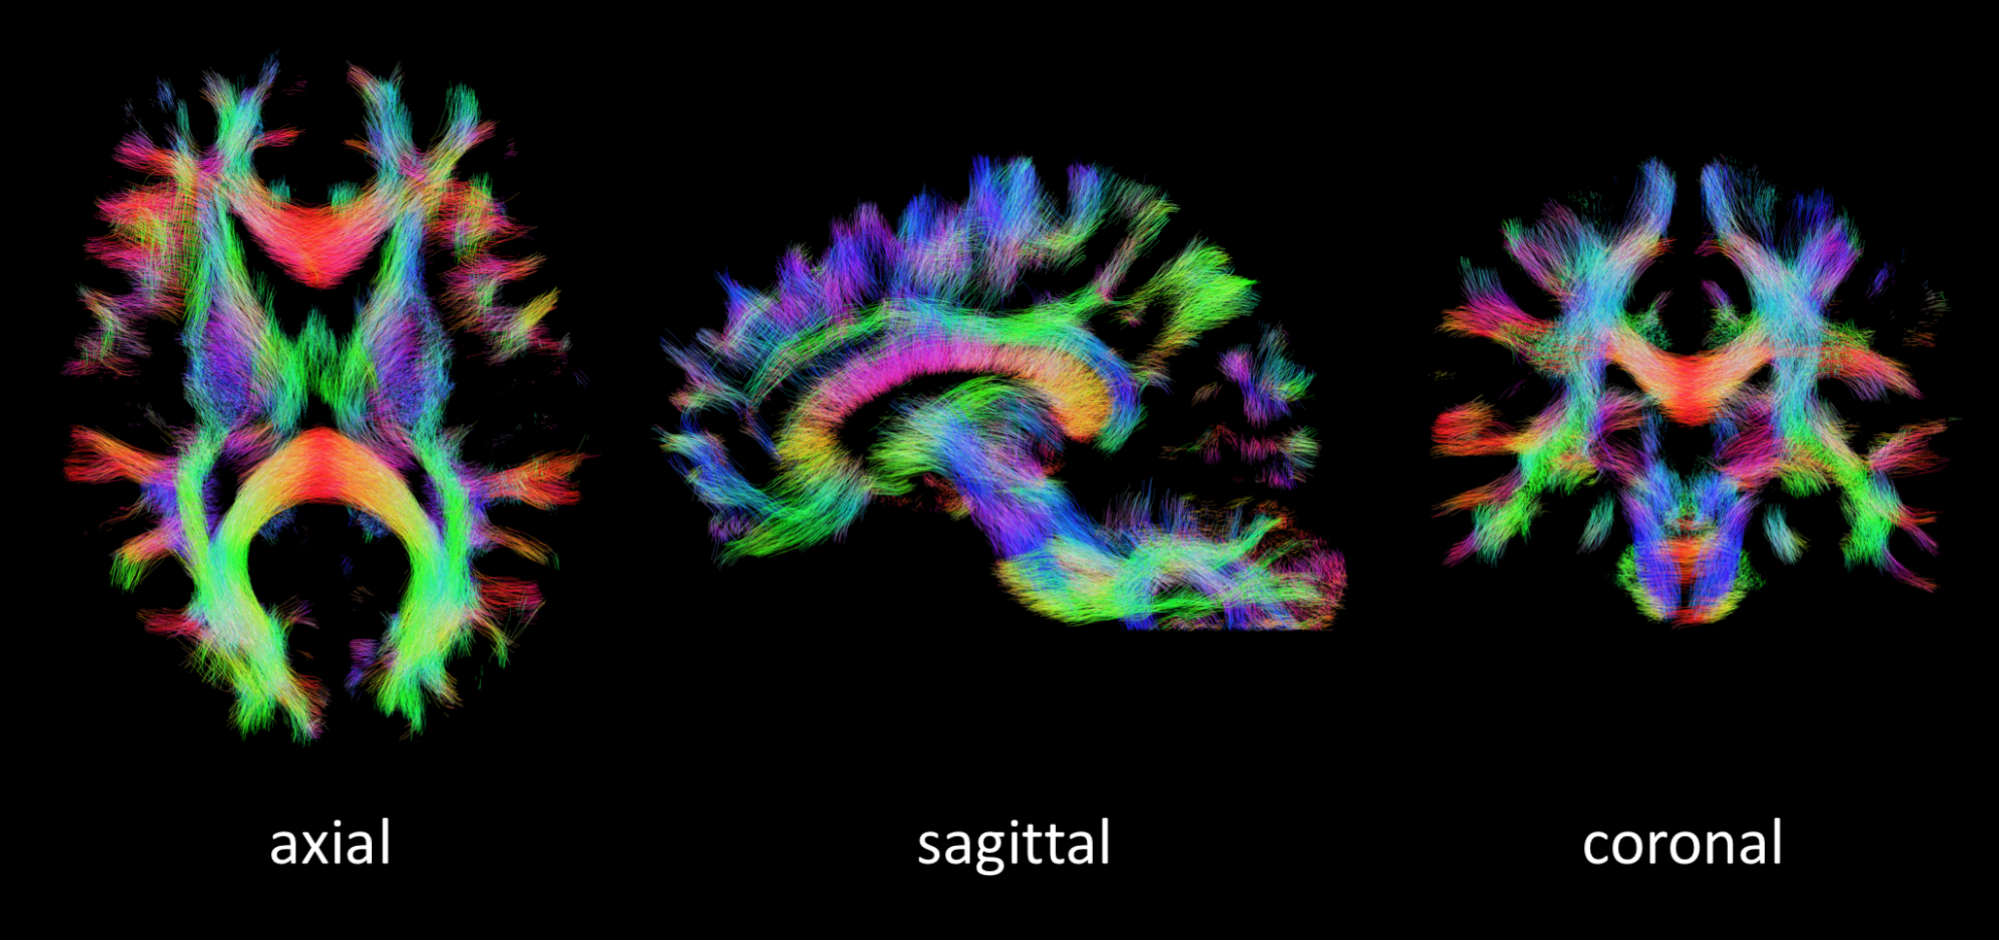
Fiber-tracking: Whole brain probabilistic fiber tracking was performed on the WM fODFs using MRtrix11 (see Fig. 5).
Results and discussion
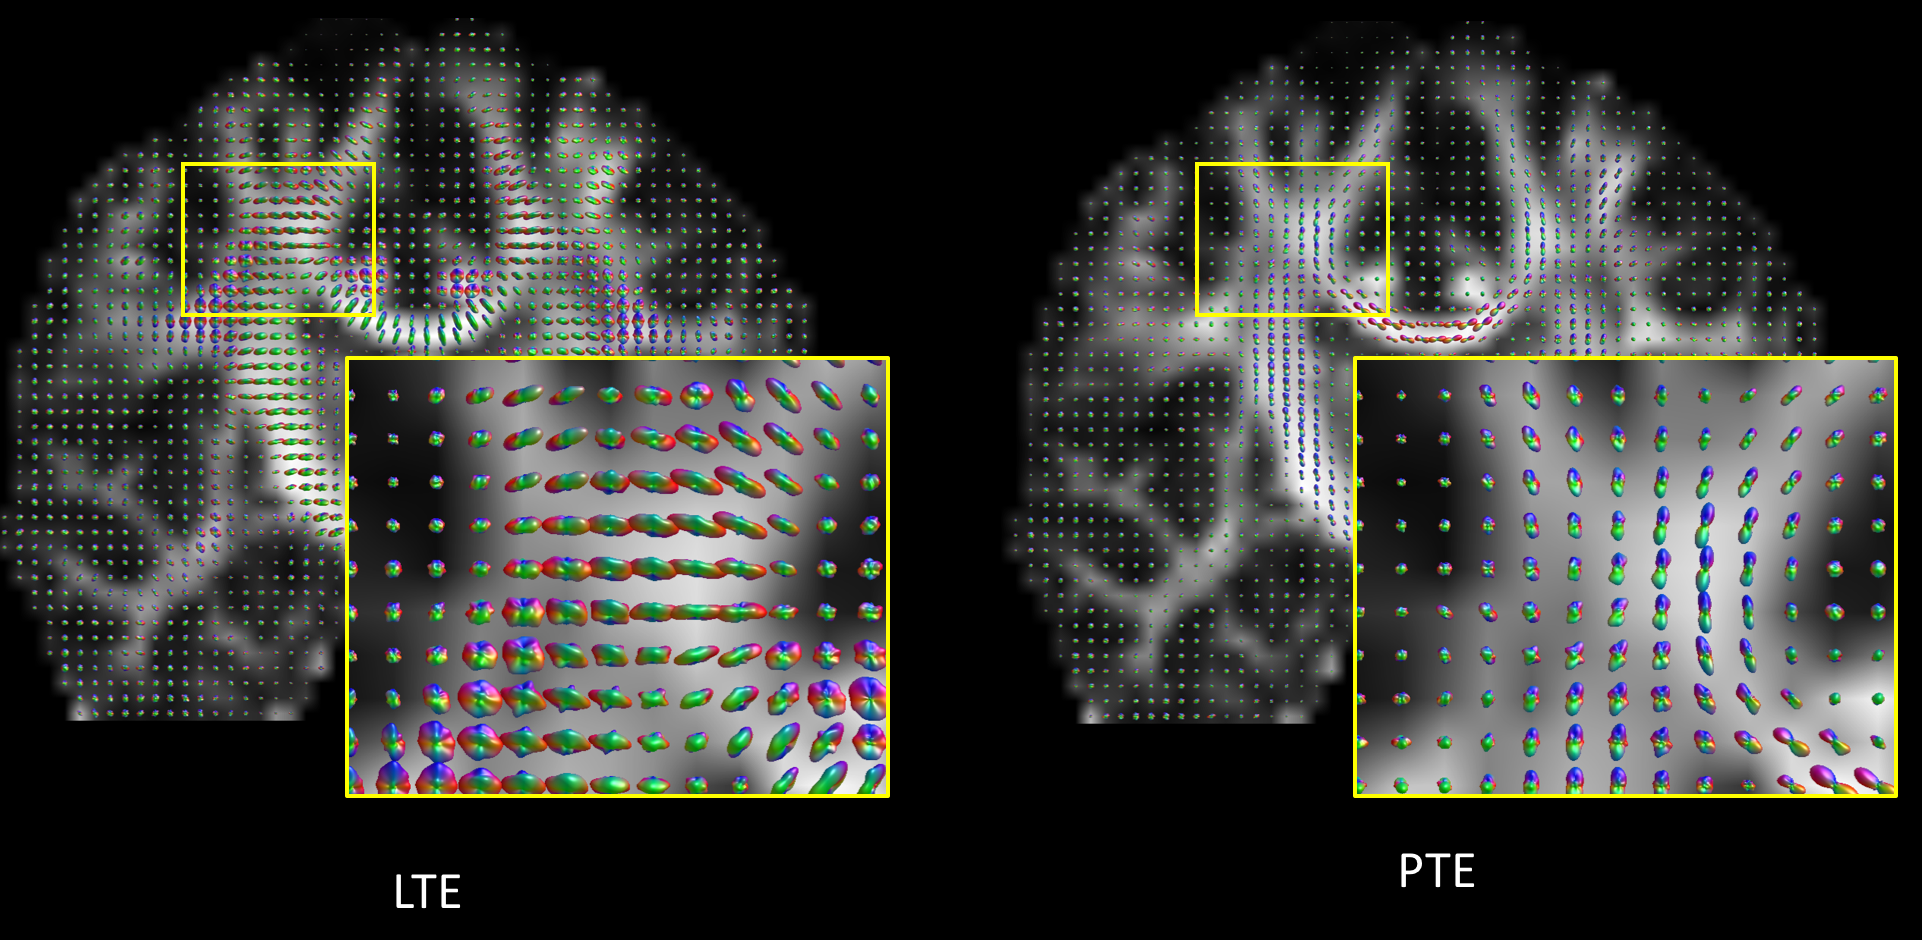
Contrary to the LTE data, the ‘raw’ PTE data provides a ‘natural contrast’ for fiber orientation estimation as observed earlier by Wedeen et al.12,13 (Fig. 1).
The isotropic responses contain the contrast necessary to resolve the different tissue types (Fig. 2A) whereas the anisotropic WM responses contain the angular contrast necessary to resolve (crossing) fiber orientations (Fig. 2B).
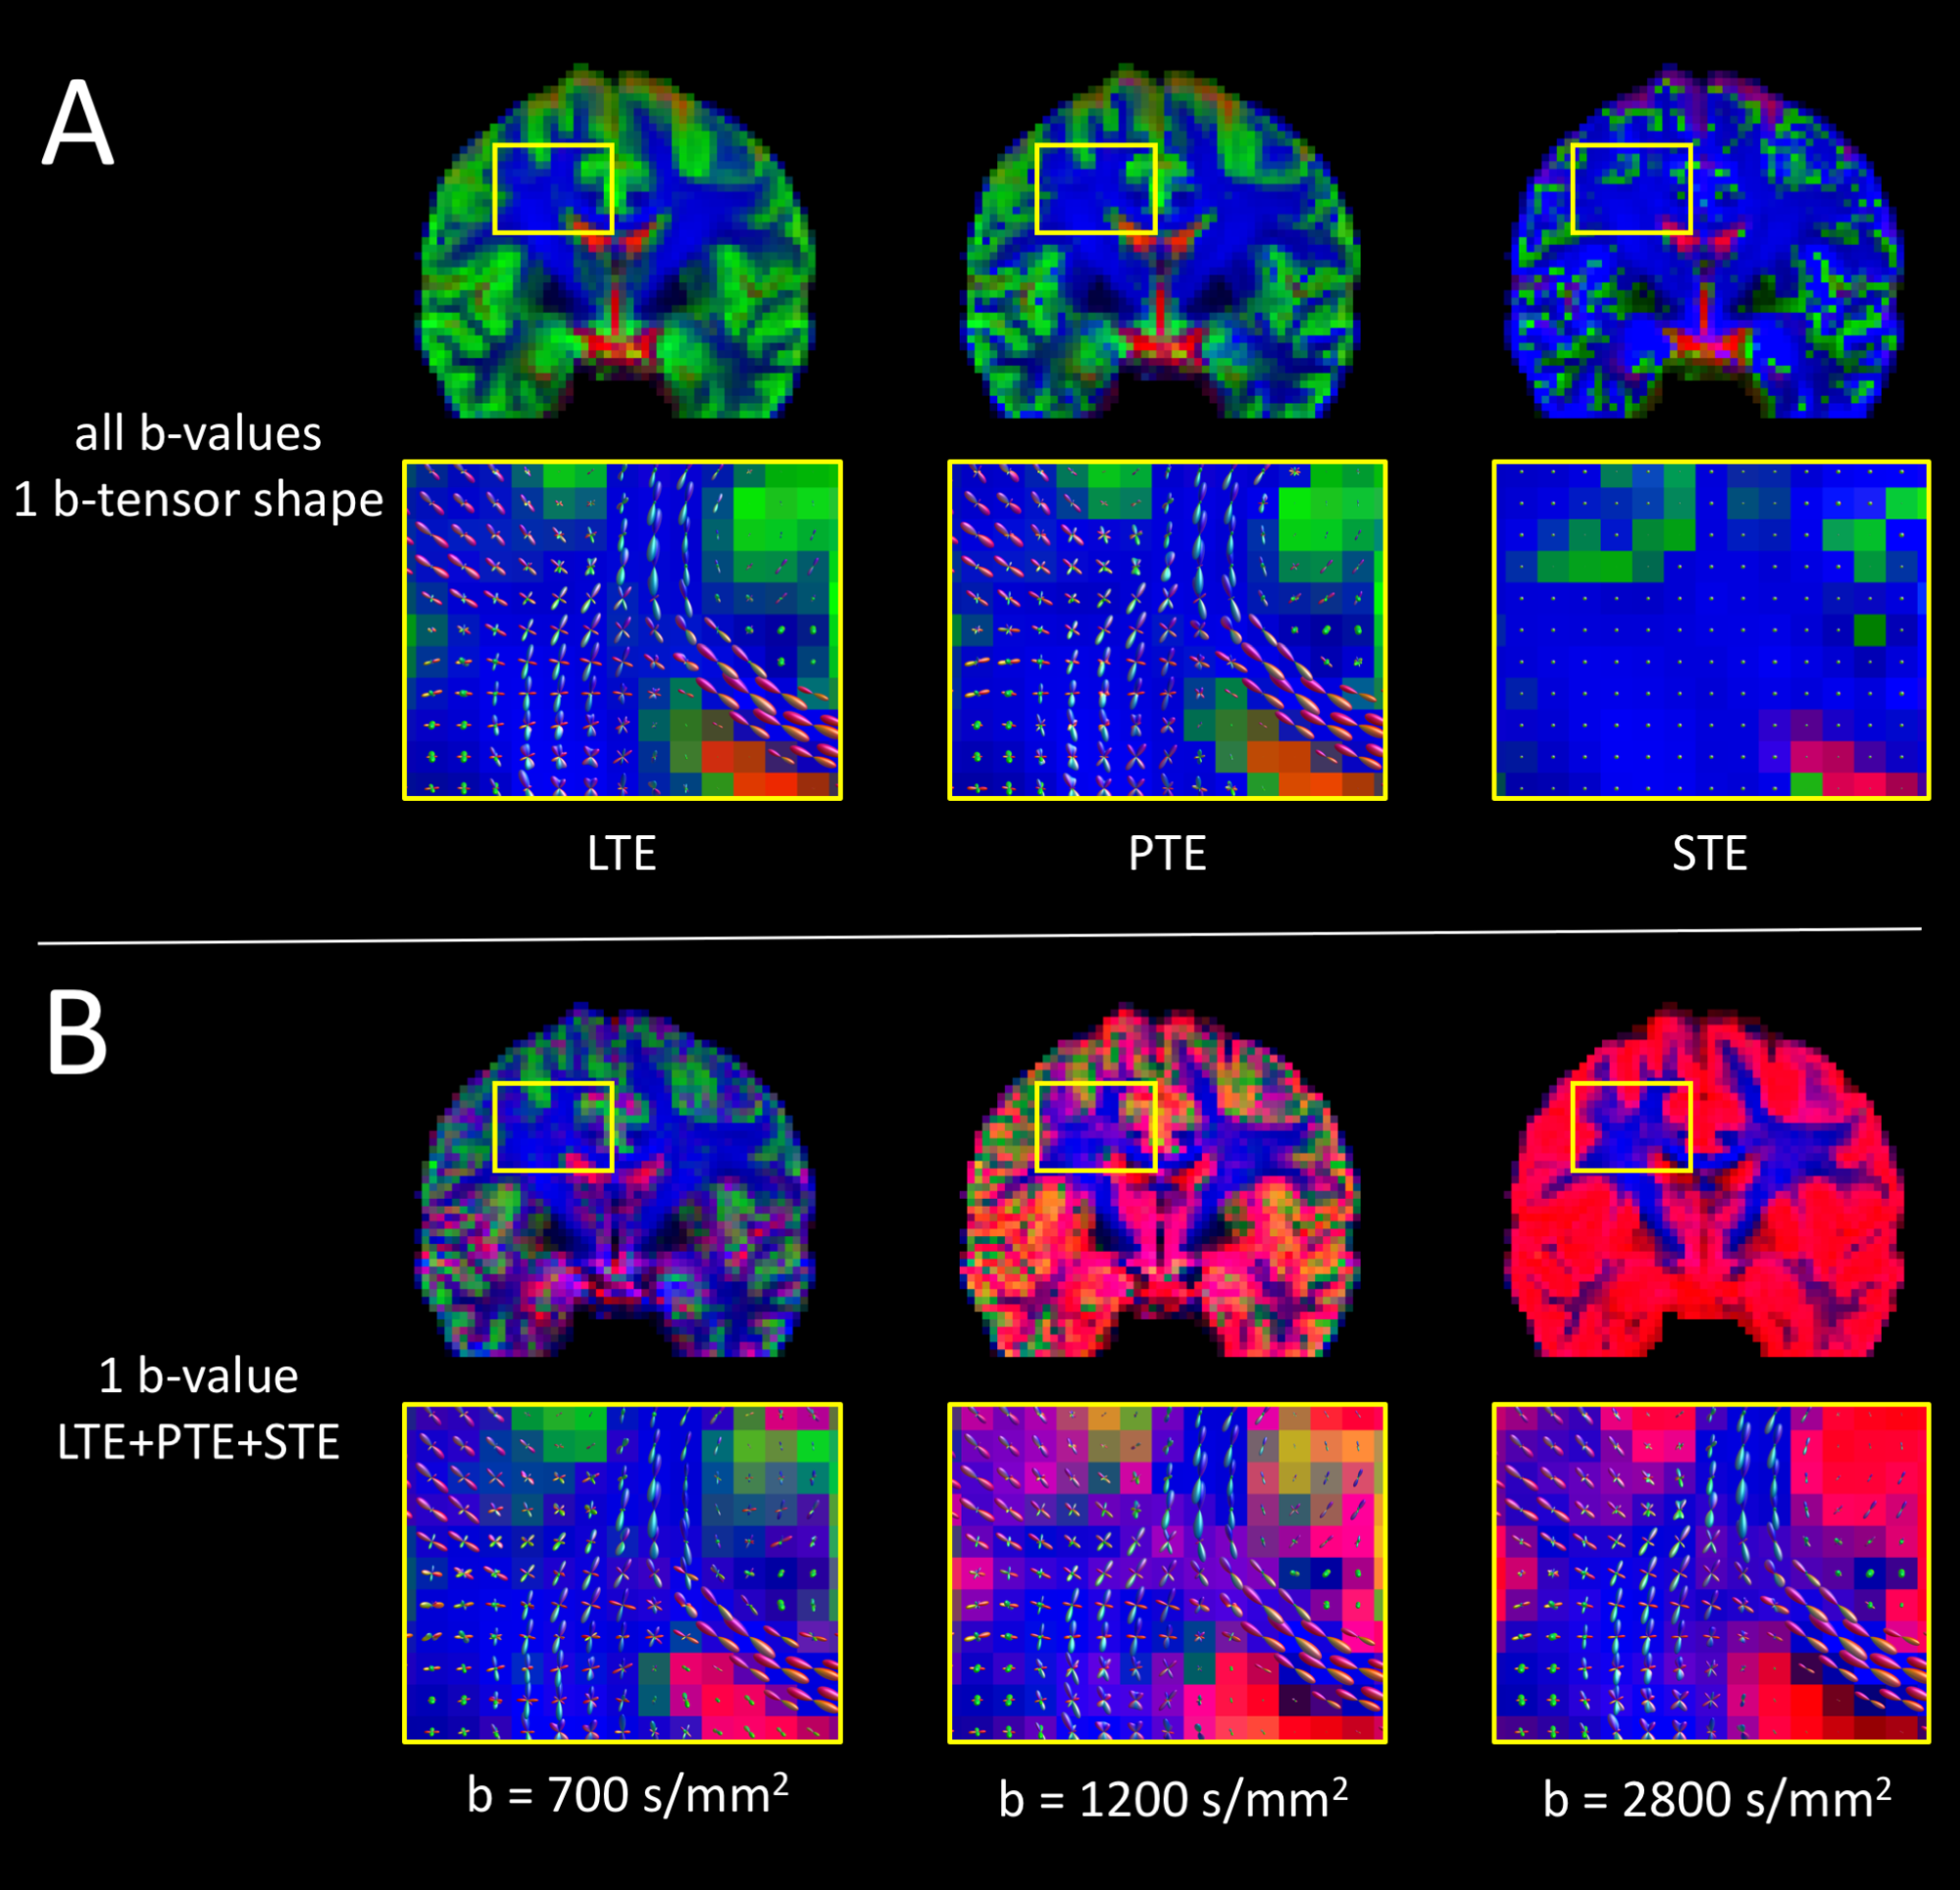
Tissue volume fraction maps and WM fODFs obtained with PTE are qualitatively similar to those obtained with LTE (Fig. 3A). Compared to fODFs from LTE, those from PTE exhibit a slight reduction in local coherence in crossing fibers. STE could naturally not resolve fiber orientations, but was able to distinguish CSF. However, it was poor at discriminating WM from GM, suggesting that the GM/WM contrast observed with LTE and PTE partly derives from anisotropy, and not from the tissue-specific b-value dependency alone. This is in agreement with Lampinen et al, which showed that isotropic diffusivity is rather uniform across WM/GM and what varies greatly is the micro-anisotropy6.
When using only a single b-value, but different b-tensor shapes, MT-CSD can separate isotropic (CSF/GM) from anisotropic tissue (WM), resulting in good quality fODFs, even at tissue interfaces (Fig. 3B). However, using a single b-value, MT-CSD could not satisfactory separate CSF from GM tissue, suggesting that multiple b-tensor shapes alone do not provide the contrast necessary for MT-CSD.
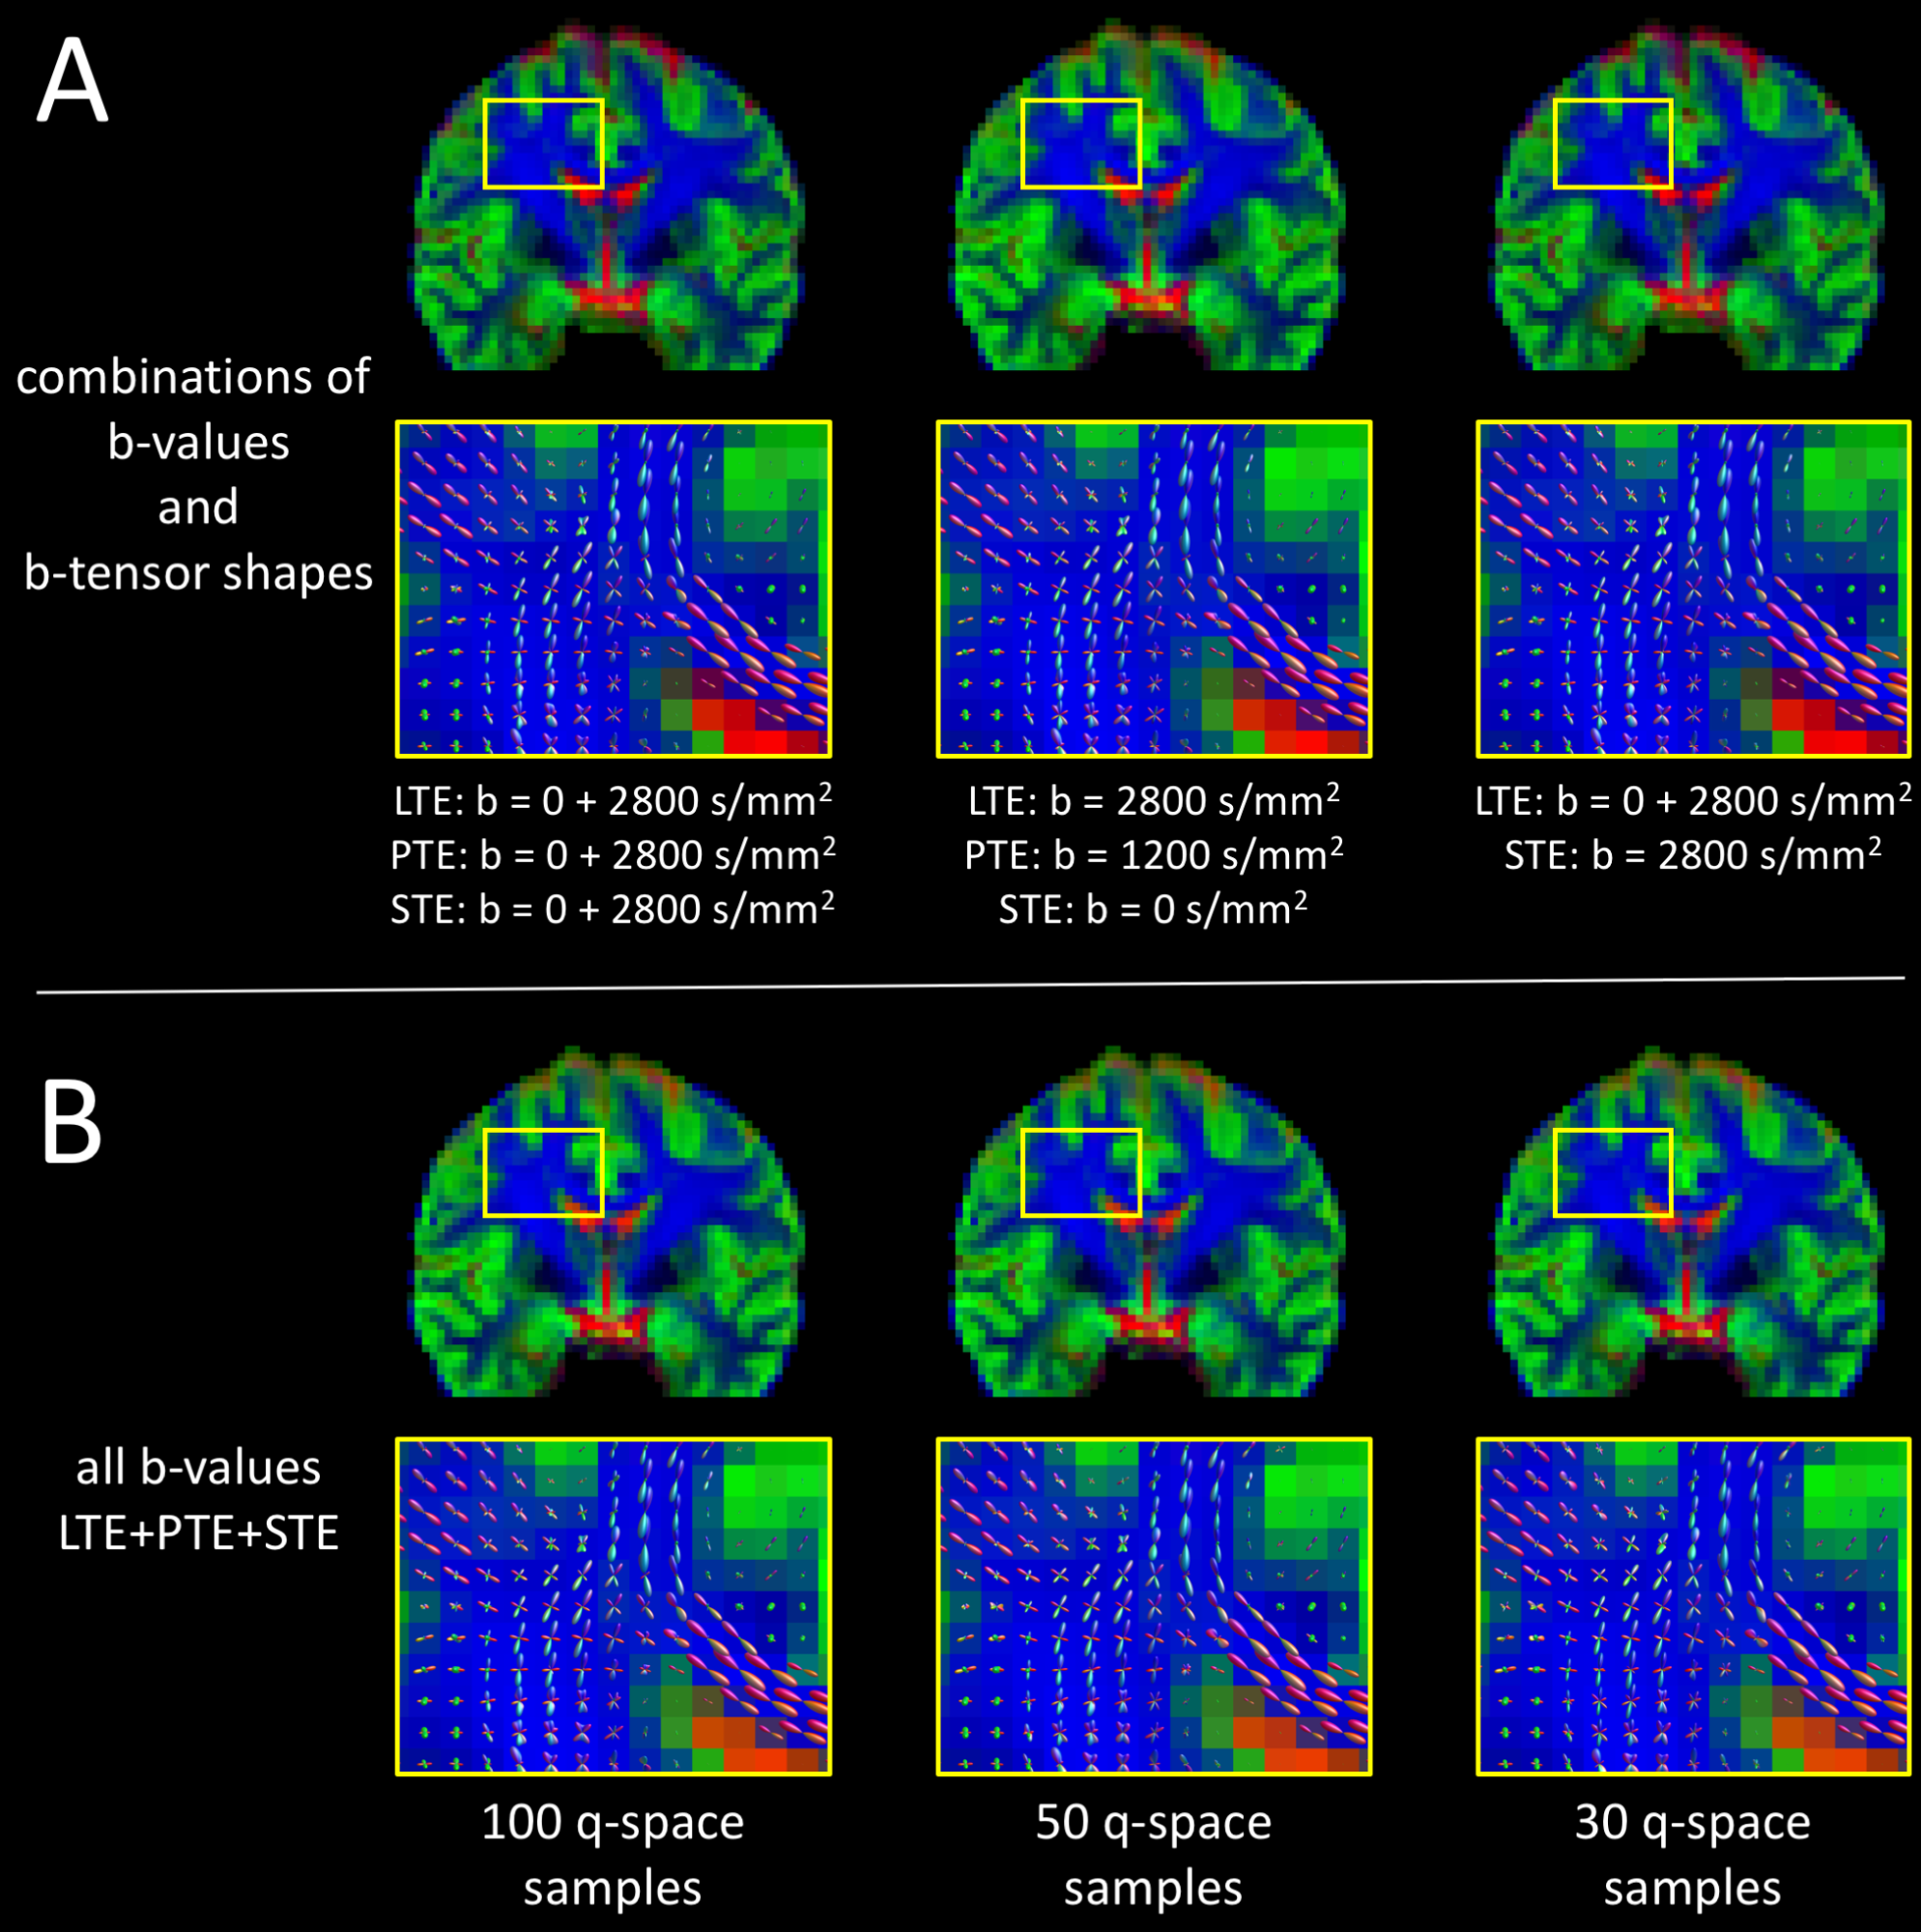
MT-CSD using only two b-values is feasible given at least one other b-tensor shape, suggesting that additional b-tensor shapes can be an alternative to additional b-values to drive the MT-CSD contrast between tissue types (Fig. 4A).
Subsampling the full LTE+PTE+STE data set from from 100 samples per b-tensor shape (Fig. 4B, first column) to 50 (second column) and 30 (third column), had a negligible effect on both the tissue volume fraction maps and the WM fODFs.
Fig. 5 demonstrates high quality whole brain fiber tracking on the most heavily subsampled LTE+STE+STE data set.
Conclusion
We have extended the MT-CSD approach to account for data acquired with nonlinear and multiple b-tensor shapes, expanding the range of data sets to which the technique can be applied. In addition, we have shown that multiple b-tensor shapes can provide a new means of contrast between tissues in a MT-CSD experiment, in particular between GM and WM, whose main discriminant appears to be micro-anisotropy. Finally, we have demonstrated that MT-CSD on data encoded with multiple b-tensor shapes is feasible even with sparse sampling, bringing it into the clinical realm. The proposed approach enables high quality fiber tracking and will enable advanced fixel-based analyses14 on data acquired with multiple b-tensor shapes.Acknowledgements
We thank Siemens Healthcare for access to the pulse sequence programming environment. BJ is a postdoctoral fellow of the Research Foundation Flanders, Belgium (FWO: 12M3116N).References
1. Jeurissen, B., Tournier, J.-D., Dhollander, T., Connelly, A. & Sijbers, J. Multi-tissue constrained spherical deconvolution for improved analysis of multi-shell diffusion MRI data. Neuroimage 103, 411–426 (2014).
2. Wong, E. C., Cox, R. W. & Song, A. W. Optimized isotropic diffusion weighting. Magn. Reson. Med. 34, 139–143 (1995).
3. Westin, C.-F. et al. Q-space trajectory imaging for multidimensional diffusion MRI of the human brain. Neuroimage 135, 345–362 (2016).
4. Shemesh, N. et al. Conventions and nomenclature for double diffusion encoding NMR and MRI. Magn. Reson. Med. 75, 82–87 (2016).
5. Szczepankiewicz, F. et al. The link between diffusion MRI and tumor heterogeneity: Mapping cell eccentricity and density by diffusional variance decomposition (DIVIDE). Neuroimage 142, 522–532 (2016).
6. Lampinen, B. et al. Neurite density imaging versus imaging of microscopic anisotropy in diffusion MRI: A model comparison using spherical tensor encoding. Neuroimage 147, 517–531 (2017).
7. Topgaard, D. Multidimensional diffusion MRI. J. Magn. Reson. 275, 98–113 (2017).
8. Szczepankiewicz, F. & Nilsson, M. Maxwell-compensated waveform design for asymmetric diffusion encoding. submitted to Proc. Intl. Soc. Mag. Reson. Med. 26 (2018).
9. Sjölund, J. et al. Constrained optimization of gradient waveforms for generalized diffusion encoding. J. Magn. Reson. 261, 157–168 (2015).
10. Lundell, H. et al. Microscopic anisotropy with spectrally modulated q-space trajectory encoding. in Proc. Intl. Soc. Mag. Reson. Med. 1086 (2017).
11. Tournier, J.-D., Calamante, F. & Connelly, A. MRtrix: Diffusion tractography in crossing fiber regions. Int. J. Imaging Syst. Technol. 22, 53–66 (2012).
12. Wedeen, V. J., Dai, G., Tseng, W.-I., Wang, R. & Benner, T. Diffusion encoding with 2D gradient trajectories yields natural contrast for 3D fiber orientation. in Proc. Intl. Soc. Mag. Reson. Med. 14, 851 (2006).
13. Wedeen, V. J. et al. The geometric structure of the brain fiber pathways. Science 335, 1628–1634 (2012).
14. Raffelt, D. A. et al. Connectivity-based fixel enhancement: Whole-brain statistical analysis of diffusion MRI measures in the presence of crossing fibres. Neuroimage 117, 40–55 (2015).
Figures