1558
Investigating the streamline count required for reproducible structural connectome construction across a range of brain parcellation resolutions1The Florey Institute of Neuroscience and Mental Health, Melbourne, Australia, 2The Florey Department of Neuroscience and Mental Health, University of Melbourne, Melbourne, Australia
Synopsis
This study systematically investigates a fundamental question for tractogram-based connectomics research: for a given resolution of brain parcellation, how many streamlines are required for reproducible connectome construction? We incorporate state-of-the-art tractography techniques with surface parcellation schemes of multiple granularities to investigate the influence of streamline count on the connectome variability. Our results suggest that selecting an appropriate number of streamlines is crucial for global and per-edge variability of the connectome, revealing important implications for subsequent network analysis and inferences. Methods that investigate structural connectivity with different brain parcellation resolutions should benefit from the experimental workflow and outcomes of this study.
Purpose
Despite the
growing innovative techniques for brain parcellation1-3, the optimum
number of streamlines required for constructing a reliable/reproducible
structural connectome has not yet been determined. High-resolution parcellation
is typically achieved by subdividing the AAL atlas4 into finer
partitions by a popular algorithm5, which was originally proposed
for functional connectomics studies; the algorithm however does not respect the
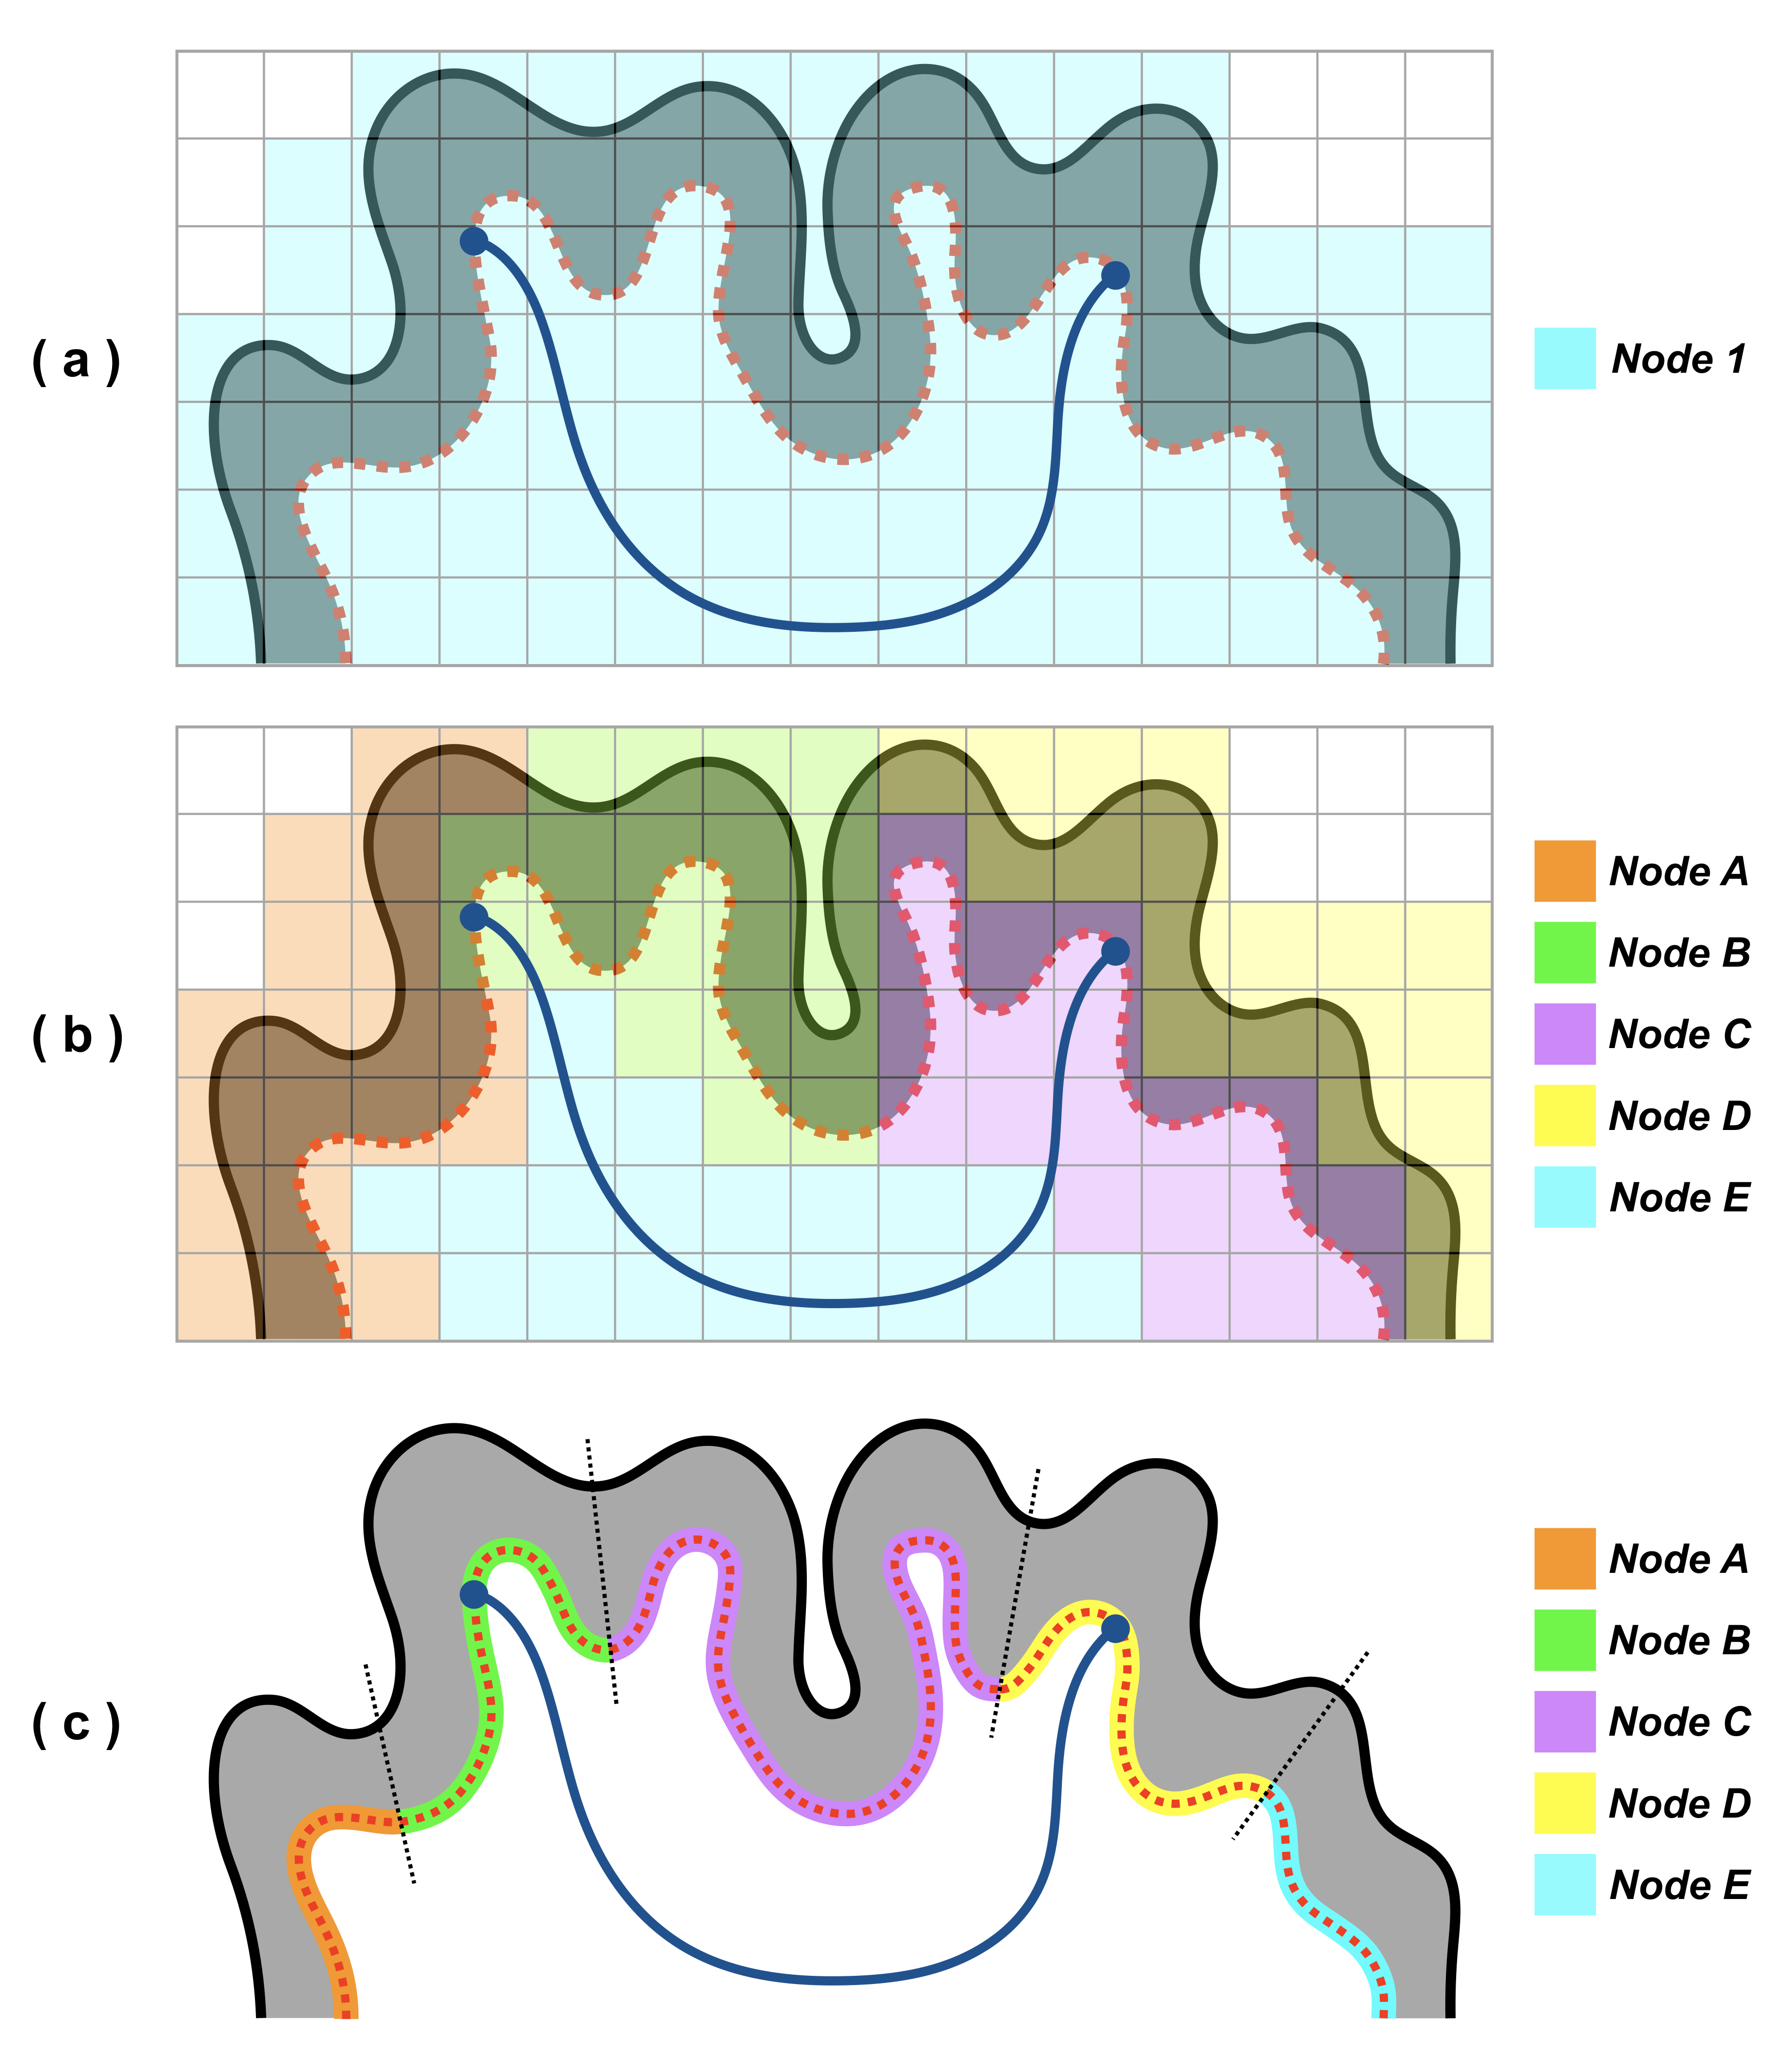
underlying anatomy. Therefore, when applying advanced tractography techniques6-8
informed by anatomical information, such a parcellation method may introduce bias
into connectome quantification and might not be appropriate for structural
connectivity research (see Figure 1). With this important consideration, this
study approaches the question from a perspective of a surface-based technique
by: (i) using mesh-based anatomically-constrained tractography (MACT7)
to effectively use every meaningful streamline generated for connectome
construction; (ii) using the Desikan-Killiany atlas9 to create multiple
granularities of parcellations on the same tissue surfaces used in MACT. Following
this framework, we investigate within-individual connectome variability derived
from various number of streamlines and parcellation resolutions, thereby providing
an empirical reference for guiding the selection of streamline count for connectomics
research using modern surface parcellation schemes.
Methods
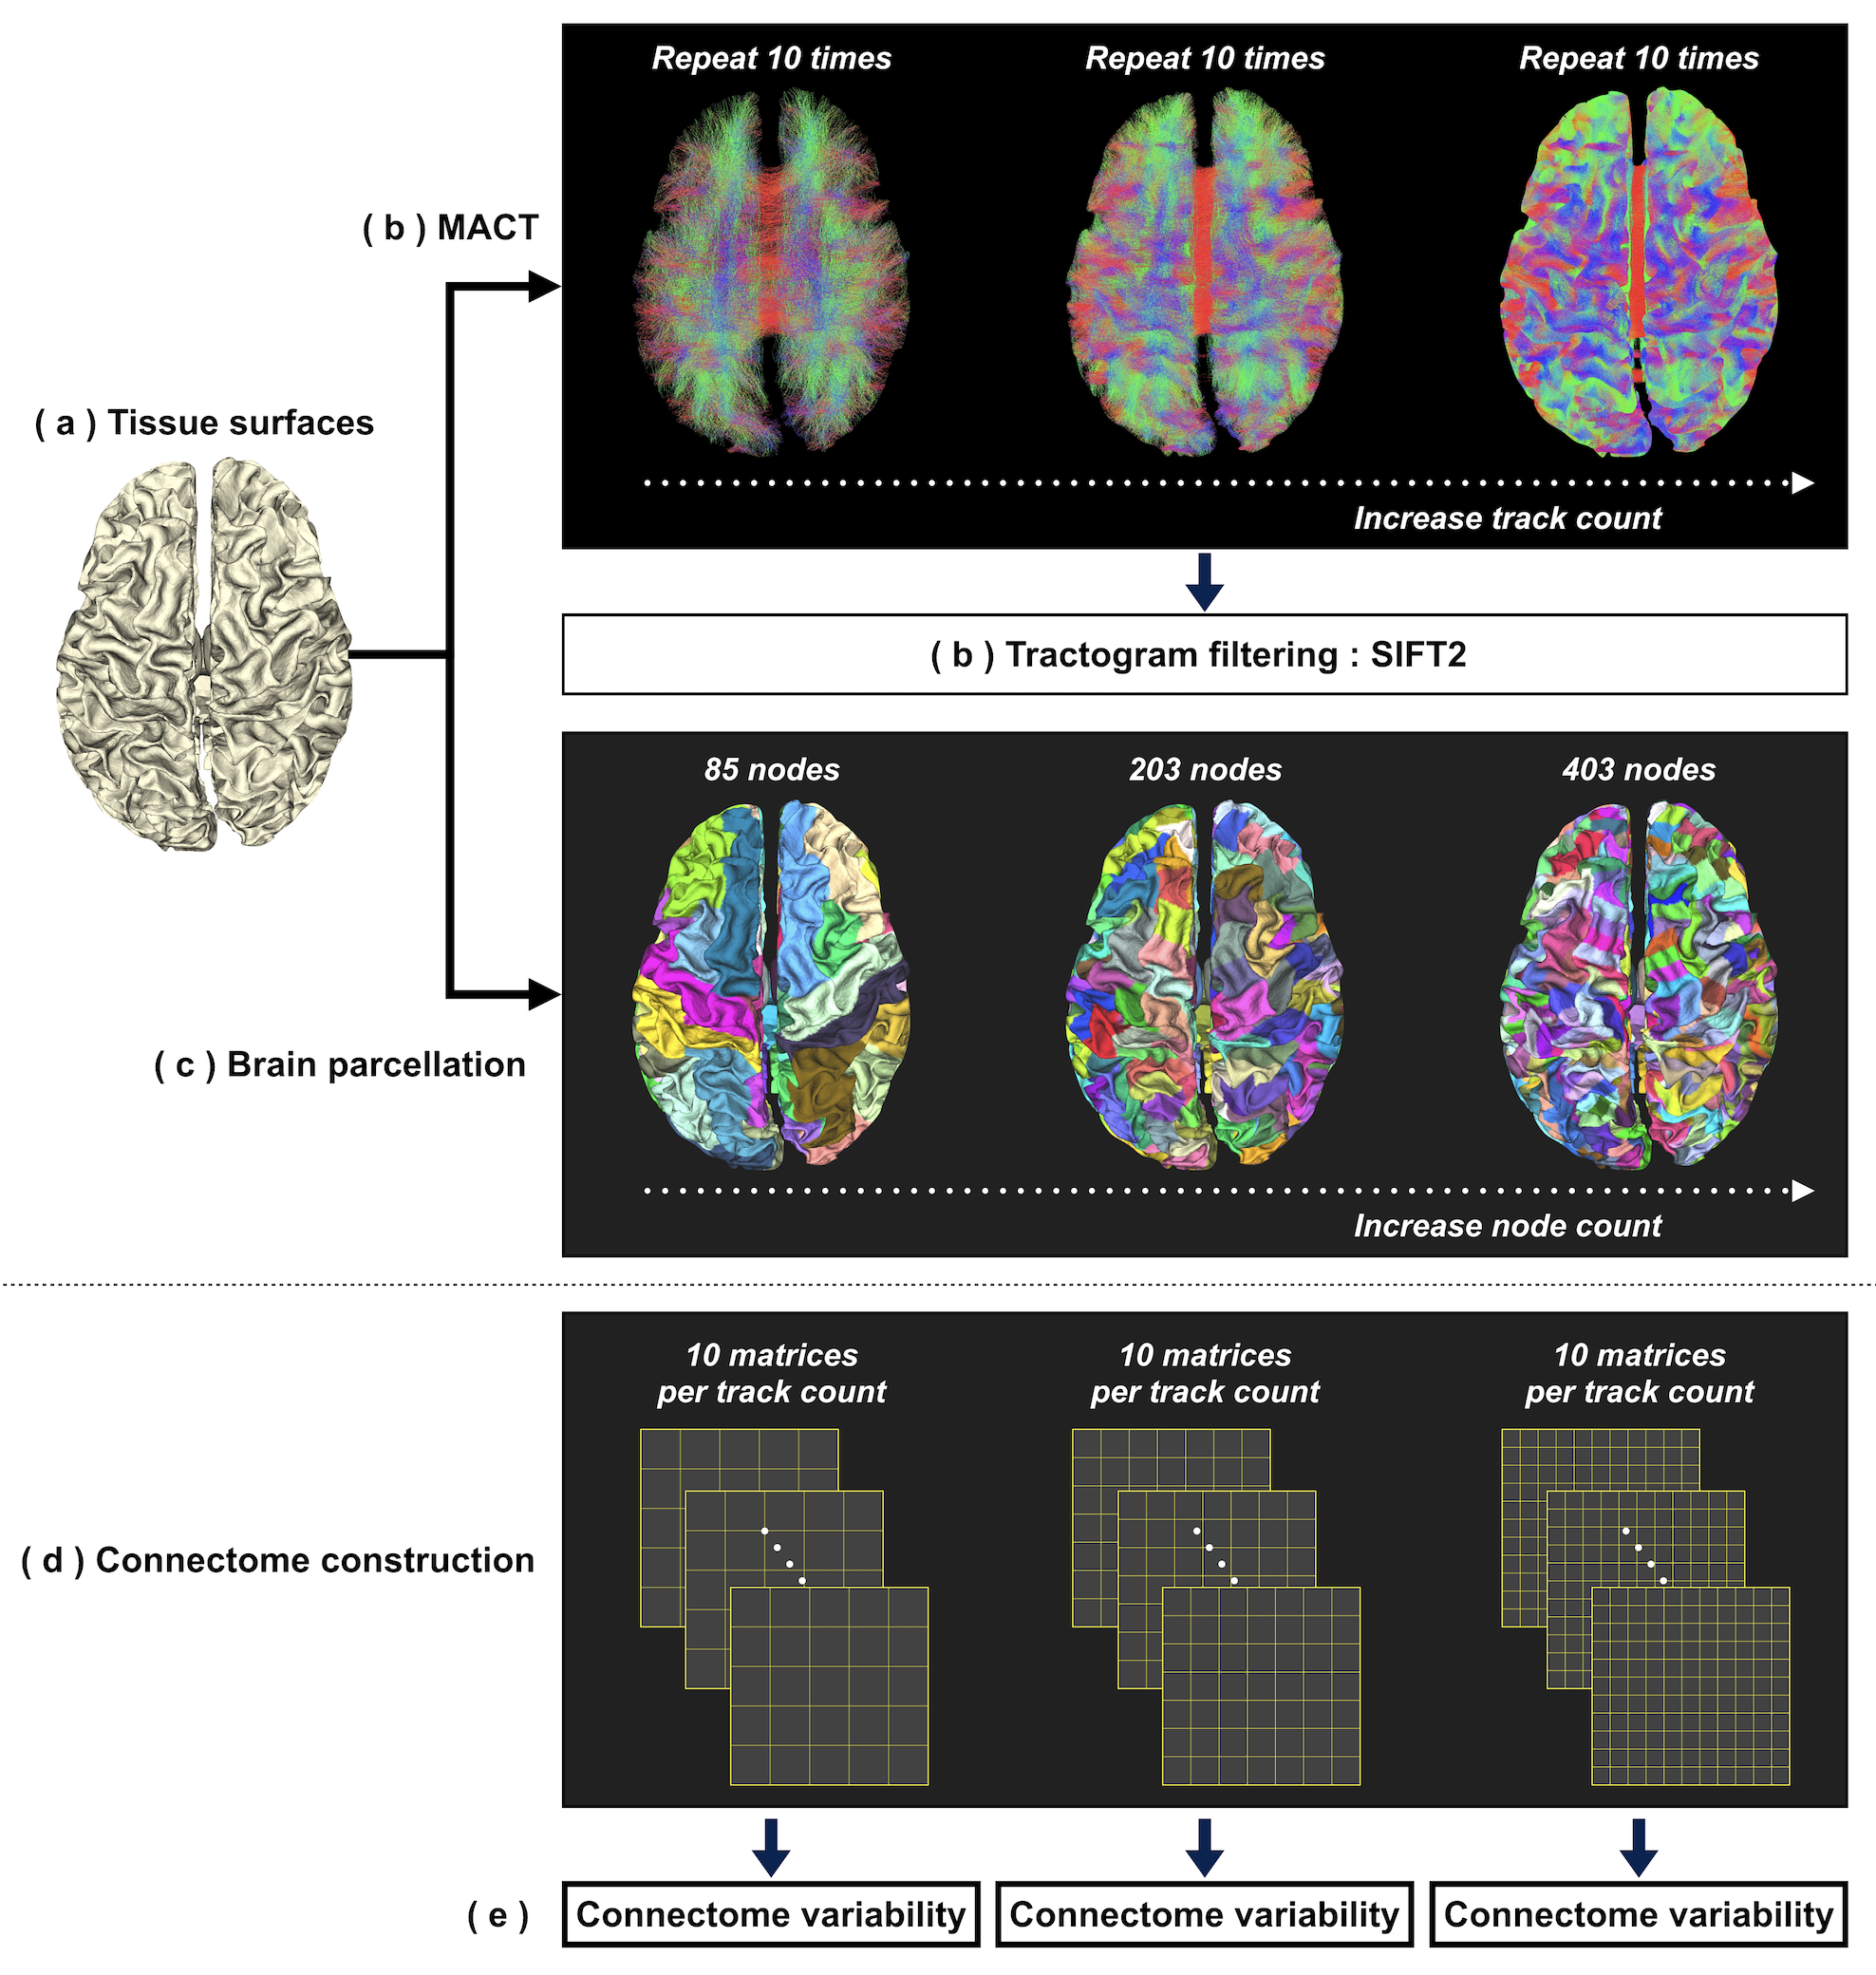
To conduct initial explorations, pre-processed T1 and DWI data of one randomly-selected subject were downloaded from ConnectomeDB10. Data processing procedures were as follows (see also Figure 2):
(a) Tissue surfaces: An in-house script was used to integrate surface representations of brain tissues7 reconstructed using FreeSurfer11 and FSL12.
(b) Tractogram reconstruction: Fibre orientation distributions were computed using multi-shell multi-tissue CSD13. MACT was used to generate tractograms of 0.01-5 million streamlines through the iFOD214 algorithm with dynamic seeding15. Tractography was repeated 10 times for each track count. Each tractogram was post-processed using SIFT215 for quantitative tractogram reconstructions.
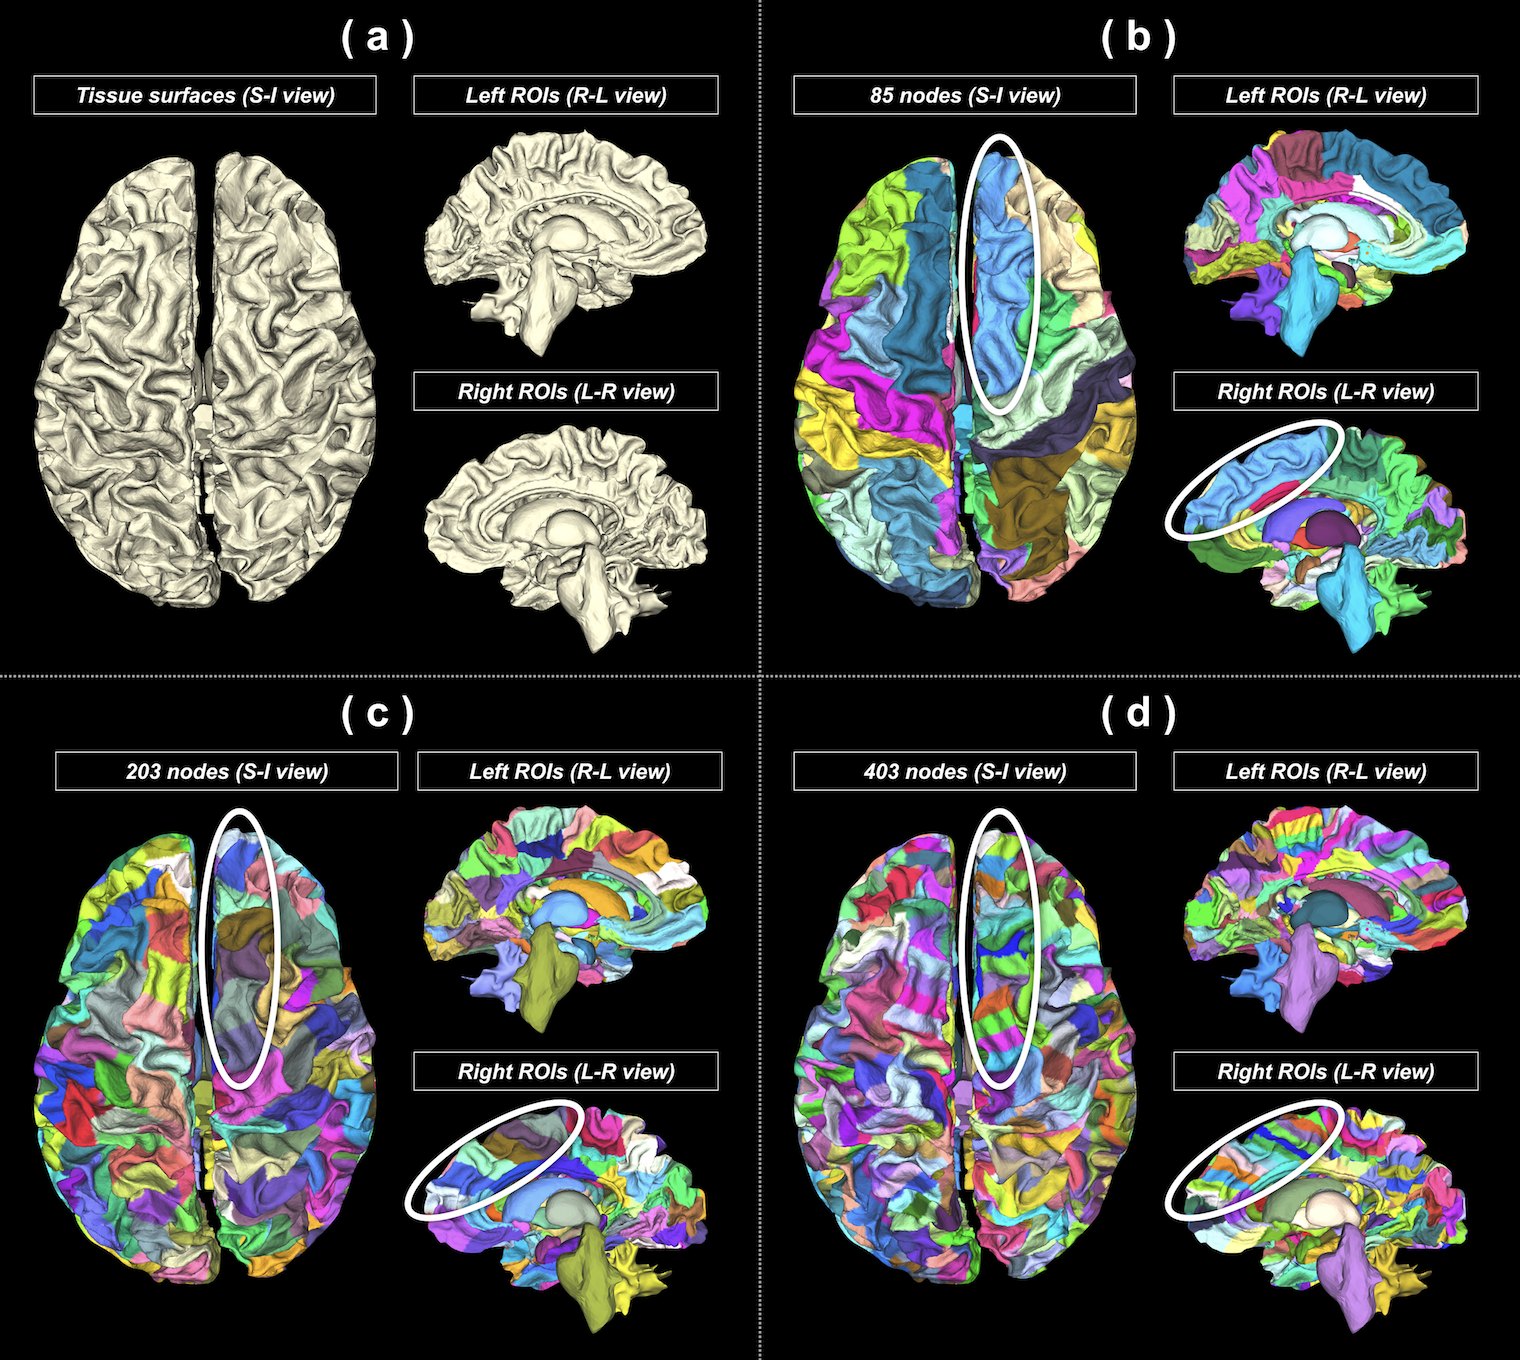
(c) Brain parcellation: To enable the generation of multi-granularity parcellations, FreeSurfer11 was used to subdivide the Desikan-Killiany cortical atlas9 into finer surface partitions. An in-house script was used to process the vertex-wise labels for every tissue surface and produce 3 parcellation schemes consisting of 85/203/403 nodes (Figure 3).
(d) Connectome construction: Three hundred connectomes were generated from 10 track counts × 10 repetitions × 3 parcellation schemes. Connectome edge was calculated as the sum of track weighting factors15 scaled by the proportionality coefficient15.
(e) Connectome variability: Per-edge coefficient of variation (CoVe=𝜎e/𝜔e) was used to evaluate variability; 𝜔e and 𝜎e are the mean and standard deviation of edge intensities across 10 repetitions. To provide a summary connectome variability, we propose a probability-weighted CoV (CoVP) calculated using:
$$CoV_P=\frac{\displaystyle\sum_{\forall{P_e>0}}CoV_e\cdot{P_e}}{\displaystyle\sum_{\forall{P_e>0}}P_e}$$
Compared to the weighted mean CoV16, the contribution of CoVe is weighted by the relevant frequency of occurrence (i.e. probability, Pe), instead of assuming the connection plausibility based on edge intensities 𝜔e.
Results
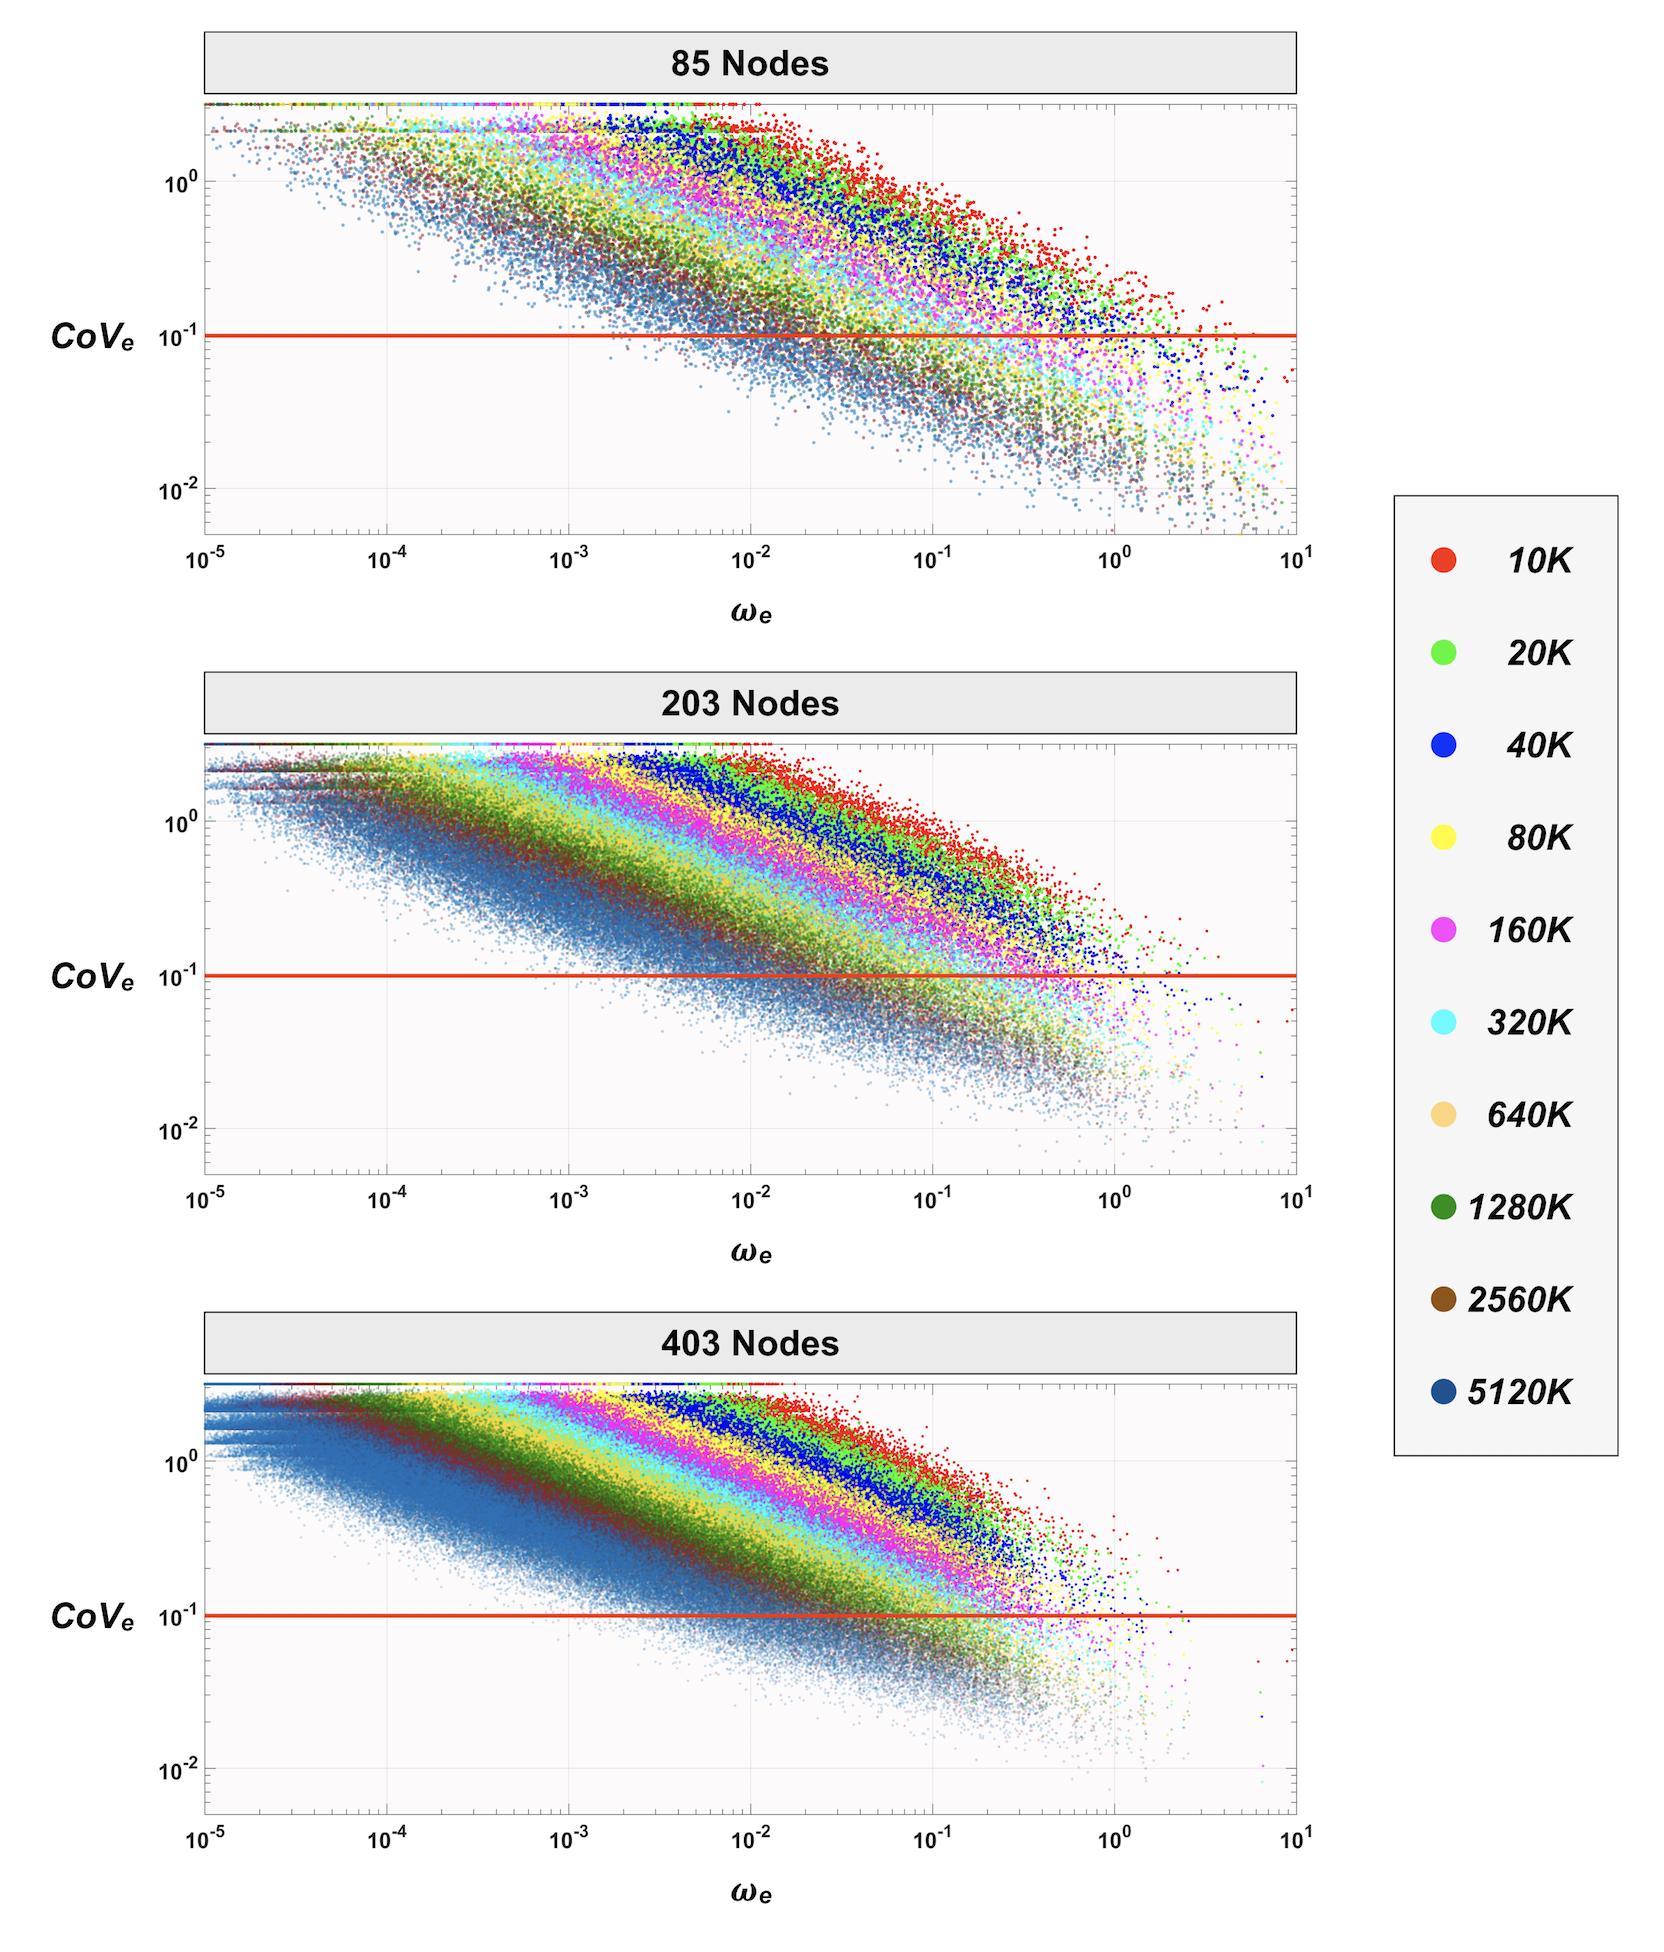
Figure 4 shows the distribution of the edge-wise CoVe as a function of 𝜔e. For any streamline count investigated, we observed an overall downward trend of CoVe towards the edges with larger 𝜔e. In addition, when a finer parcellation was used, edges were distributed more densely towards lower 𝜔e and higher CoVe. As expected, increasing streamline count improved the distribution of CoVe toward lower values; however, the results revealed that most of the edges (>50%) still had a CoVe greater than 0.1 even for the case of using the largest streamline count and the lowest node count; this implies that a much greater number of streamlines were required to reduce CoVe, particularly for edges with smaller 𝜔e.
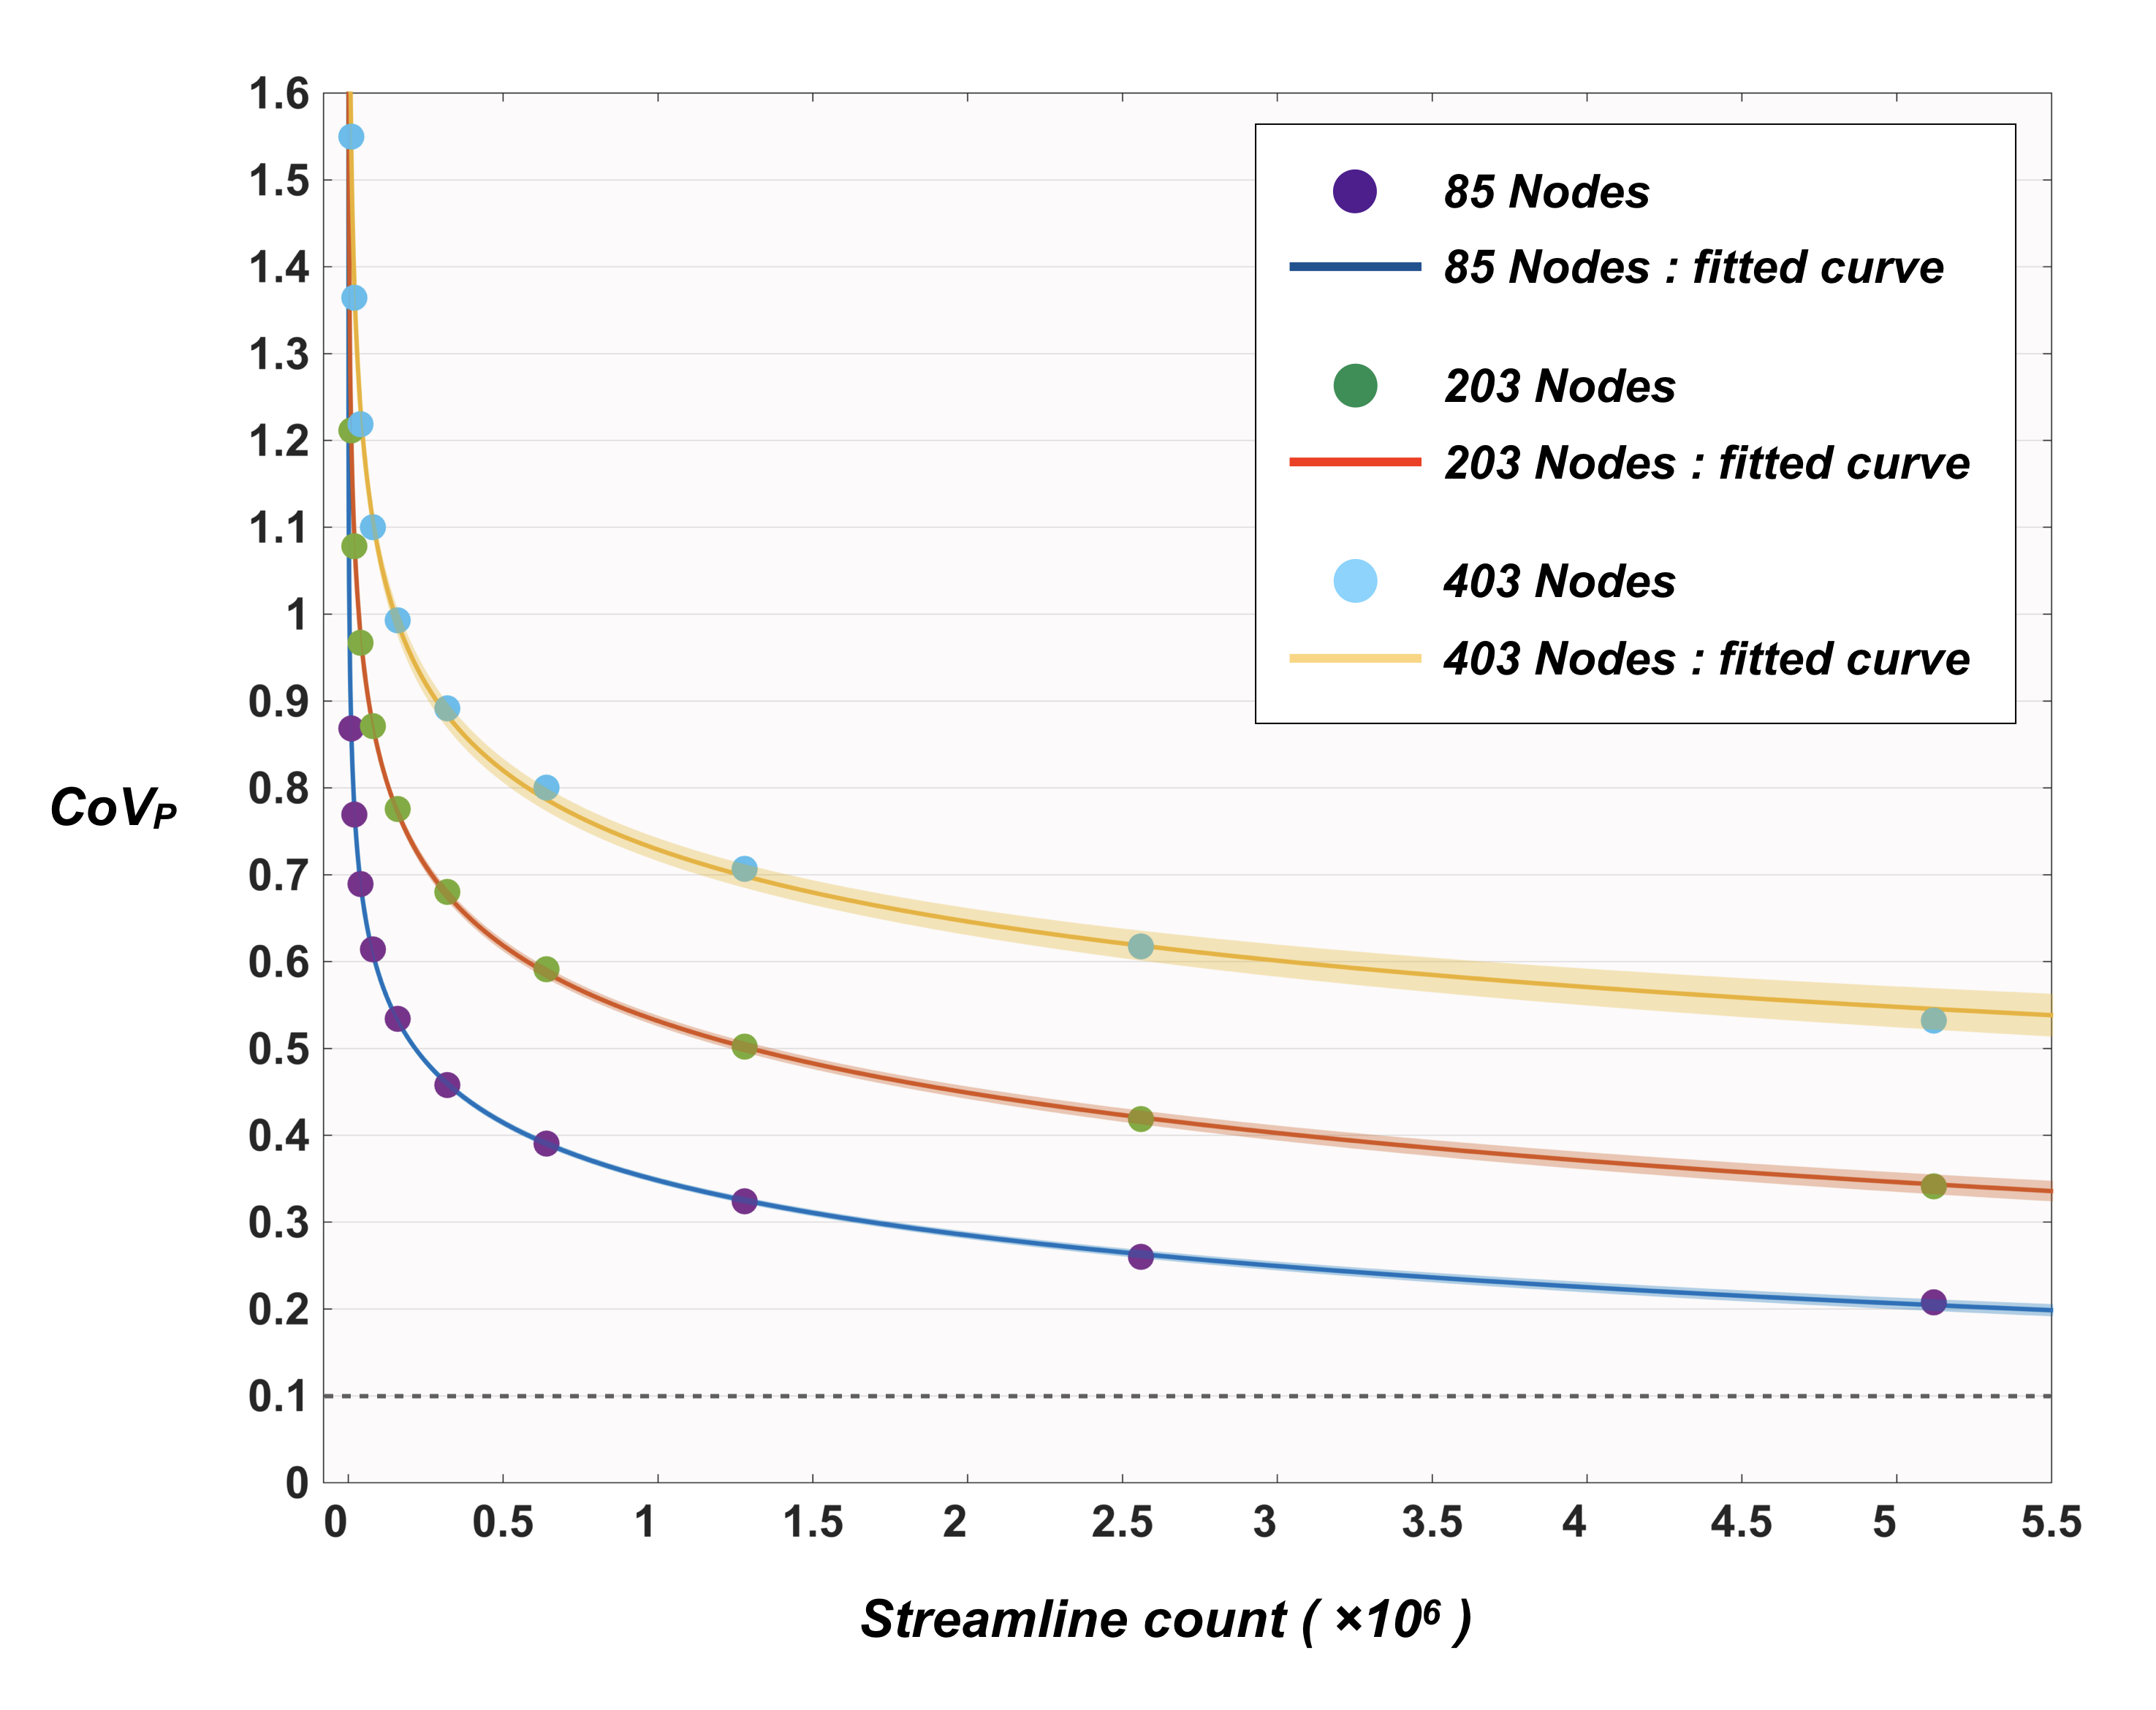
Figure 5 shows the distribution of CoVP as a function of streamline count. Curve fitting was performed heuristically using a range of models; the best fit was provided by a power-law function (adjusted R-squared > 0.99), by which the predicted minimum streamline counts of ~1.95×10⁷, ~5.97×10⁷, and ~4.70×10⁹ were required to reduce CoVP below 10% for 85/203/403 nodes respectively.
Discussion
We incorporate advanced tractography7, tractogram processing15, and surface-based parcellation techniques to investigate the required streamline count for reproducible connectome construction across a range of parcellation granularities. Our results demonstrate that an acceptable reproducibility (CoVP=0.1) can be achieved for the modern surface parcellation scheme of ~200 nodes3. However, when pursuing a brain parcellation scheme having >400 nodes, our initial evidence suggests that the required streamline count might become extremely time-intensive to reach a reasonable reproducibility, although more data using a greater number of streamlines are needed to confirm this finding. Furthermore, we reveal that high variabilities occur in a large proportion of edges even with a large number of streamlines, and the variabilities further increase with the parcellation granularity; this might therefore have important influences when performing per-edge statistical analysis using, e.g. network-based statistic17.Conclusion
We introduce an experimental reference for determining appropriate number of streamlines based on the granularity of surface parcellation schemes in order to provide adequate connectome reproducibility.Acknowledgements
No acknowledgement found.References
1. Glasser MF, et al. The Human Connectome Project's neuroimaging approach. Nat Neurosci. 2016; 19(9): 1175-1187.
2. Hou YK, et al. Consistent cortical reconstruction and multi-atlas brain segmentation. NeuroImage. 2016; 138: 197-210.
3. Parisot S, et al. A flexible graphical model for multi-modal parcellation of the cortex. NeuroImage. 2017; 162: 226-248.
4. Tzourio-Mazoyer N, et al. Automated anatomical labeling of activations in SPM using a macroscopic anatomical parcellation of the MNI MRI single-subject brain. NeuroImage. 2002; 15(1): 273-289.
5. Zalesky A, et al. Whole-brain anatomical networks: does the choice of nodes matter? NeuroImage. 2010; 50(3): 970-983.
6. Smith RE, et al. Anatomically-constrained tractography: improved diffusion MRI streamlines tractography through effective use of anatomical information. NeuroImage. 2012; 62(3): 1924-1938.
7. Yeh CH, et al. Mesh-based anatomically-constrained tractography for effective tracking termination and structural connectome construction. Proc. ISMRM. 2017; p.58.
8. Girard G, et al. Towards quantitative connectivity analysis: reducing tractography biases. NeuroImage. 2014; 98: 266-278.
9. Desikan RS, et al. An automated labeling system for subdividing the human cerebral cortex on MRI scans into gyral based regions of interest. NeuroImage. 2006; 31: 968-980.
10. Van Essen DC, et al. The WU-Minn Human Connectome Project: An overview. NeuroImage. 2013; 80:62-79.
11. Dale AM, et al. Cortical surface-based analysis: I. Segmentation and surface reconstruction. NeuroImage. 1999; 9: 179-194.
12. Patenaude B, et al. A Bayesian model of shape and appearance for subcortical brain segmentation. NeuroImage. 2011; 56(3): 907-922.
13. Jeurissen B, et al. Multi-tissue constrained spherical deconvolution for improved analysis of multi-shell diffusion MRI data. NeuroImage. 2014; 103: 411-426.
14. Tournier JD, et al. Improved probabilistic streamlines tractography by 2nd order integration over fibre orientation distributions. Proc. ISMRM. 2010; p.1670.
15. Smith RE, et al. SIFT2: Enabling dense quantitative assessment of brain white matter connectivity using streamlines tractography. NeuroImage. 2015; 119: 338-351.
16. Smith RE, et al. The effects of SIFT on the reproducibility and biological accuracy of the structural connectome. NeuroImage. 2015; 104: 253-265.
17. Zalesky A, et al. Network-based statistic: Identifying differences in brain networks. NeuroImage. 2010; 53(4): 1197-1207.
Figures