1556
Exploring Local Geometric Structure of Fiber Tracts Using Tract-Based Director Field Analysis1National Institutes of Health, Bethesda, MD, United States, 2University of Sydney, Sydney, Australia, 3Beihang University, Beijing, China, 4Cedars Sinai Medical Center, Los Angeles, CA, United States, 5Zhejiang University, Hangzhou, China
Synopsis
Inspired by distortion analysis of liquid crystals [1], we propose a novel mathematical framework, called tract-based director field analysis (TDFA), to explore the local geometric structure of fiber tracts after tractography. TDFA provides 6 scalar indices along tracts to quantify local orientational dispersion and orientational distortion (splay, bend, and twist) of fiber tracts. To our knowledge, this is the first work to quantify "splay", "bend" and "twist" of fiber tracts, although the three terms have been widely used to qualitatively describe the complexity of fiber tracts for about 20 years [2]. Synthetic and real data experiments demonstrate the effectiveness of the proposed scalar indices.
Motivations
1) Orientational dispersion (OD) has been proposed as a voxel-based feature in NODDI [3], and in our previous voxel-based director field analysis [4]. Here, we generalize it to describe local orientational dispersion of fiber tracts.
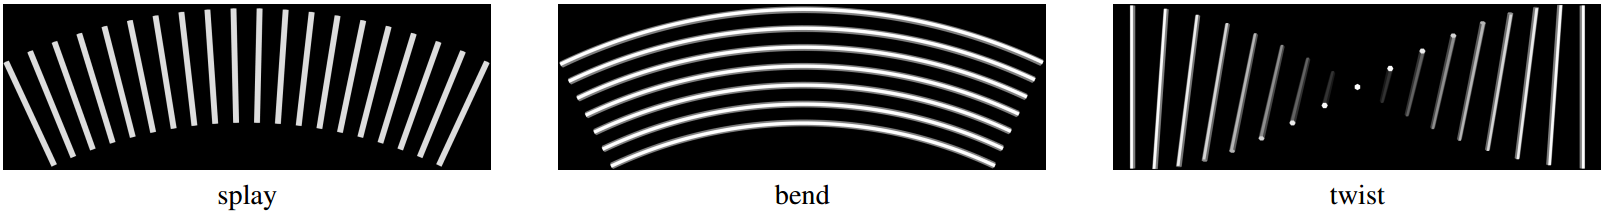
2) To our knowledge, there is currently no existing work to quantify the splay, bend, and twist patterns of fiber tracts. See Fig. 1.
Methods
Orientational order and dispersion. Considering a set of fiber tracts $$$\{C_i\}$$$ which are curves densely distributed in $$$\mathbb{R}^3$$$, for each point $$$x\in C_i$$$, inspired by liquid crystals [1,4], we define orientational order index (OO) as
\begin{equation} \text{OO} = \sum_{y\in \Omega(x)} w(y, x) \frac{3 (u_1(y)^T u_1(x))^2-1 }{2}, \end{equation}
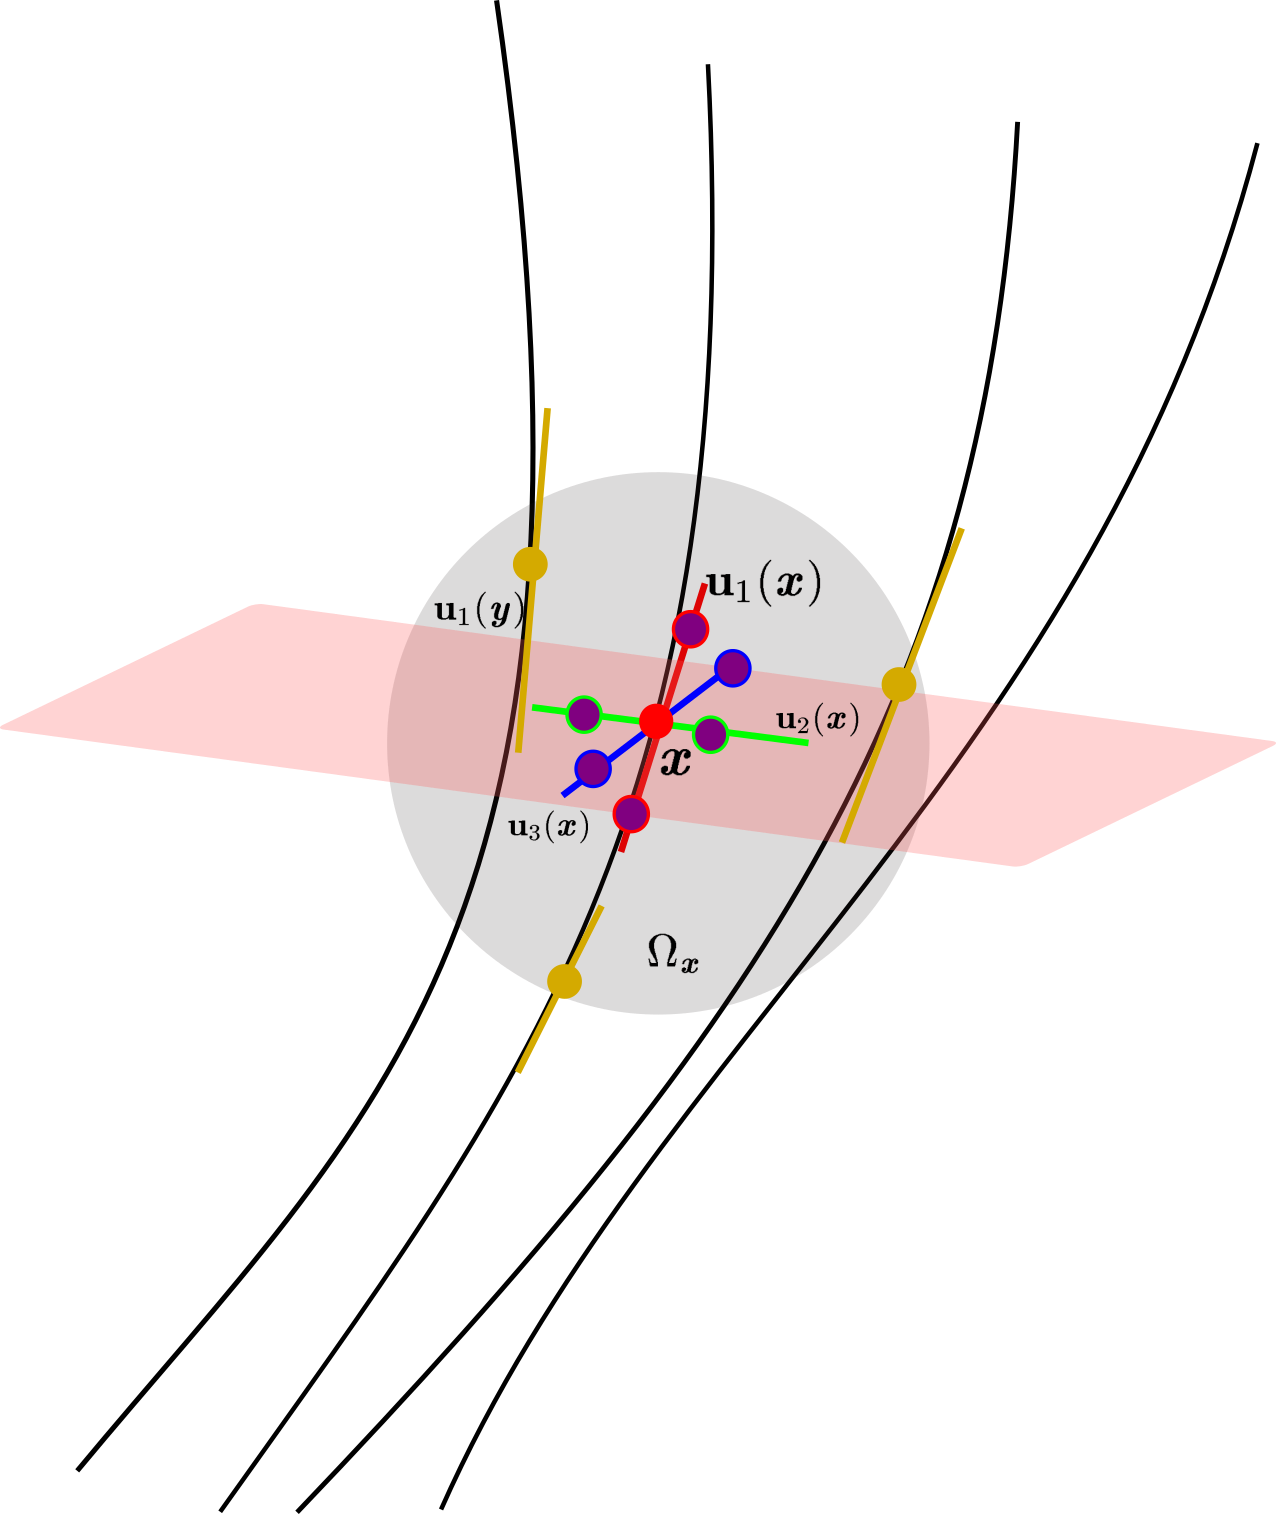
where $$$y$$$ is a point in a curve $$$C_j$$$ in a spatial neighborhood $$$\Omega(x)$$$ of $$$x$$$, $$$u_1(x)$$$ and $$$u_1(y)$$$ are unit norm tangent vectors of curves at $$$x$$$ and $$$y$$$, $$$w(y, x)$$$ is a spatial weighting function, $$$\sum_{y \in \Omega(x)} w(y,x)=1$$$. See Fig. 2. We have $$$\text{OO} \in [-0.5,1] $$$. Then, we define the orientational dispersion (OD) as $$$\text{OD}=1-\text{OO}$$$. Thus, $$$\text{OD} \in[0,1.5]$$$.
Frenet frame and local orthogonal frame. Curvature and torsion are typical geometric features for a single curve based on the Frenet frame [2]. However, there are several limitations of the Frenet frame: 1) It requires a direction of a curve; 2) It is defined only for a single curve, not for a set of curves; 3) For a straight line, it is not well defined because the curvature of straight lines is 0. We define a director as a vector which is equivalent with its negative [4]. We propose a local orthogonal frame for each point $$$x$$$ in a curve. The local orthogonal frame has 3 directors. The first director is the tangent vector at the point, and the other two directors are in the orthogonal plane of the first director. We project all directors in a local neighborhood $$$\Omega_{x}$$$ of $$$x$$$ onto the orthogonal plane, and set the second director as the principal eigenvector of the covariance matrix of the projected directors, i.e., the principal component in PCA. Then, the third director is the cross product of the first two directors. See Fig. 2. We proved that when $$$\Omega_x$$$ tends infinitesimally small, the local orthogonal frame converges to the Frenet frame.
Orientational distortions (splay, bend, and twist). Based on distortion analysis of liquid crystals, there are 3 types of orientational distortions as showed in Fig. 1. 1) splay: bending occurs perpendicular to the director; 2) bend: bending is parallel to the director; 3) twist: neighboring directors are rotated with respect to one another, rather than aligned. Inspired by liquid crystals [1,4], after obtaining the local orthogonal frame for each point, we define three scalar indices to describe the three types of distortions, and a total distortion index:
\begin{align} \text{Splay:} \ \ & s = \sqrt{ (u_2^T\frac{\partial u_1}{\partial u_2} )^2 + (u_3^T\frac{\partial u_1}{\partial u_3} )^2} \\ \text{Bend:} \ \ & b = \sqrt{ (u_2^T\frac{\partial u_1}{\partial u_1} )^2 + (u_3^T\frac{\partial u_1}{\partial u_1} )^2} \\ \text{Twist:} \ \ & t = \sqrt{ (u_2^T\frac{\partial u_1}{\partial u_3} )^2 + (u_3^T\frac{\partial u_1}{\partial u_2} )^2} \\ \text{Total distortion:} \ \ & d = \sqrt{ s^2 + b^2 + t^2 } \end{align},
where $$$\frac{\partial u_1}{\partial u_i}$$$, $$$i=1,2,3$$$ indicates directional spatial derivative of $$$u_1(x)$$$ along $$$u_i(x)$$$, i.e.,
\begin{equation} \frac{\partial u_1}{\partial u_i} = \lim_{k\to 0} \frac{\text{Diff}_d(u_1(x+k u_i), u_1(x-k u_i)}{2k}\end{equation},
where $$$\text{Diff}_d$$$ means the difference of two directors in the director representation [4]. Since the director field is not continuous in practice, we use an interpolation method to estimate $$$u_1(x+k u_i)$$$ and $$$u_1(x-k u_i)$$$ from local neighborhoods of $$$x+k u_i$$$ and $$$x-k u_i$$$.
Experiments
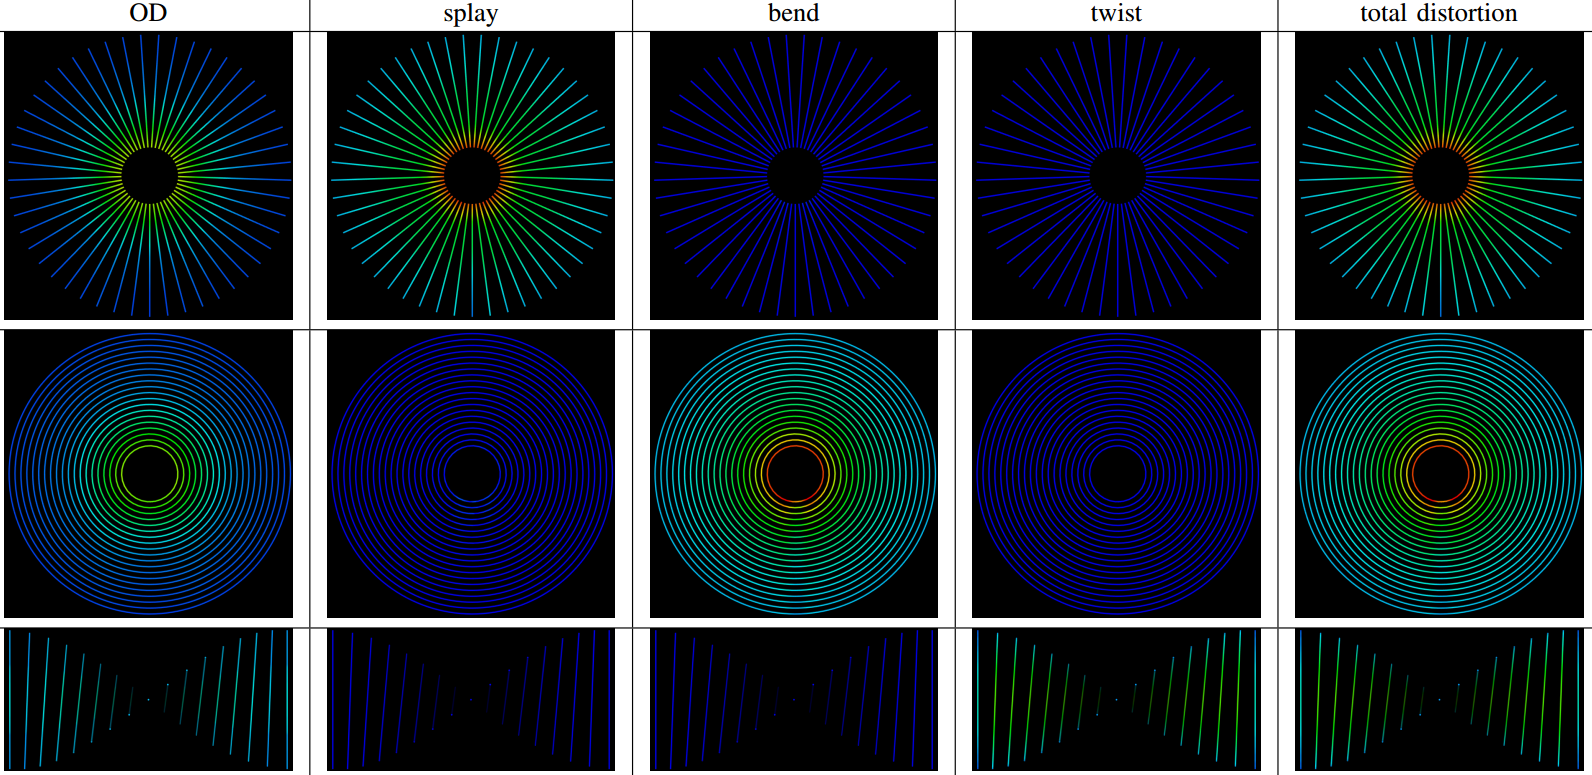
We generated synthetic fiber tracts which demonstrate these three types of distortions, and then calculated the proposed scalar indices for each point in the fiber tracts. These scalar indices were used to color the fiber tracts. See Fig. 3. The experiment showed that the proposed splay, bend, and twist indices completely separate these 3 datasets, where only one among these 3 values is non-zero in each dataset.
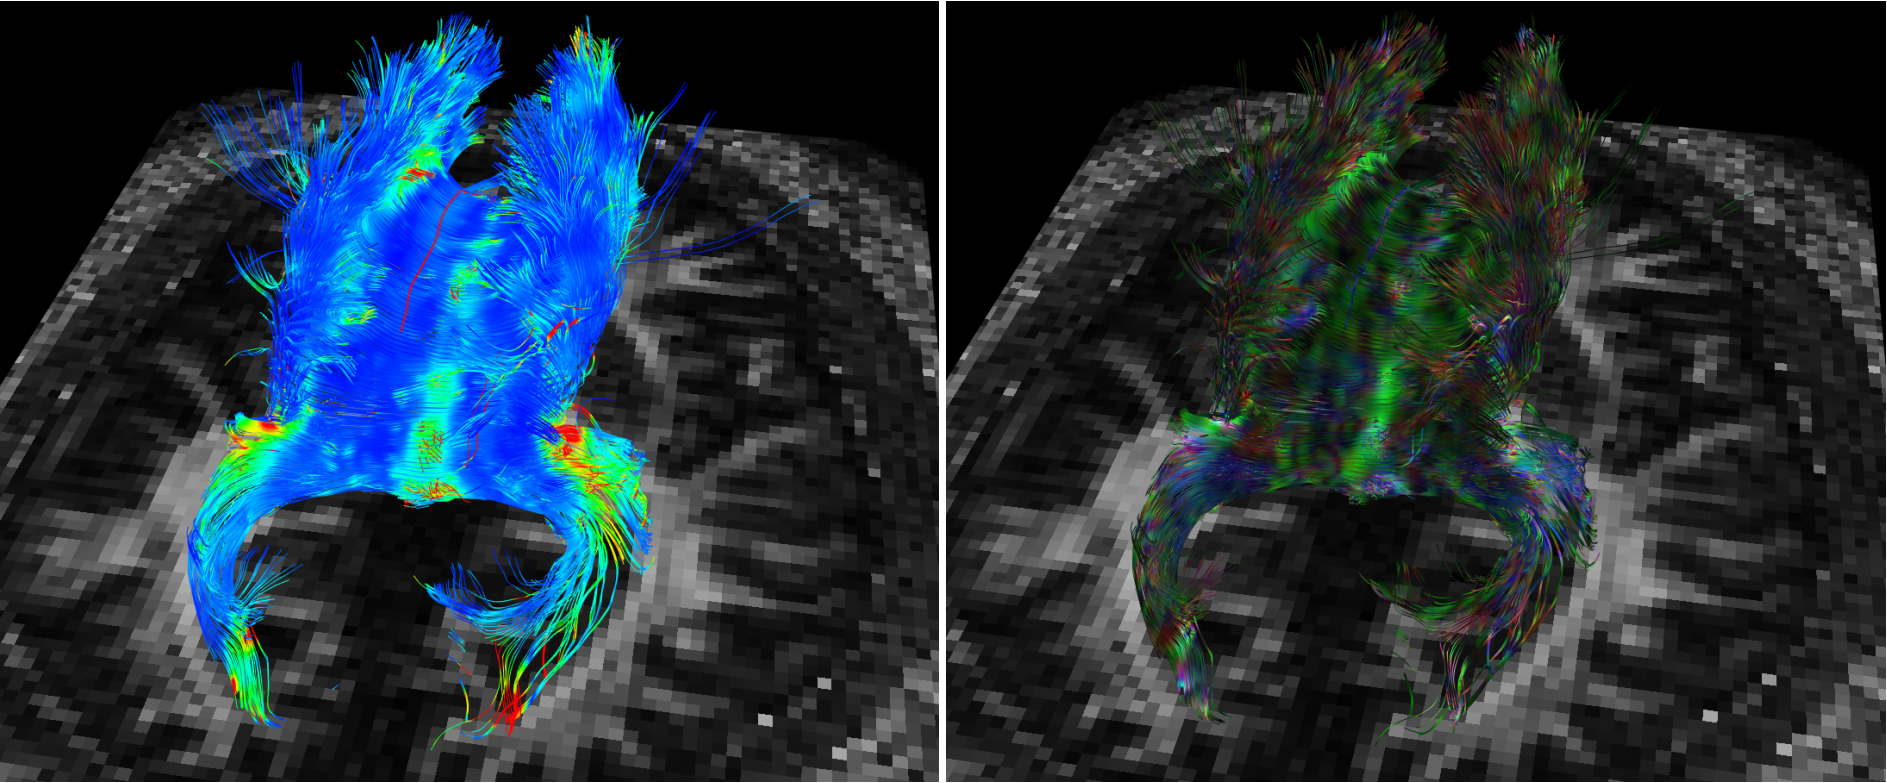
We performed tractography on a publicly available dataset with a single subject from DIPY [5]. The data has a single shell with $$$b=2000 \text{s}/\text{mm}^2$$$ and 150 directions on the shell. The corpus callosum (CC) was extracted based on diffusion ODF and deterministic tracking. Then, all six indices were calculated from the fiber tracts of CC. Fig. 4 showed the scalar indices as colors of tracts.
Conclusion
We proposed a unified mathematical framework called tract-based director field analysis (TDFA) to explore geometric structure of fiber tracts. OD is useful to describe the degree of local dispersion of fiber tracts. The distortion indices demonstrated good sensitivity in both 3 synthetic datasets and a real dataset on corpus callosum.Acknowledgements
This work was supported in part by funds provided by the Intramural Research Program of the Eunice Kennedy Shriver National Institute of Child Health and Human Development (NICHD) (ZIA-HD000266), and Australian funds (ARC FT-130101457 and DP-140102164).References
- D. Andrienko, “Introduction to liquid crystals,” IMPRS school, Bad Marienberg, 2006.
- P. J. Basser, “New histological and physiological stains derived from diffusion-tensor MR images,” Annals of the New York Academy of Sciences, vol.820, no. 1, pp. 123–138, 1997.
- H. Zhang, T. Schneider, C. A. Wheeler-Kingshott, and D. C. Alexander, “NODDI: practical in vivo neurite orientation dispersion and density imaging ofthe human brain,” Neuroimage, vol. 61, no. 4, pp. 1000–1016, 2012.
- J. Cheng and P. J. Basser, “Director Field Analysis (DFA): Exploring Local White Matter Geometric Structure in diffusion MRI,” Medical Image Analysis, 2017.
- E. Garyfallidis, M. Brett, B. Amirbekian, A. Rokem, S. Van Der Walt, M. Descoteaux, I. Nimmo-Smith, and D. Contributors, “Dipy, a library for theanalysis of diffusion mri data,” Frontiers in neuroinformatics, vol. 8, 2014.
Figures