1554
Damped Richardson-Lucy deconvolution for multi-shell diffusion MRI1Image Sciences Institute, University Medical Center Utrecht, Utrecht, Netherlands, 2NATBRAINLAB, Department of Neuroimaging and NIHR Biomedical Research Centre, Institute of Psychiatry, King's College London, London, United Kingdom
Synopsis
The damped Richardson-Lucy (DRL) algorithm is a popular spherical deconvolution technique to quantify fiber orientation distributions from single-shell brain diffusion MRI (dMRI) data. Thanks to the progress of acquisition hardware, it is becoming increasingly common to acquire multi-shell dMRI data, which has the potential, to deliver additional information on the microstructure of tissues. In this work we extended the DRL framework to accommodate multi-shell data while accounting for multiple tissue types in the brain, to reduce partial volume contamination on the main FODs. The approach was tested on two dataset and proved to be stable over different acquisition schemes.
INTRODUCTION
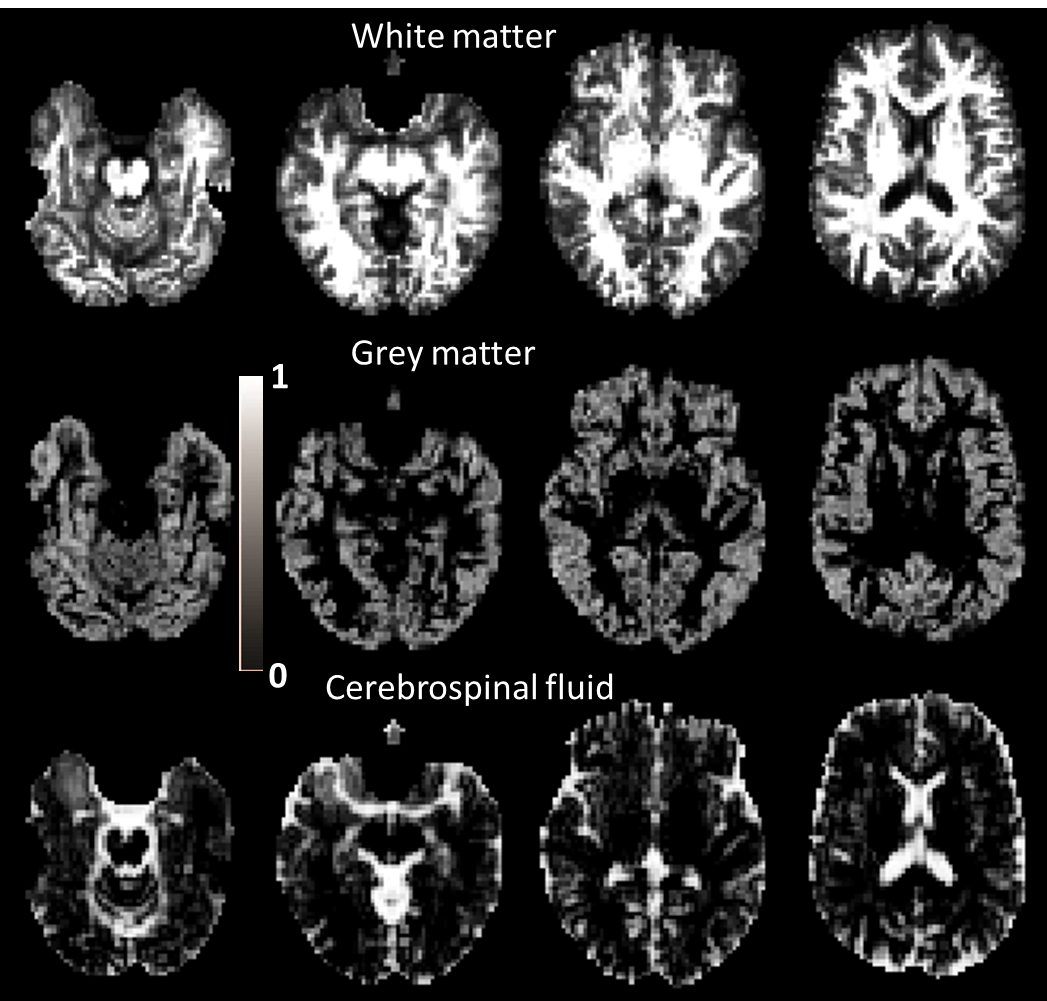
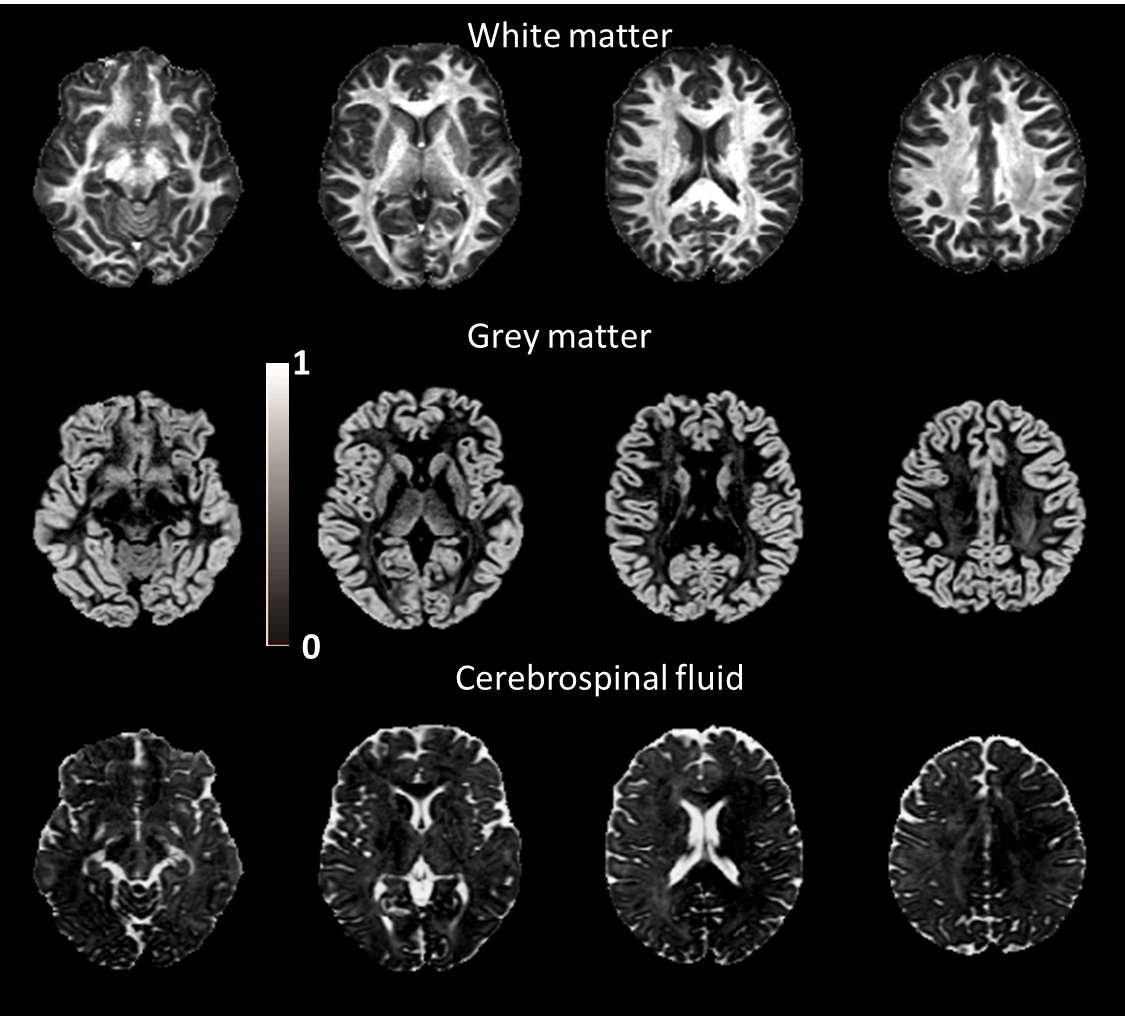
Damped Richardson-Lucy (DRL)[1] is one of the widely used spherical deconvolution methods resolving crossing fiber orientation distributions (FODs) from single-shell brain diffusion MRI (dMRI) data, which can be used for fiber tracking purposes or for generalized voxel-wise statistics[2,3]. The advent of multi-shell dMRI allows to extend such deconvolution techniques to estimate more specific white matter (WM) FODs while accounting for the partial volume effect from other compartments, such as grey matter (GM) and cerebrospinal fluid (CSF). The extended DRL framework accommodates multi-shell data, and estimates the volume fractions of WM, GM and CSF for each voxel. We tested the extended DRL on two multi-shell in-vivo diffusion MRI dataset.
METHODS
Given the voxel-wise single-shell dMRI signal S, the original single-shell DRL (sDRL) implementation defines a kernel H with projections of pre-defined diffusion tensors over the unit sphere, then derives the FOD with an iterative algorithm damping oscillations in the FOD[4]. To accommodate for multi-shell data, multiple instances of H, corresponding to different diffusion weightings, were concatenated along the rows. A second kernel Y was generated to account for isotropic partial volume effects (later indicated as fractions, f) with 2 isotropic processes centered respectively at 0.7 and 3.0 x 10⁻³ mm2/s, the common literature values of GM and CSF in the brain. The extended DRL algorithm can be written as an iterative process:
$$FOD^{i}=H^{-1}(S-Y*\begin{bmatrix}{f_{GM}}^{i-1} \\{f^{CSF}}^{i-1} \end{bmatrix}) [1]$$
$$\begin{bmatrix}{f_{WM}}^{i} \\{f_{GM}}^{i} \\{f_{CSF}}^{i} \end{bmatrix} = argmin_{f\geqslant0} \left\lVert \begin{bmatrix}[H*\overline{FOD}]Y\end{bmatrix}*\begin{bmatrix}{f_{WM}} \\{f_{GM}} \\{f_{CSF}} \end{bmatrix}-S \right\rVert_{2}^{2}[2]$$
$$$\overline{FOD}$$$ in Eq. [2] denotes a median thresholded FOD. Eq. [1] was solved with the DRL approach setting $$$f_{GM}$$$ and $$$f_{CSF}$$$ to 0 at the first iteration. The method was applied on two datasets to derive the voxel-wise FOD and f maps:
- Data1: a clinical dataset acquired at 3T with voxel-size 2.5x2.5x2.5mm3, with 13 b=0s/mm2, 20 b=1000s/mm2, 40 b=2000s/mm2 and 60 b=3000s/mm2.
- Data2: 2 subjects from the Human Connectome Project (HCP)[5], with 18 b=0s/mm2, and 90 directions at b = 1000, 2000, 3000s/mm2.
Finally, the whole brain tractography of one subject from Data2 was computed with both the classic and the extended DRL approaches in ExploreDTI[6].
RESULTS
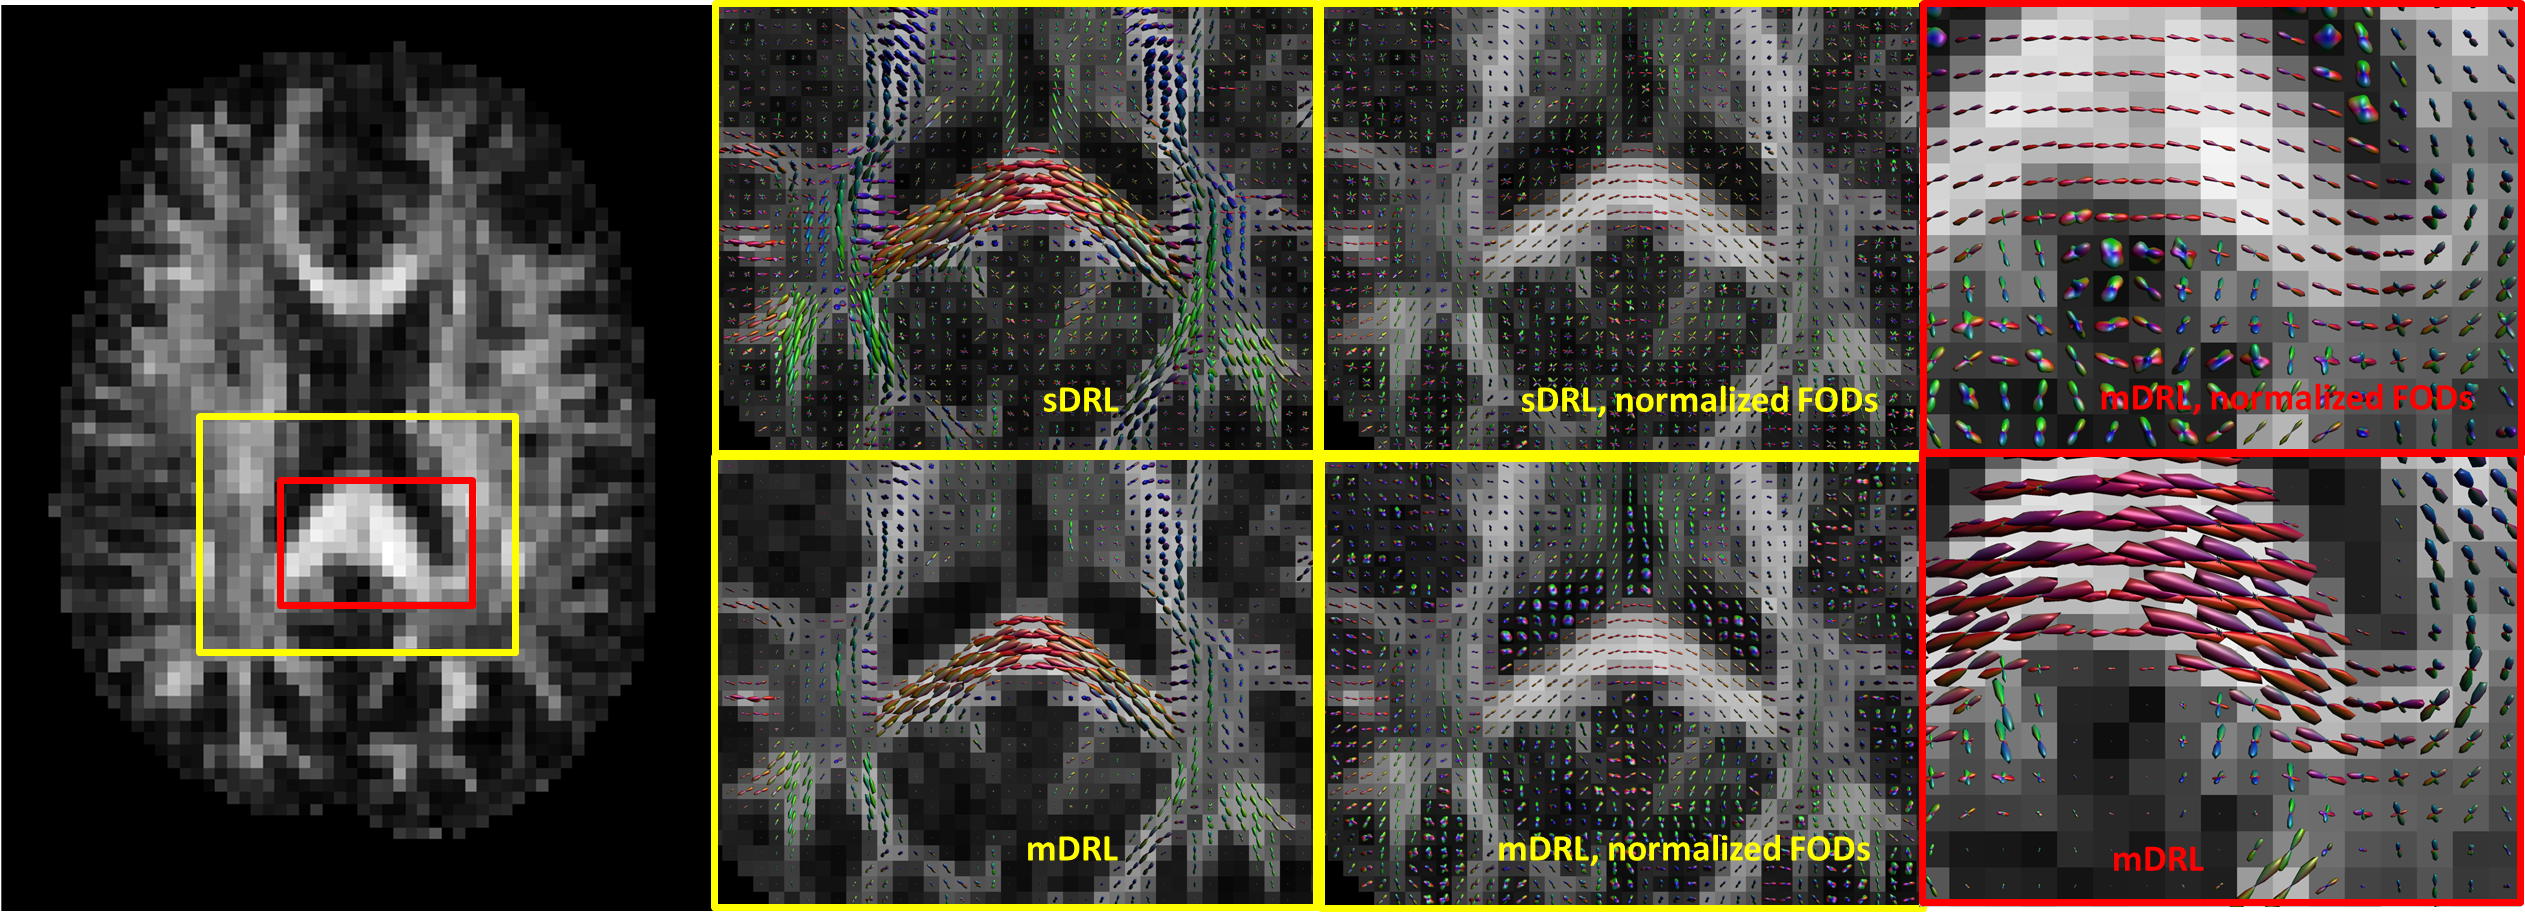
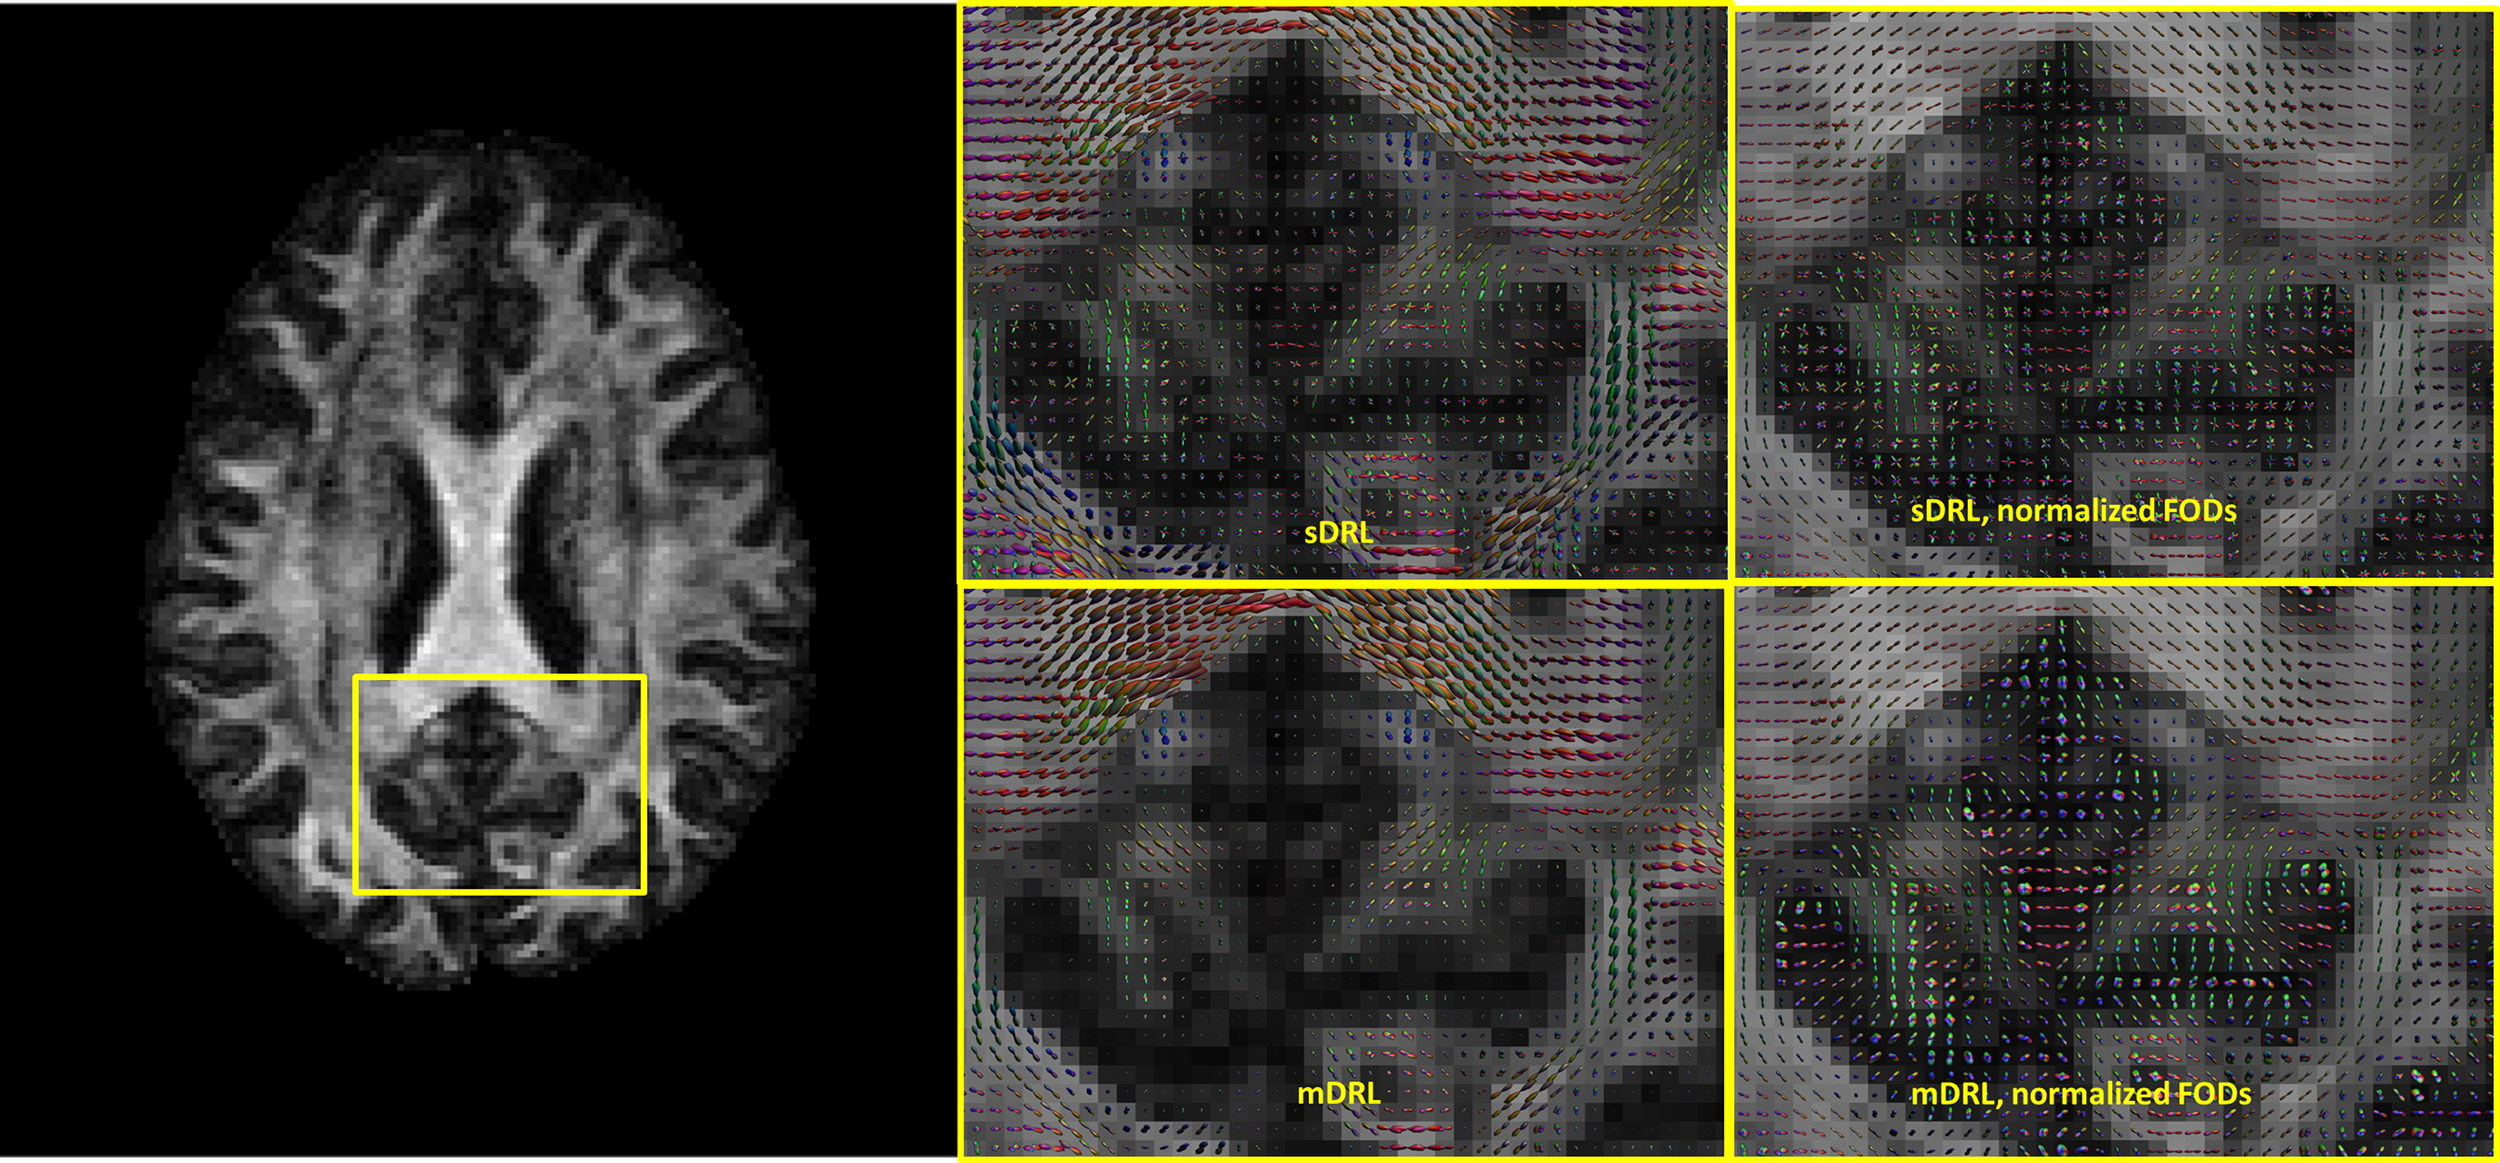
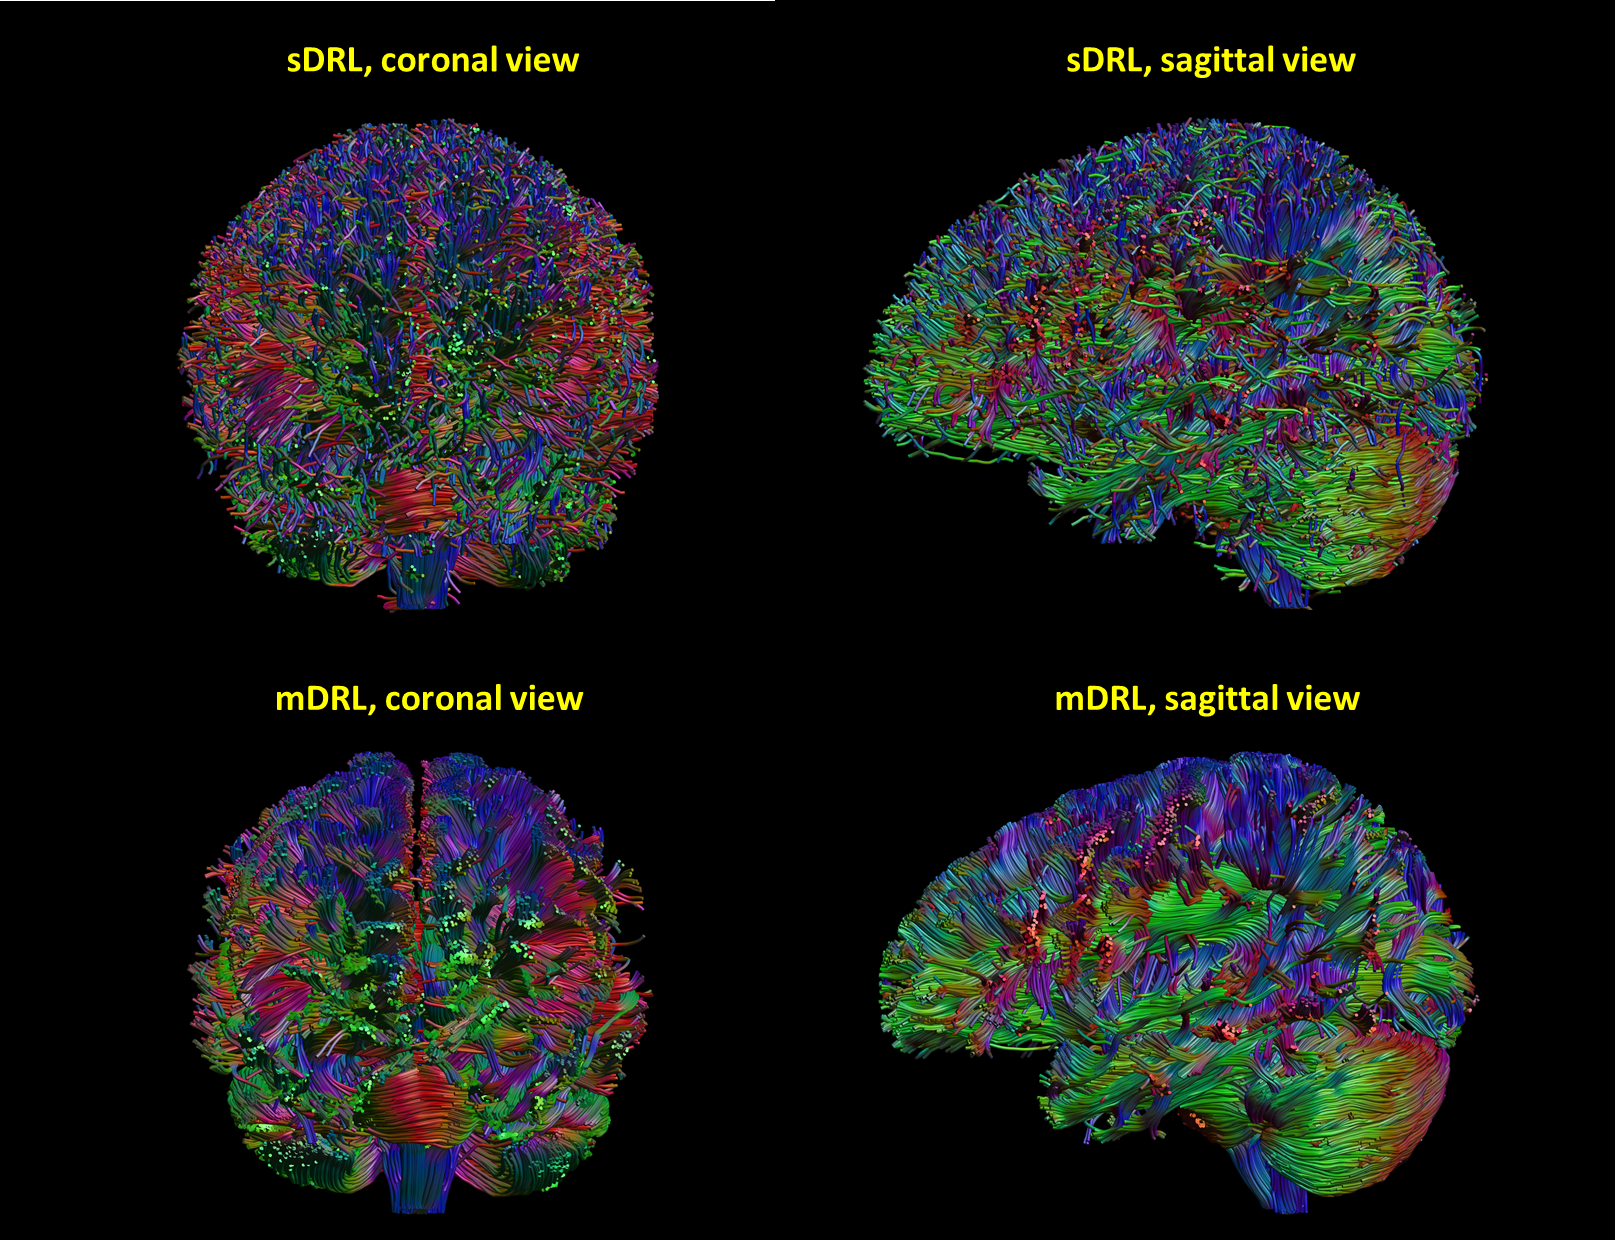
Fig.1 and Fig.2 show the estimated tissue signal fractions for Data1 and Data2. The three signal fractions were in agreement with known anatomy. Fig.3 shows the FODs estimated from the original DRL (sDRL) and the extended DRL for multi-shell data (mDRL) for Data1. Comparing the FODs, mDRL penalized the CSF and GM partial volumes, while similarly detecting the FODs in WM area. From the normalized FODs, where the isotropic area (GM and CSF) were normalized to the same size of WM area, almost isotropic FODs from mDRL can be observed in place of the multiple spurious peak FODs from sDRL. Looking more in detail (red square), it is visible that the isotropic FODs have been suppressed in mDRL. Fig.4 shows the FODs computed on Data2 with sDRL and mDRL. As for Data1, isotropic compartments were suppressed in mDRL FODs compared to sDRL. Fig.5 shows the whole brain tractography of Data2 from sDRL and mDRL FODs seen from a coronal and a sagittal view. The tractography from mDRL FODs was clear to visualize, with less spurious fibers reconstructed in the tracts, and a more clear delineation of the sagittal sinus.DISCUSSION
In this study we extended the single-shell spherical deconvolution approach DRL to a multi-shell framework. The FODs of the two in-vivo dataset were estimated both from the original sDRL and the extended mDRL. Results show that mDRL can reliably estimate white-matter FODs while suppressing partial volume effects from isotropic compartments. Tissue signal fractions of WM, GM and CSF were similarly estimated on both datasets and in line with expected anatomy. Whole brain tractography from mDRL FODs resulted in a cleaner tractogram, with less spurious tracts, and fibers appeared to end more closely to the WM/GM interface. This approach needs further testing on more datasets, to validate its design and the definition of the tuning of the parameters used to define the deconvolution matrix.CONCLUSION
The extended mDRL framework can take advantage of multi-shell dMRI data to provide signal fractions estimations while resulting in better FODs estimation than the single shell counterpart.Acknowledgements
The research of F.G. was funded by China Scholarship Council.References
1. Dell'Acqua, Flavio, et al. "A model-based deconvolution approach to solve fiber crossing in diffusion-weighted MR imaging." IEEE Transactions on Biomedical Engineering 54.3 (2007): 462-472.
2. Raffelt, David, et al. "Apparent fibre density: a novel measure for the analysis of diffusion-weighted magnetic resonance images." Neuroimage 59.4 (2012): 3976-3994.
3. Dell'Acqua, Flavio, et al. "Can spherical deconvolution provide more information than fiber orientations? Hindrance modulated orientational anisotropy, a true‐tract specific index to characterize white matter diffusion." Human brain mapping 34.10 (2013): 2464-2483.
4. Dell'Acqua, Flavio, et al. "A modified damped Richardson–Lucy algorithm to reduce isotropic background effects in spherical deconvolution." Neuroimage 49.2 (2010): 1446-1458.
5. Van Essen, David C., et al. "The WU-Minn human connectome project: an overview." Neuroimage 80 (2013): 62-79.
6. Leemans, A., et al. "ExploreDTI: a graphical toolbox for processing, analyzing, and visualizing diffusion MR data." 17th Annual Meeting of Intl Soc Mag Reson Med. Vol. 209. 2009.
Figures