1552
Effect of Stereotactic Body Radiotherapy on Perfusion and Diffusion in Prostate Tumor and Benign Tissue1Memorial Sloan Kettering Cancer Center, New York, NY, United States, 21275 York Avenue, Memorial Sloan Kettering Cancer Center, New York, NY, United States
Synopsis
Multimodality MRI including DCE-MRI and DW-MRI were performed in patients prior to and following hypofractionated stereotactic body radiotherapy (SBRT). Diffusion and perfusion related parameters in both tumor and non-tumor benign tissue were calculated at 3, 6, and 12 months after SBRT. Radiation-induced changes were observed in perfusion and diffusion related parameters in tumors. In the non-tumor transition zone, SBRT induced changes in perfusion-related parameters. Multimodality MRI has potential for treatment effect monitoring in the prostate after SBRT.
Introduction
Hypofrationated stereotactic body radiation therapy (SBRT) is being increasingly employed in prostate cancer due to the limited number of treatment fractions and comparable effectiveness and toxicity to longer regimes. PSA testing is limited as an early response marker after radiation therapy (RT) due to variability in time to PSA nadir and subsequent doubling and therefore, other predictive or prognostic biomarkers would be valuable in guiding the use of this treatment modality. The aim of this prospective study was to quantify the changes in prostate cancer diffusion and perfusion parameters measured by multimodality MRI (mMRI) following SBRT. In addition, the current study assessed the effect of hypofractionated SBRT on benign tissue in the prostate gland to characterize potential physiologic changes in the peripheral and transition zones. The ultimate goal of this project is to determine whether parameters derived from mMRI can serve as predictive or prognostic biomarkers of SBRT treatment efficacy.Methods
As part of an ongoing IRB-approved study, 26 patients undergoing hypofractionated SBRT (5 x 800cGy) for prostate cancer underwent MRI with diffusion and perfusion measurements prior to any treatment, following ADT and prior to RT (if applicable), and 3, 6, and 12 months after completion of RT. Inclusion criteria for the study included biopsy proven adenocarcinoma, MR-visible tumor ≥ 0.5 cm in diameter, and no metastatic disease. All imaging was performed on a 3.0 Tesla Philips Ingenia MR imager. In addition to standard anatomical T1 and T2-weighted imaging, subjects underwent dynamic contrast-enhanced (DCE) perfusion imaging (3D SPGR, transverse plane, voxel size = 1.0 x 1.0 x 4mm3, TR/TE = 4ms/2ms, frame length = 5-6 s, flip angle 8°, 1 acquisition) and multi-b-value diffusion-weighted imaging (single-shot EPI, 16 b-values between 0 and 1000 s/mm2], transverse plane, voxel size 1.1 x 1.1 x 4.5 mm3). Tumor regions-of-interest were identified on images by GU expert radiologists in prostate MRI. If tumor was not detectable in post-treatment images, the ROI was located in the pretreatment tumor location. Benign tissue regions of interested were placed in peripheral zone (PZ) and transition zone (TZ). TZ ROIs could consist of stromal, nodular or mixed tissue. ROI analysis software was developed in Matlab and incorporated in CERR (1). DCE data were fit to the extended Tofts model (2) on a voxel-by-voxel basis using a reference-region-scaled population average AIF (3). Ktrans, ve, and Kep were reported. Diffusion data were fit to a single exponential model to calculate apparent diffusion coefficient (ADC). To calculate diffusion parameters including intra-voxel incoherent motion (IVIM), the data for the 8 b values < 200 s/mm2 and for the 8 b values > 200 s/mm2 were fit to separate single exponentials. Changes in parameters compared to pre-treatment values were assessed using the paired student t test.Results
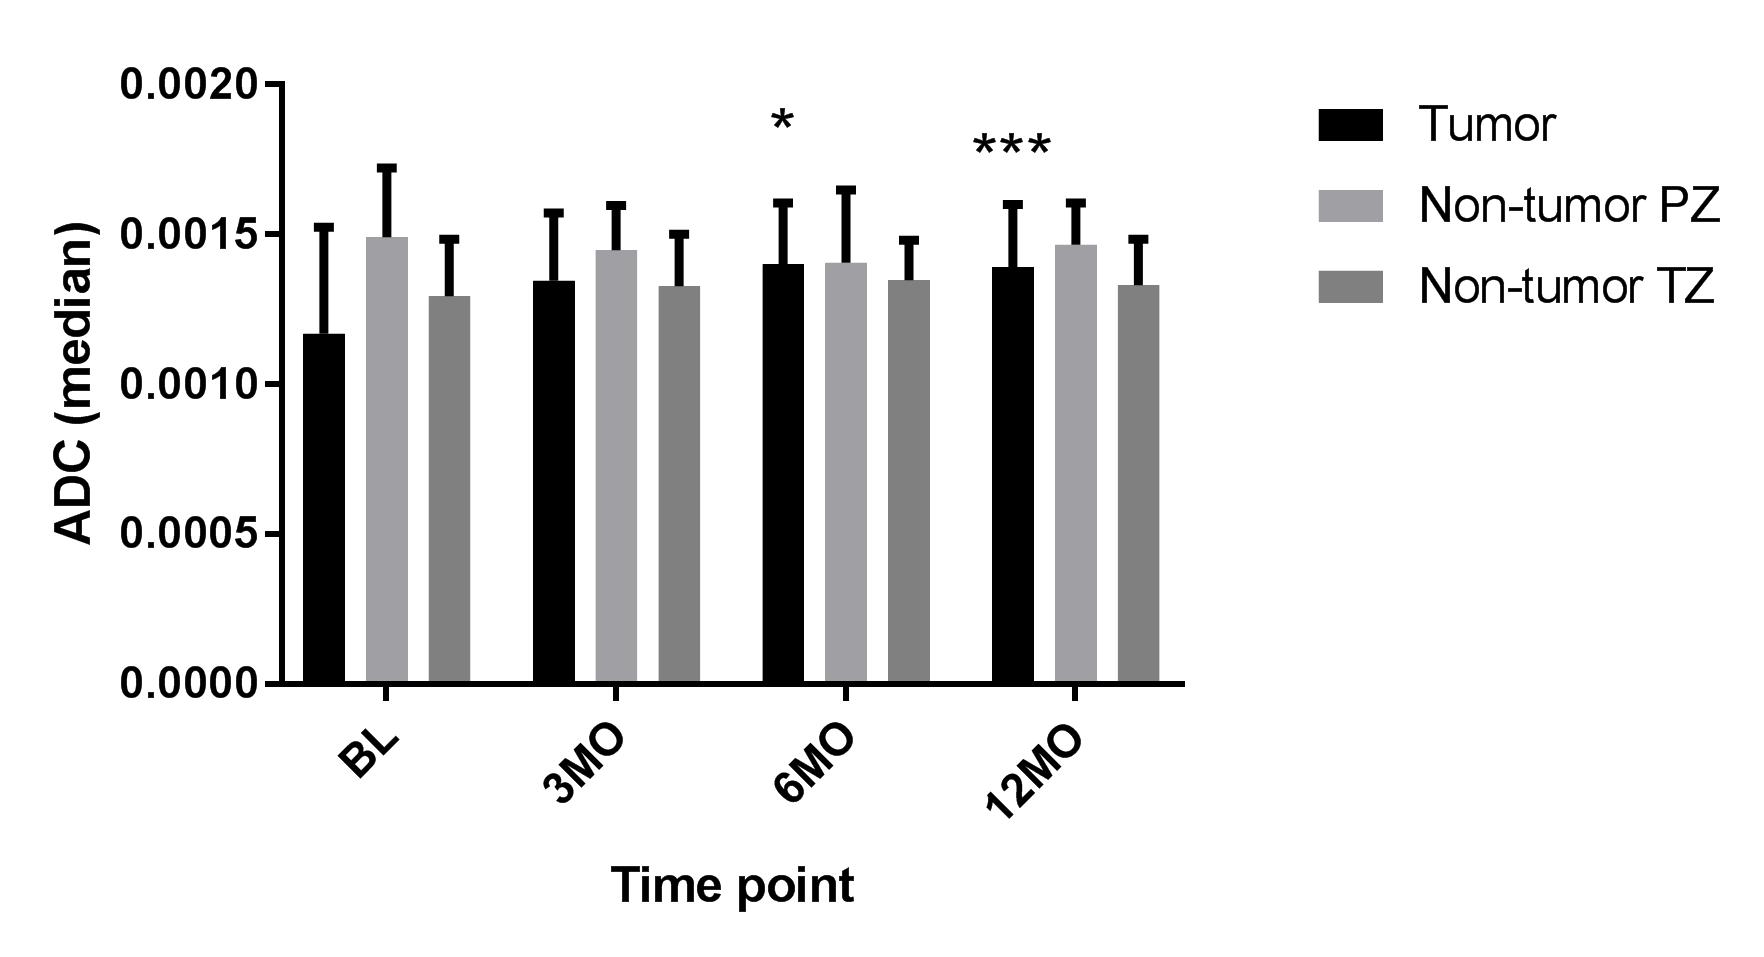
Diffusion Results. In tumors, the ADC at 6 months (1.46 ± 0.286 mm2/s x10-3) and 12 months (1.401 ± 0.178 mm2/s x10-3) after SBRT increased significantly compared to baseline (1.123 ± 0.33 mm2/s x10-3), P<0.05 and P < 0.005, respectively (see Figure 1). Dt was also increased at 12 months (1.163 ± 0.098 mm2/s x10-3, compared to baseline (1.068 ± 0.266 mm2/s x10-3), P < 0.05). Other IVIM parameters were unchanged. In non-tumor PZ and TZ, there were no changes in ADC, nor any IVIM-related parameter value at time points post SBRT (see Figure 1).
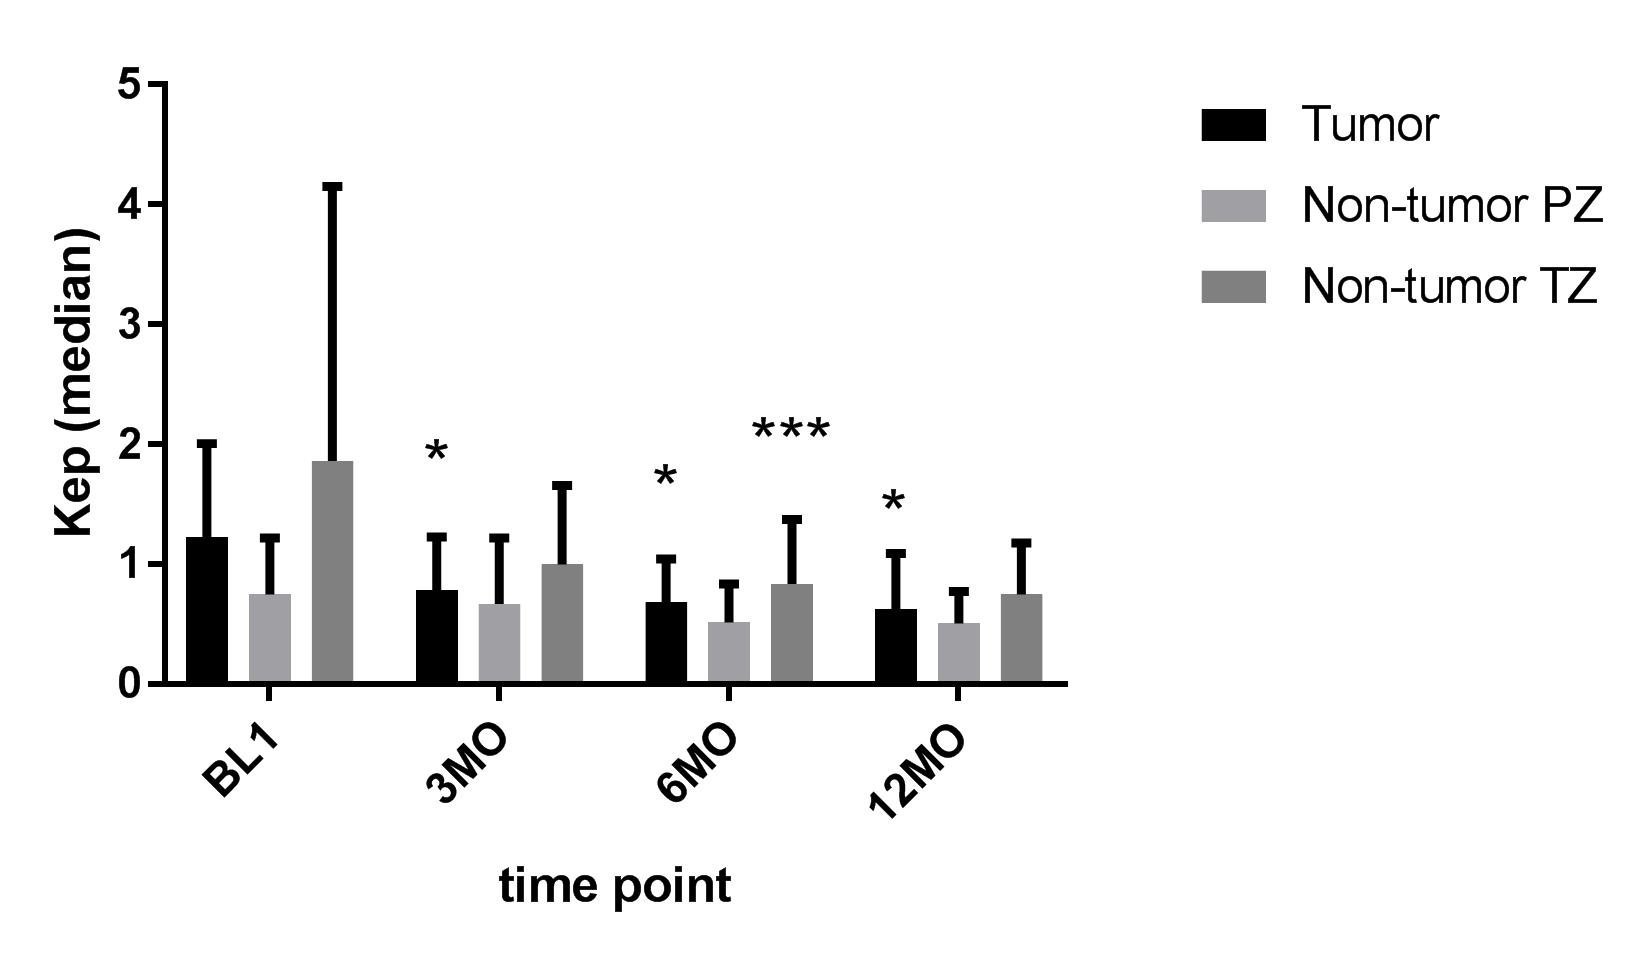
DCE-MRI Results. In tumors, Kep was reduced significantly at 3 months (0.794± 0.445 min-1), 6 months (0.677 ± 0.341 min-1), and 12 months (0.635 ± 0.447 min-1) compared to baseline (1.107 ± 0.751 min-1), P < 0.05 at all 3 time points (See Fig 2). In addition, ve in tumor was increased at 6 (0.748 ± 0.194) and 12 months (0.831 ± 0.223) compared to pre-treatment (0.583 ± 0.211), P < 0.05 for all. In non-tumor TZ tissue, median Ktrans was decreased at 6 months ((0.672 ± 0.51 min-1) compared to baseline (1.189 ± 1.14 min-1) (P < 0.05). Median Kep was also decreased at 6 months in the TZ (0.998 ± 0.669 min-1) vs baseline (1.861 ± 2.291 min-1) (P < 0.005) (Fig 2). PZ tissue showed no perfusion changes.
Discussion
The effect of hypofractionated SBRT was detected in both tumor and non-tumor prostate tissue using mMRI. In tumors, diffusion-related (ADC, Dt,) and perfusion related parameters (Kep, ve) changed after SBRT. Diffusion-related parameters in PZ and TZ were unaffected by SBRT, while Ktrans and Kep in the non-tumor TZ were decreased. These data suggest that mMRI may have potential to monitor tumor response after SBRT as well as monitor changes in background normal tissue.Acknowledgements
No acknowledgement found.References
[1] Deasy JO, Blanco AI, Clark VH. CERR: a computational environment for radiotherapy research. Med Phys 2003;30(5):979-985.
[2] Tofts PS. Modeling tracer kinetics in dynamic Gd-DTPA MR imaging. J Magn Reson Imaging 1997;7(1):91-101.
[3] Kovar, DA, Lewis, M, Karczmar, GS. A new method for imaging perfusion and contrast extraction fraction... J Magn Reson Imaging. 1998;8:1126-1134.
Figures