1547
Liver metabolomic investigation of lentiviral targeting of GDPD5 and GDPD6 for breast cancer treatment in a preclinical model1The Russell H. Morgan Department of Radiology and Radiological Science, Johns Hopkins University School of Medicine, Baltimore, MD, United States, 2San Juan Bautista School of Medicine, Caguas, PR, United States, 3The Sidney Kimmel Comprehensive Cancer Center, The Johns Hopkins University School of Medicine, Baltimore, MD, United States
Synopsis
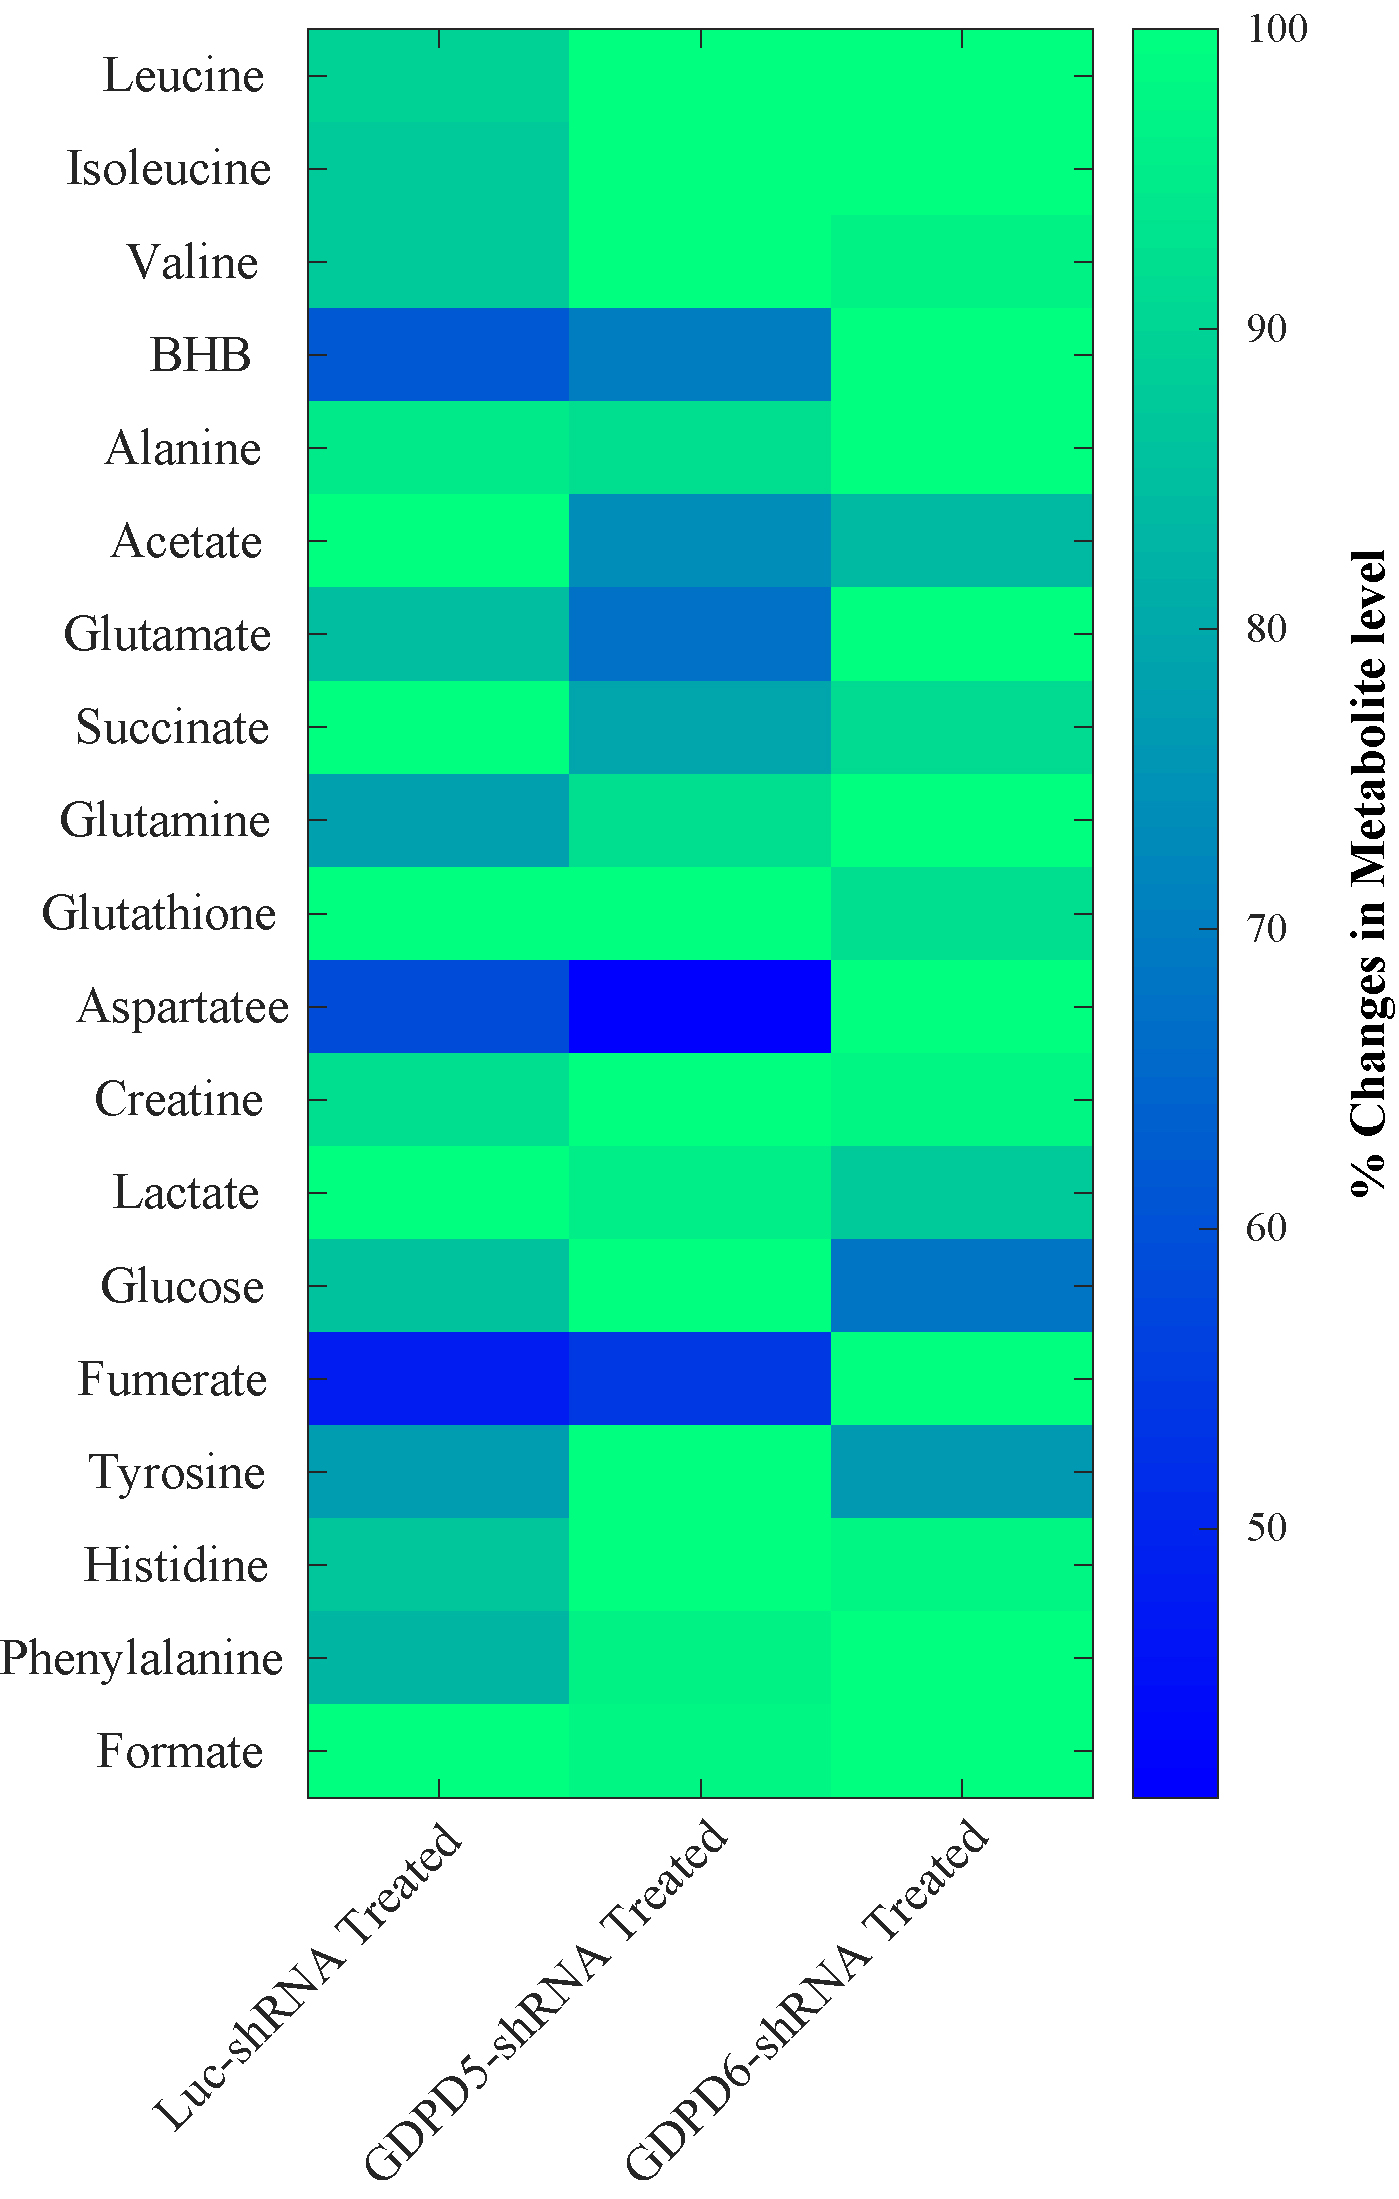
High-resolution 1H MRS is a powerful technique for metabolomics studies of tissues, cells, and body fluids. Here we have used this technique to explore metabolomic changes in the livers of mice that have been treated with lentiviral particles that silence either of the two glycerophosphodiesterase GDPD5 (GDPD5-shRNA) or GDPD6 (GDPD6-shRNA). We systemically administered lentiviral shRNA in mice with orthotopic breast tumor xenografts. We identified distinct increases in leucine, valine, glutathione, creatine, glucose, tyrosine, and histidine in the GDPD5-shRNA treated group, whereas cholesterol, isoleucine, beta-hydroxy butyrate, alanine, glutamate, glutamine, aspartate, fumerate, phenylalanine, and formate were elevated in the GDPD6-shRNA treated group.
Introduction:
We have applied 1H MRS metabolomics to investigate metabolic changes in livers of mice in which we have targeted choline phospholipid metabolism [1] by systemically administering lentiviral silencing of two glycerophosphodiesterase genes, GDPD5 or GDPD6. This study is part of our ongoing efforts of evaluating the overall biological role of these two genes in cancer, and their value as treatment targets in breast cancer. We systemically administered shRNA against GDPD5 (GDPD5-shRNA) or GDPD6 (GDPD6-shRNA) [2-5] in mice that orthotopically grew triple-negative breast tumor xenografts. The livers of the gene-silenced groups studied with respect to control group which was treated with shRNA against the nonexpressed luciferase gene (luc-shRNA) by estimating percentage changes in metabolites from 1H MR spectra of liver tissue extracts.Methods:
Lentiviral vectors based on pRRL-green fluorescent protein containing shRNA against GDPD5 (GDPD5-shRNA) or against GDPD6 (GDPD6-shRNA) were constructed to constitutively knock down these two genes [6]. A vector with shRNA against luciferase (luc-shRNA) was also constructed and used as control vector. The triple-negative human breast cancer cell line MDA-MB-231 (obtained from ATCC, Rockville, MD USA) was grown to 80% confluence, trypsinized, counted and approximately 2X10⁶ cells were inoculated in right 4th mammary pad of 6-8 weeks old female athymic nude mice. Breast tumor volume were measured biweekly and once they reached 150 mm3, 200 μL of concentrated viral suspension ( 6.2 X 10¹¹ /mL) were injected twice per week through the tail vein for up to 30 days. Mice were sacrificed and livers were harvested, freeze-clamped, and stored at -80°C until 1H MRS analysis. Dual phase extraction was performed on these liver tissues. Both water and lipid phases were separated. The water phase was freeze-dried, reconstituted in D2O, transferred to 5-mm NMR-tube for spectral acquisition. 1H MR spectra were acquired on Avance-III 750MHz Bruker spectrometer equipped with 5-mm TXI probe. Water supressed 1H MR spectra were acquired using 1D-NOESY sequence with following parameters: spectral-width-15495.86Hz, data-points 64K, relaxation-delay 10sec, 64 scans, 8 dummy-scans, RG 80.6 and mixing time 80 msec. Similarly, lipid-phase samples were dried, lyophilized and reconstituted in 2:1 deuterated chloroform and methanol and transferred to 5-mm NMR tube for spectral acquisition. 1H MR spectra were acquired with following parameters: spectral-width 15495.86 Hz, data-points 64K, relaxation-delay 10sec, 32 scans, 8 dummy scans and RG 25.4. Spectral processing and quantification were performed using TOPSPIN 3.5, Amix,MATLAB package.Results and Discussion:
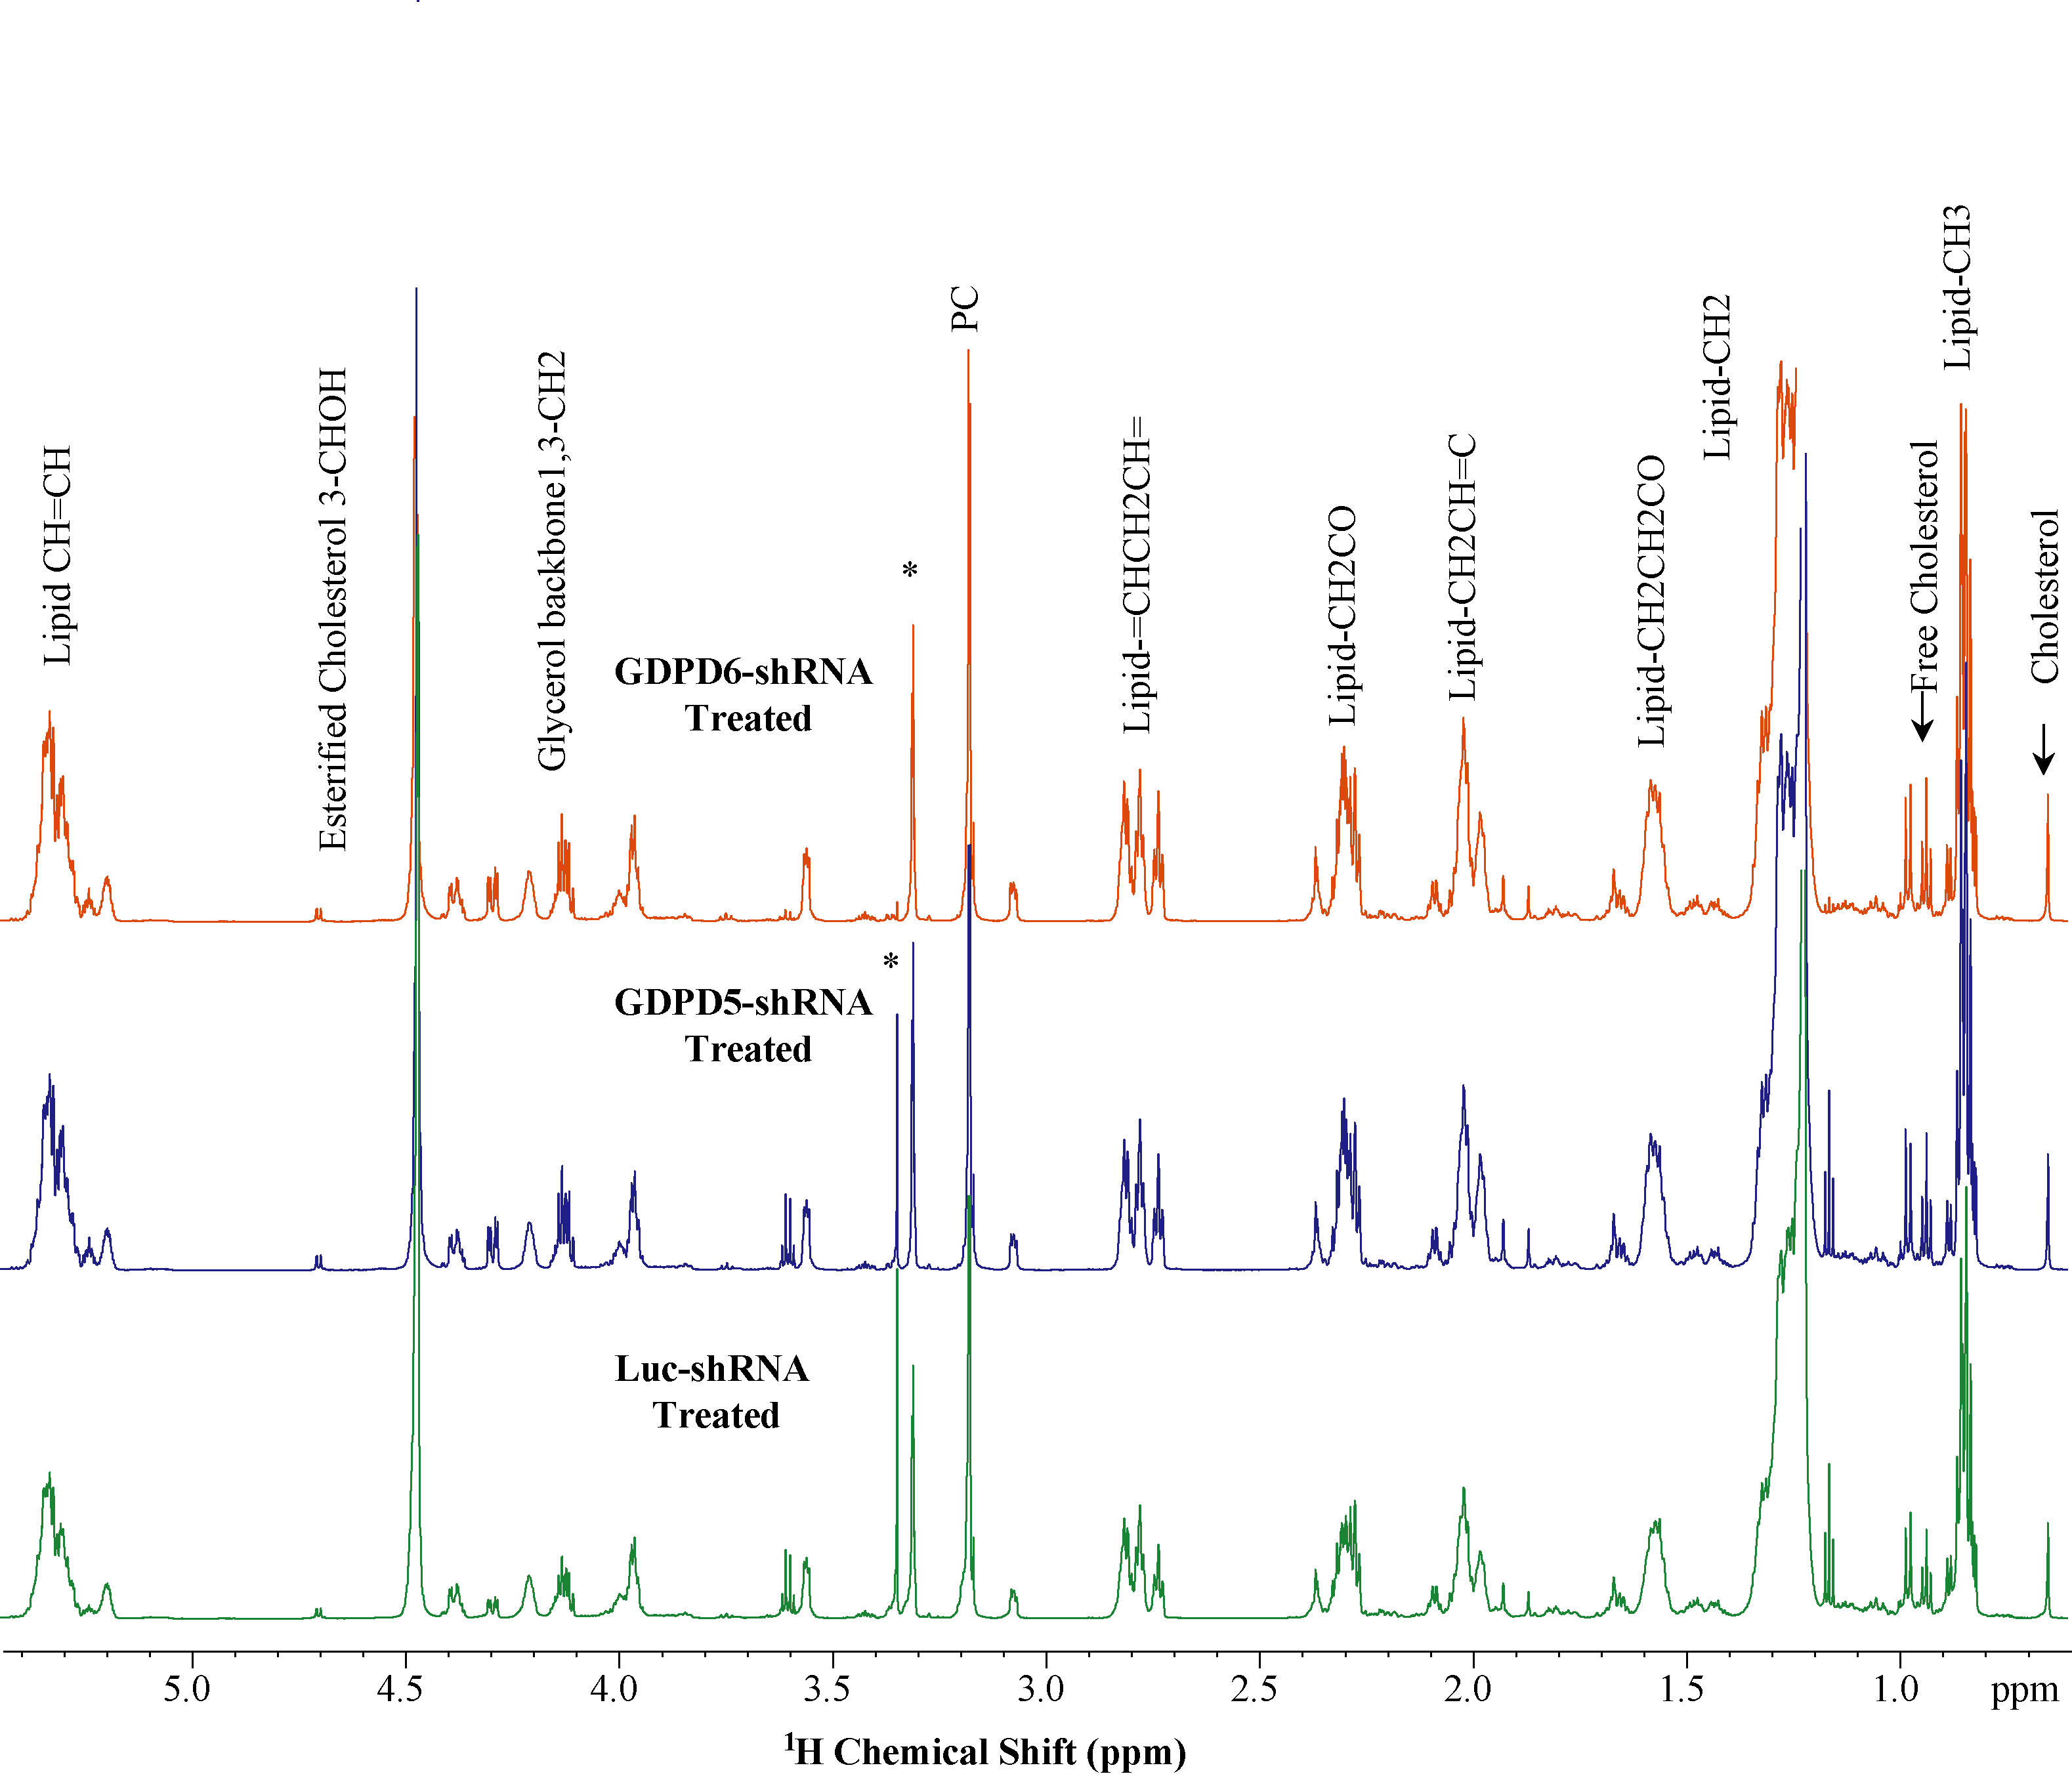
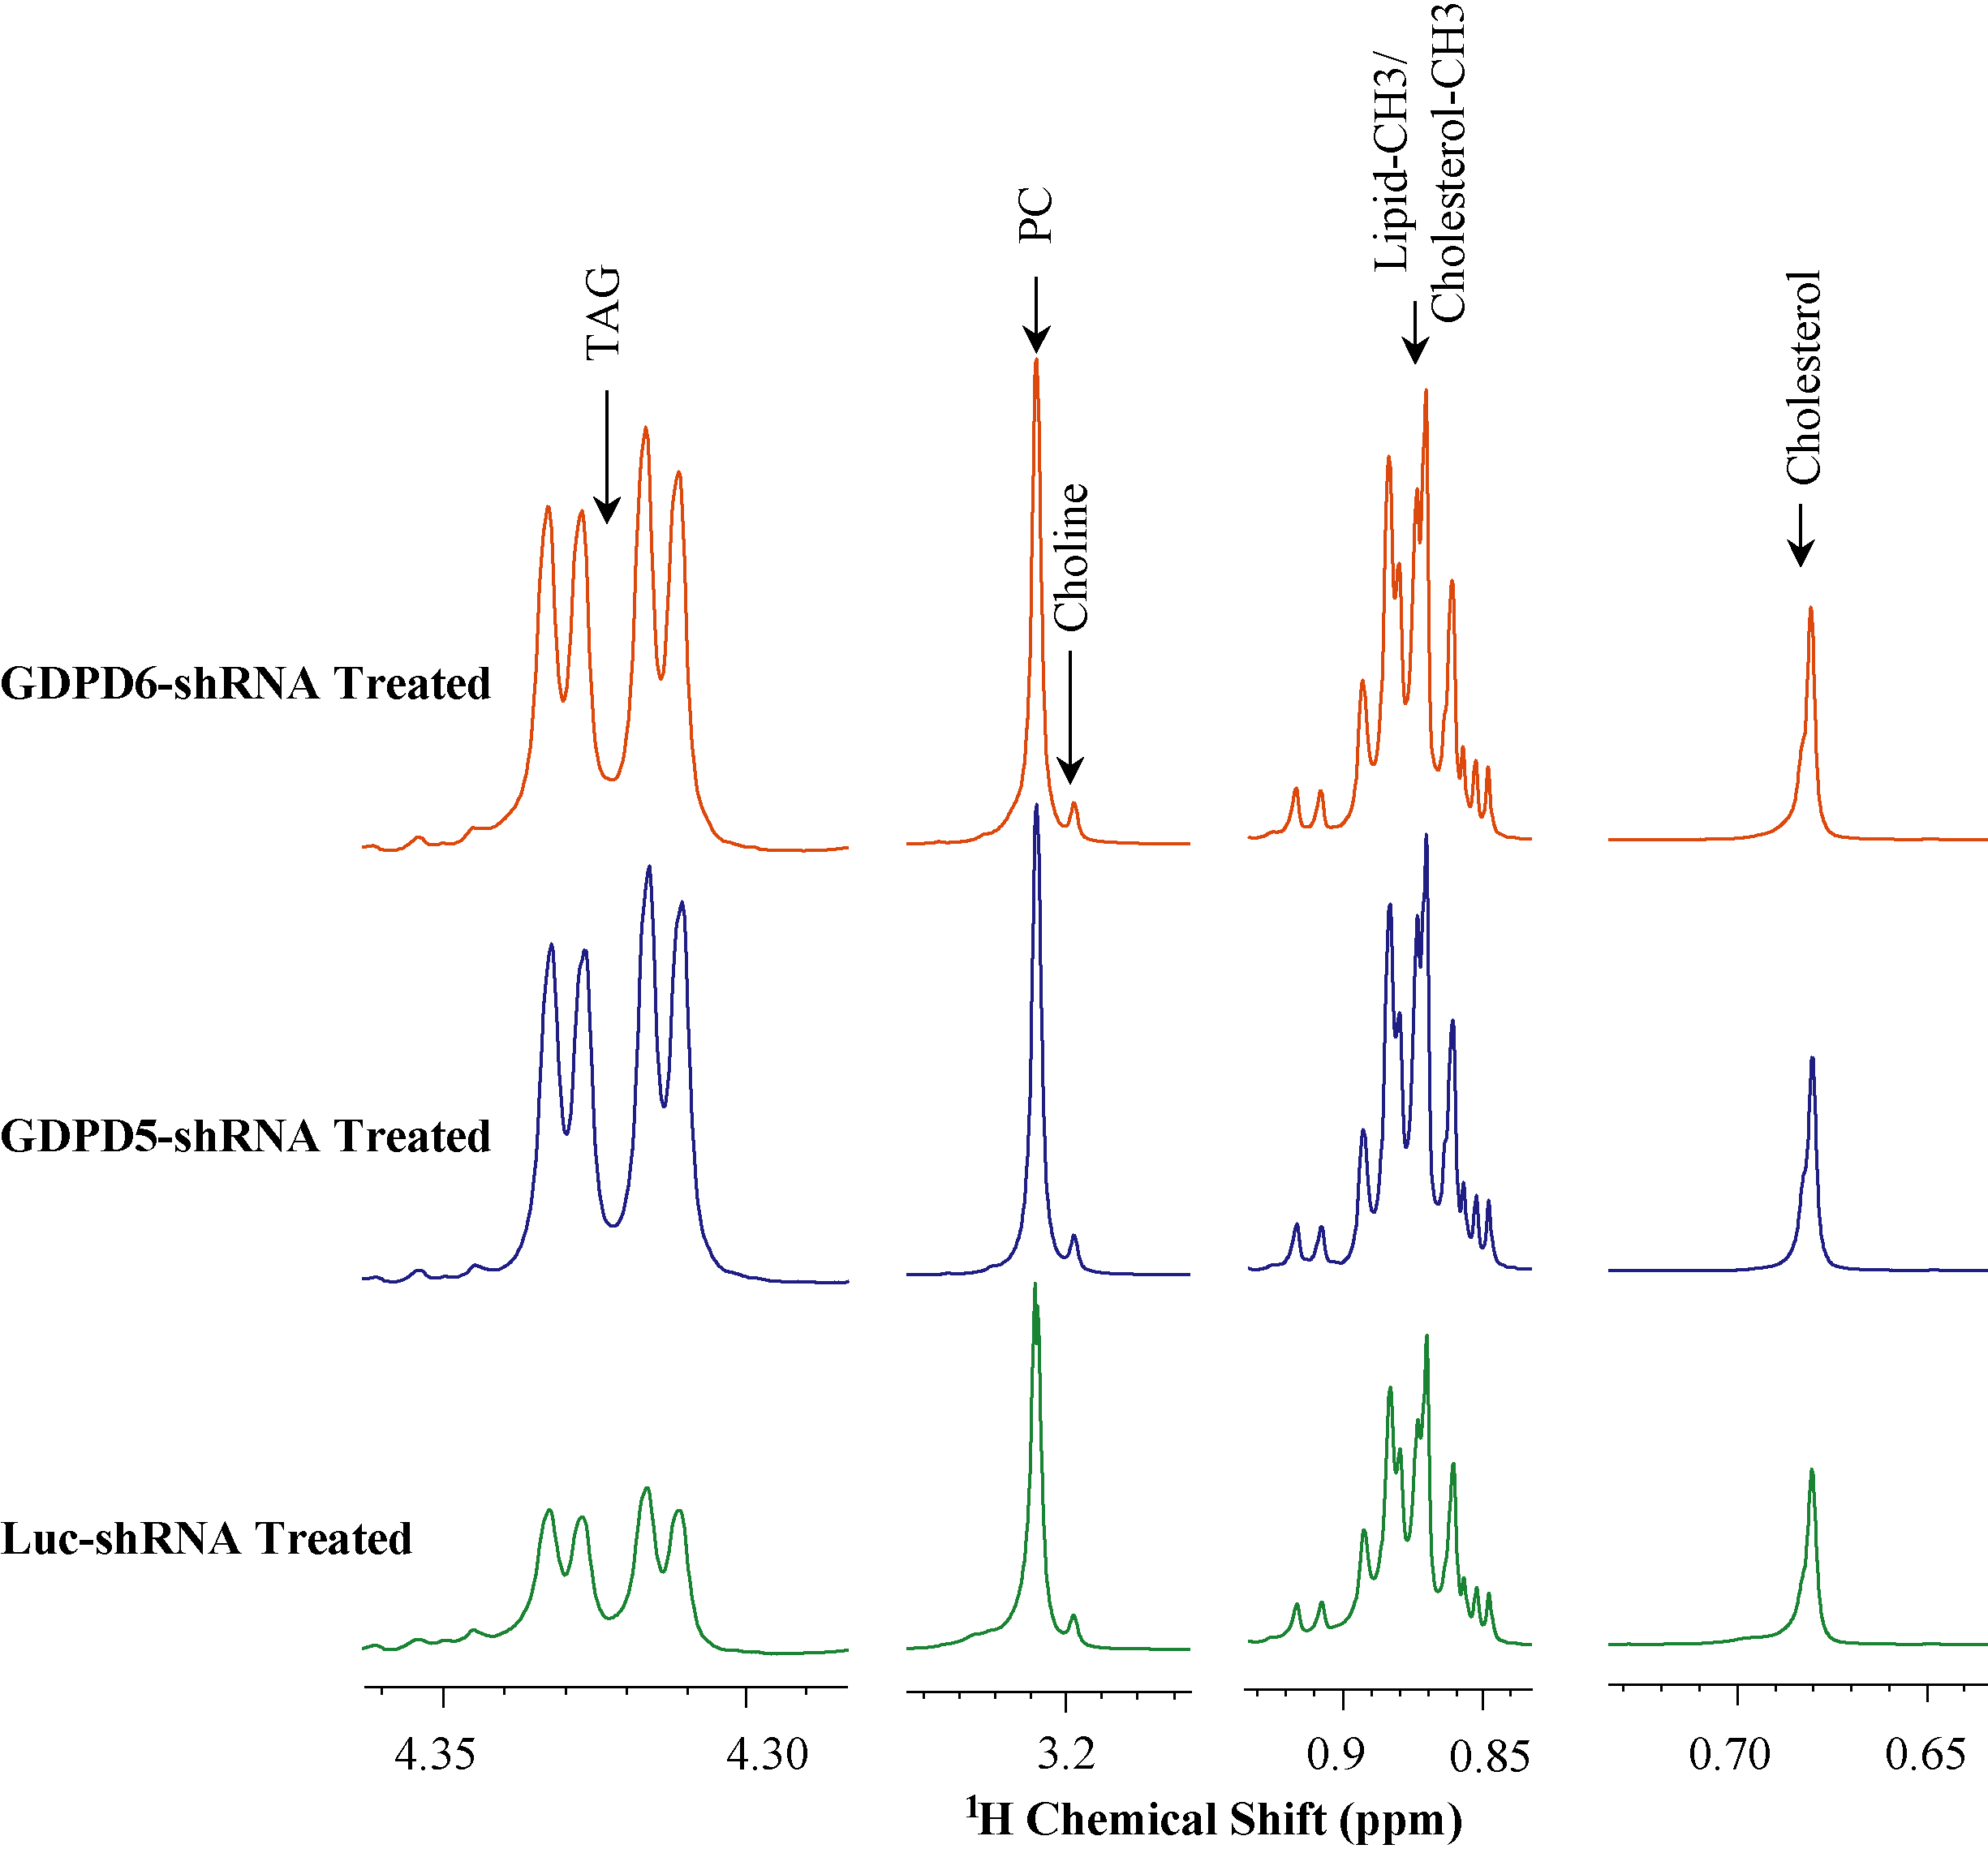
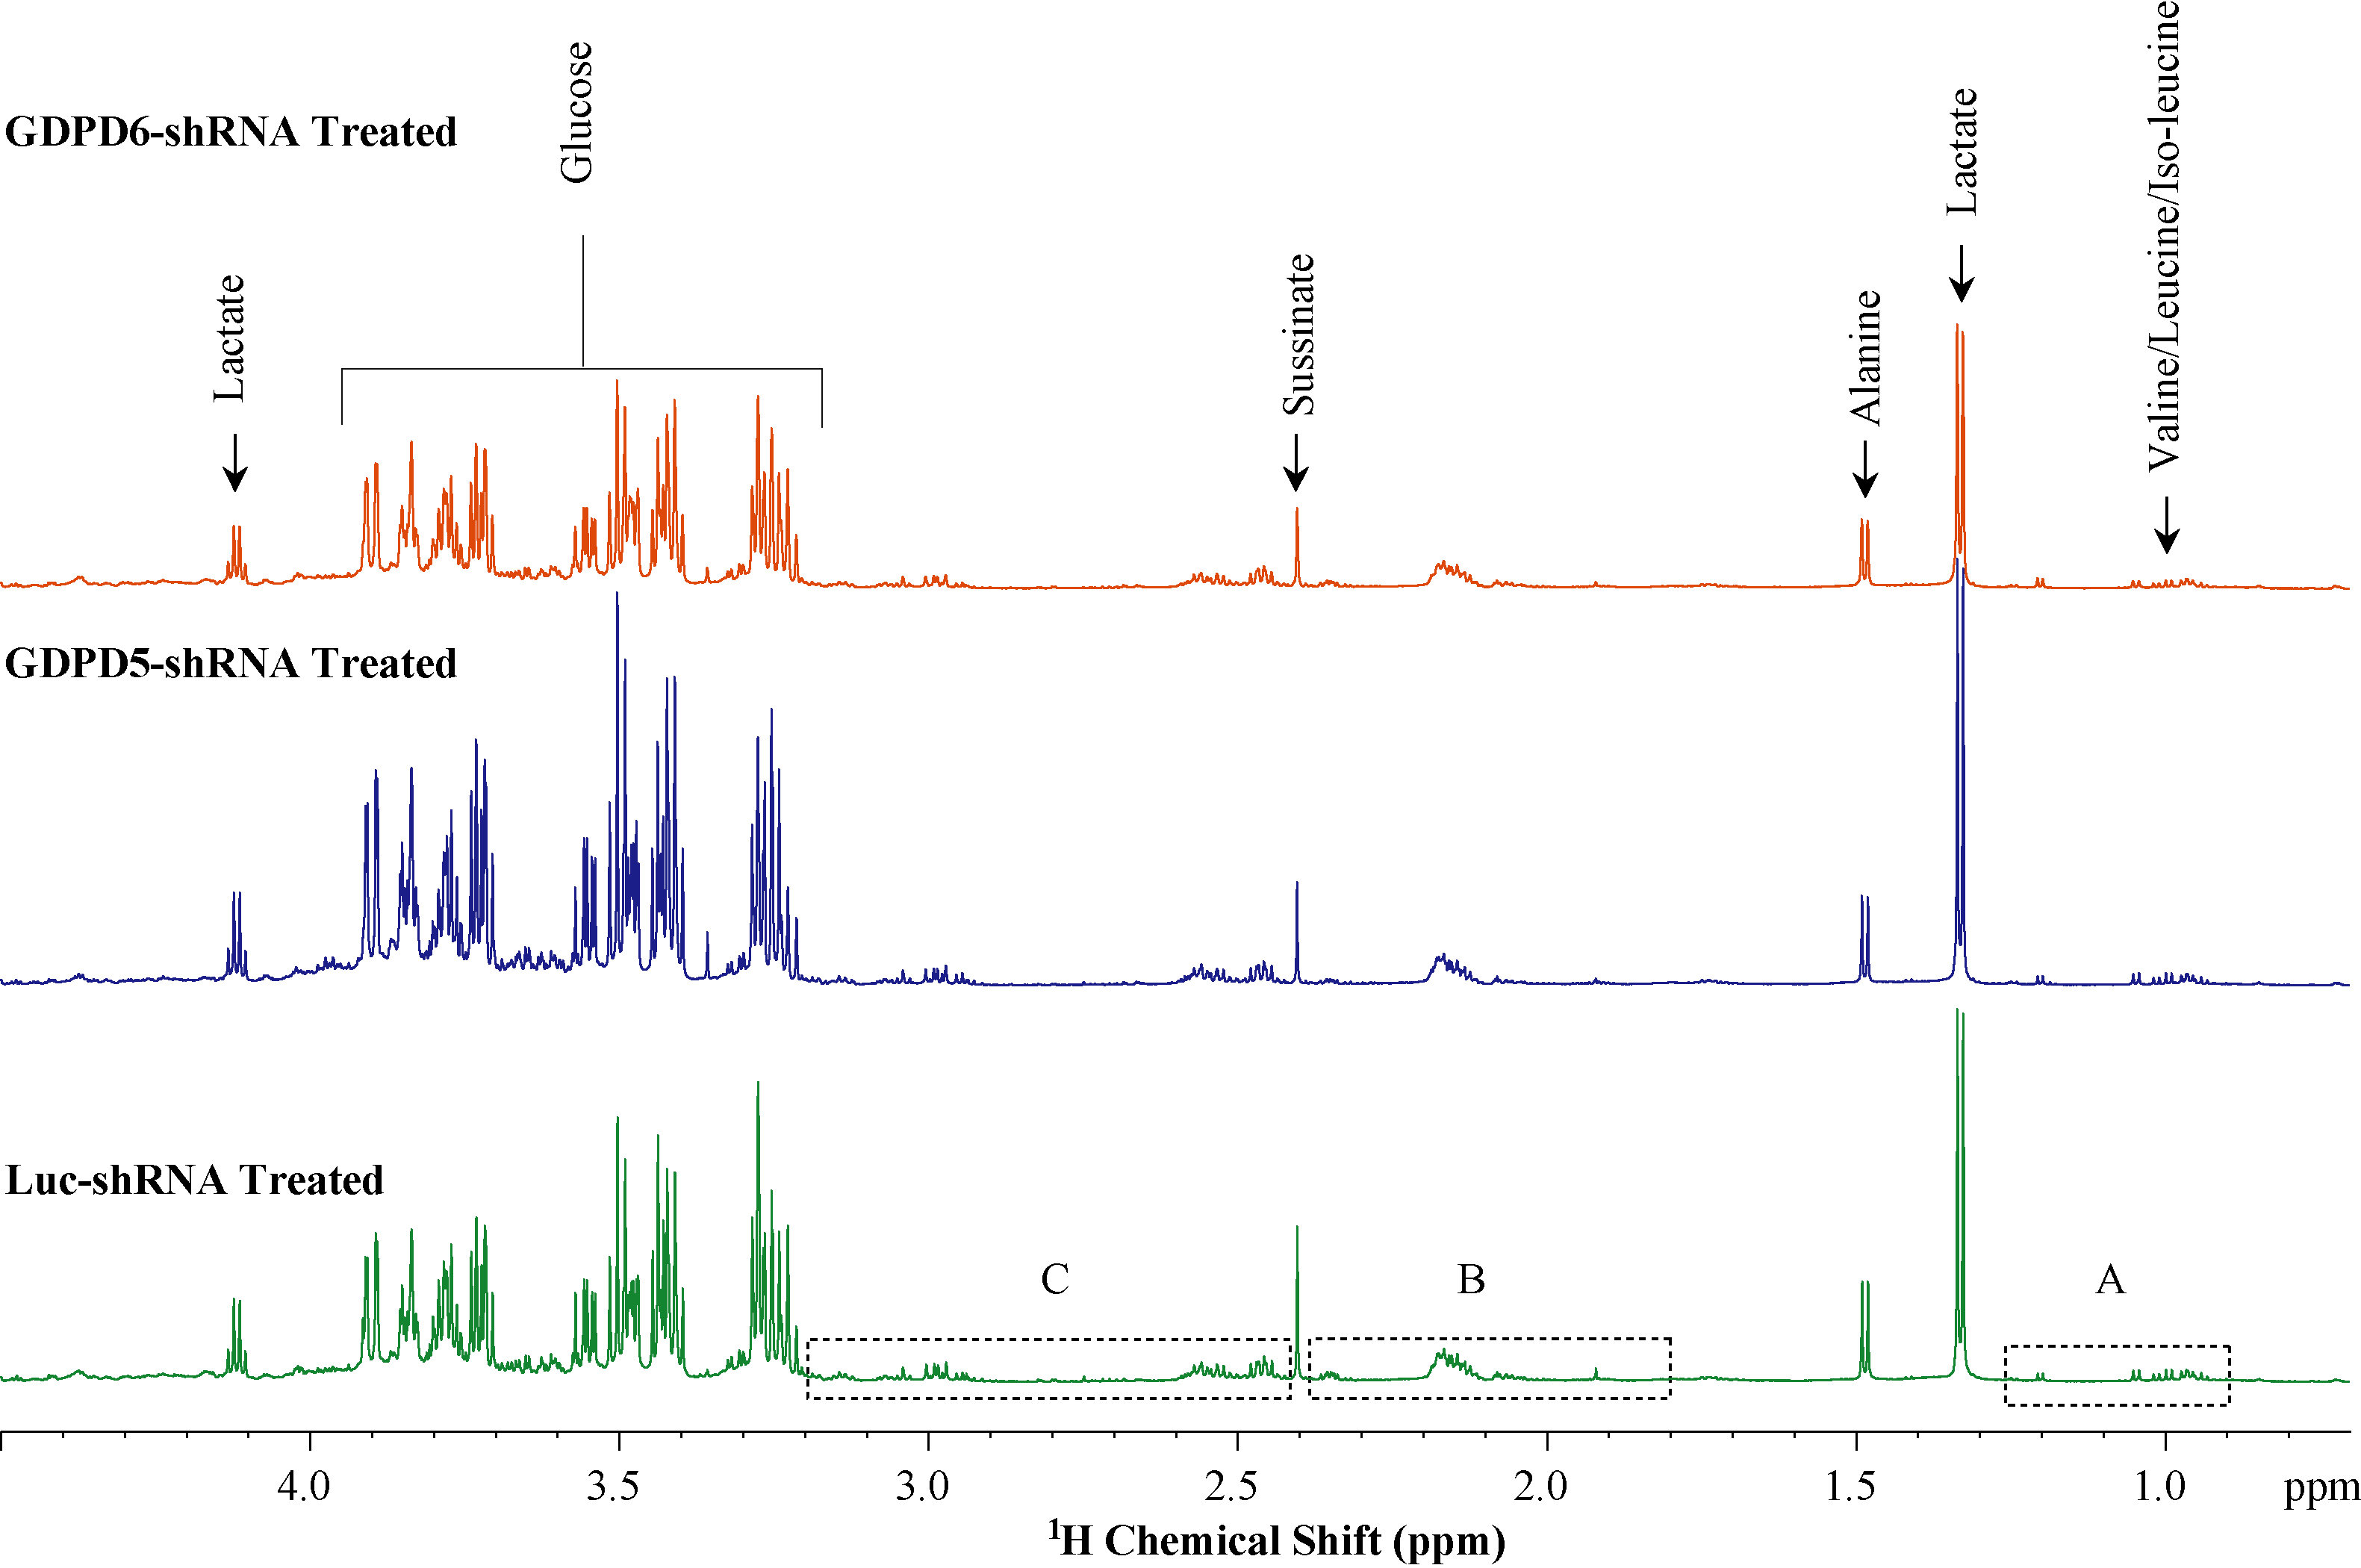
Representative 1H MR spectra obtained from lipid phases extract of mouse livers from GDPD5-shRNA, GDPD6-shRNA and luc-shRNA (control) treated mice are shown in Figure 1. Prominent liver metabolites associated with changes among treated and control groups are shown in Figure 2. Figure 3 represents the aqueous phase extract of livers from these three groups, and important metabolites are shown in Figure 4. A heatmap display of 1H MRS metabolites from the aqueous phase extracts of livers is presented in Figure 5. Notable differences in metabolites were observed in both lipid phases and aqueous phases from livers. 1H MR spectra of lipid phases showed that cholesterol and various saturated and unsaturated fatty acids were increased in the livers from GDPD5-shRNA and GDPD6-shRNA groups as compared to control (luc-shRNA treated) livers. No differences in these metabolites were observed between the livers from GDPD5-shRNA and GDPD6-shRNA treated groups. Aqueous phase 1H MR spectra showed various differences among treated and control livers. Leucine, valine, glutathione, creatine, glucose, tyrosine and histidine were elevated in the livers of the GDPD5-shRNA treated group, whereas isoleucine, β-hydroxybutyrate, alanine, glutamate, glutamine, aspartate, fumerate, phenylalanine, and formate were increased in the livers of the GDPD6-shRNA treated group. Livers of both GDPD5- and GDPD6-shRNA treated groups contained decreased levels of acetate, succinate, and lactate as compared to the control group. Elevated levels of glucose, various branched chain amino acids, glutamate, glutamine, and glutathione have been implicated in several cancers [7-8]. β-hydroxybutyrate and histidine [9-10] are considered potential biomarkers for recurrent breast cancer, and phenylalanine is a potential biomarker for metastatic breast cancer [10-13]. We are currently continuing our ongoing studies to evaluate whether the observed metabolic liver differences are related to premetastatic conditioning of these mouse livers through the primary triple-negative breast tumors growing in these animals. It is also possible that the observed metabolic liver differences may have been caused by direct lentiviral silencing of GDPD5 and GDPD6 in these livers. Another possibility is that the observed metabolic changes are due to a combination of both effects.Conclusion:
1H MRS metabolomic investigation of liver extracts from breast-tumor bearing mice following systemic treatment with lentiviral particles that silenced GDPD5 or GDPD6 through shRNA revealed distinct differences in various metabolites and lipids. Some of the identified metabolic changes are typical of recurrent and metastatic breast cancer.Acknowledgements
This work was supported by NIH R01 CA213428. We thank all members of the Division of Cancer Imaging Research in The Russell H. Morgan Department of Radiology and Radiological Science for their help and support.References
1. Glunde K, et al, Nat Rev Cancer 2011;11:835-48
2. Cao M.D., et al,NMR Biomed 2012;25:1033-42.
3. Stewart J.D et al,Proc Natl Acad Sci USA, 2012. 109(21): 8155-60.
4. Stewart JD et al,Proc Natl Acad Sci U S A 2012;109:8155-60.
5. Marchan R., et al,Cell Cycle 2012;11:4499-506.
6. Krishnamachary, B., et al, Cancer Research 2009; 69(8), 3464-34
7. Lai H.-S., et al, Semin. Cancer Biol. 2005, 15: 267–276.
8. Miyagi, Y., et al, PLoS ONE, 2011, 6, e24143.
9. Chan E.C.Y., et al, J. Proteome Res. 2009, 8:352–361.
10. Gao H., et al, Cancer Sci., 2009, 100: 782–785.
11. Oakman J.C., Ann. Oncol., 2011, 22:1295–1301
12. Neurauter G, et al, Cancer Lett., 2008, 272: 141–147.
13. Asiago V.M., et al, Cancer Res., 2010, 70: 8309–8318.
Figures