1546
Prostate MR Elastography: a comparison of image acquisitions strategies in healthy volunteers1Mayo Clinic, Rochester, MN, United States
Synopsis
The purpose of this study was to compare image acquisition strategies for prostate MRE using external drivers. Additionally, to assess the normal heterogeneity of prostate mechanical properties in an age-matched cohort to the prostate cancer population. Improved resolution using higher MRE vibration frequencies, larger acquisition matrices, and distortion-reduction techniques, may help advance the clinical application of prostate MRE.
Introduction:
With the development of effective screening procedures for prostate cancer, including the digital rectal exam and the prostate-specific antigen (PSA) testing, an increasing number of cancers are detected. While prostate cancer is associated with a lower cancer-specific mortality rate than other malignancies, it is difficult to distinguish between cancers that are slow growing and can be monitored using a “watchful waiting” approach and those that are more aggressive and require treatment. Management and treatment decisions are complicated by other clinical factors, including comorbidities, therapy side-effects, and age1. There is a critical need for a noninvasive technique for identifying aggressive forms of disease. Our hypothesis is that tumor mechanical properties assessed using MR elastography (MRE) may improve the detection and diagnosis of clinically significant prostate cancer. The purpose of this study was to assess the normal heterogeneity of prostate mechanical properties in an age-appropriate cohort.Methods:
Normal, healthy, male volunteers (age > 40yrs) were recruited for this study. Volunteers were scanned on a 3T scanner (Signa HDxt, GE Healthcare) with an 8-channel torso coil. The protocol included T1-, T2-, and diffusion-weighted sequences with multiple MRE acquisitions performed using different pulse sequences and motion frequencies to thoroughly characterize the properties of the prostate.
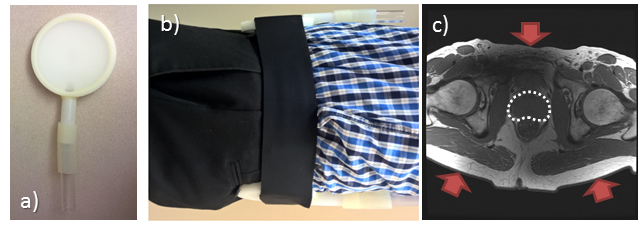
Shear waves were introduced into the prostate using a modified external driving technique based on previous work2 (Figure 1). Three 10-cm diameter rigid high density polyethylene drivers were strapped around the pelvis and connected to three active acoustic MRE actuators located outside the scan room to produce synchronous vibrations at 60, 90, or 120 Hz. Multiple acquisitions were performed including full-FOV SE-EPI 3D MRE, reduced-FOV (rFOV) SE-EPI 3D MRE, and 3D GRE MRE. Representative parameters include: 19-23 axial slices, 2.5-3 mm slice thickness, 128x128 acquisition matrix reformatted to 256x256, 4-8 MRE phase offsets, and acquisition times of 1-6 min. The full-FOV EPI acquisition was performed both as a faster, single-shot acquisition with standard +-XYZ motion-encoding gradients (MEGs) and with a slower, 2-shot acquisition with tetrahedral MEGs. Tetrahedral encoding with full-strength (4 G/cm) MEGs was used to double the motion sensitivity from 0.187 rad/um to 0.374 rad/um, and 2 EPI shots were used to reduce the TE from 70.6 ms to 52-56 ms while reducing the readout duration by a factor of 2 to reduce distortion.
The MRE data were processed by taking the curl of the 3D displacement fields to remove longitudinal wave effects, using 2D directional filters (2-128 waves/FOV radial cutoffs) to reduce wave interference, and a 3D local-frequency estimation (LFE) inversion algorithm to calculate the tissue stiffness3. Regions of interest (ROIs) including the entire prostate were manually drawn using the T1- and T2-weighted images as a reference, and the shear stiffness was reported as the mean value in the ROI.
Results:
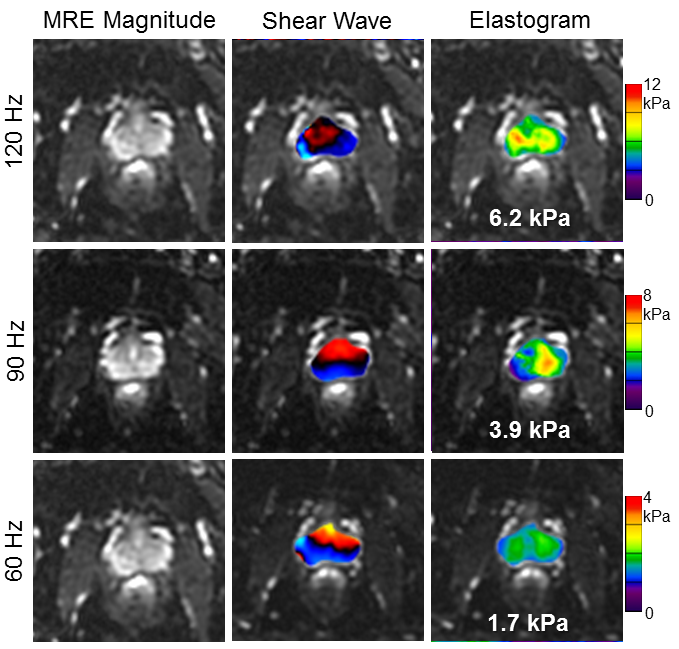
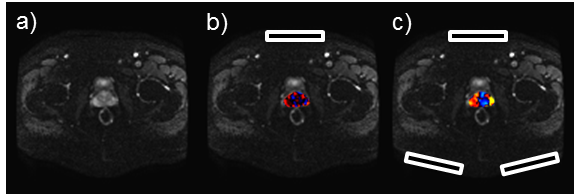
Six volunteers were recruited: average age =52 years (range: 42-58 years), BMI =27 kg/m2 (range: 23-33 kg/m2), and average prostate volume =25 cc (range: 16-28 cc). Shear waves were visible in the prostate at 60, 90, and 120 Hz using combinations of 1-3 mechanical actuators (Figure 2). Three drivers produced more reliable shear waves at 120 Hz4 (Figure 3).
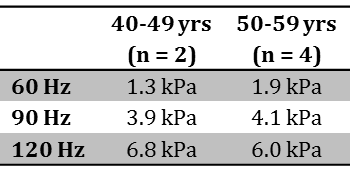
Mean prostate stiffness was 1.7 kPa (1.3-2.3 kPa) at 60 Hz, 4.0 kPa (3.4 – 5.1 kPa) at 90 Hz, and 6.3 kPa (4.2 – 7.5 kPa) at 120 Hz. Grouped by decade of life (40-49 years (n=2) and 50-59 years (n = 4)), whole prostate stiffness was higher in the 50s group compared to 40s at 60 and 90 Hz and lower at 120 Hz (Table 1). No relationship between prostate volume and stiffness was observed.
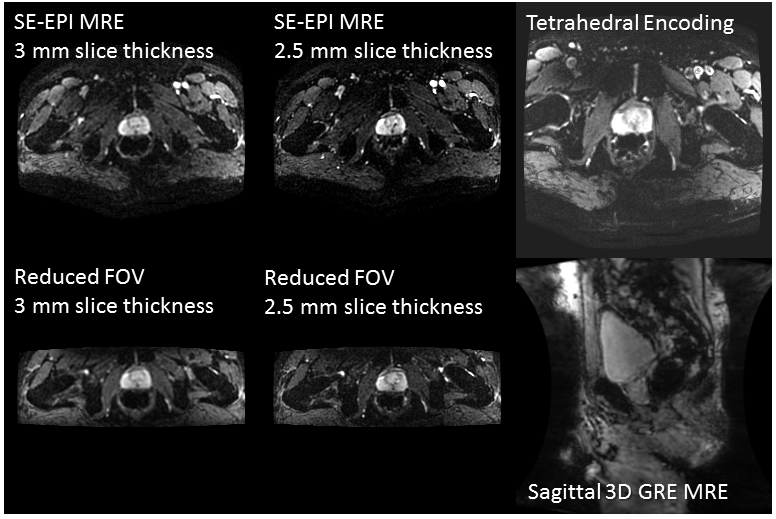
Multiple MRE pulse sequences were evaluated (Figure 4). The standard full-FOV acquisition, rFOV, 3D GRE and tetrahedral acquisitions were all successful. The rFOV, 3D GRE MRE and tetrahedral acquisitions offer ways to reduce distortion and improve motion sensitivity over the traditional, full-FOV, SE-EPI sequence.
Discussion:
An external driving system with 3 vibration sources can be used to assess the stiffness of healthy prostate tissue in normal volunteers. Shear wave amplitude was visibly improved when utilizing three drivers compared to one8. This external driving system may be better tolerated by patients and easier to implement clinically than more invasive techniques5-7.Conclusion:
Prostate MRE with 3 drivers at 120Hz is feasible, and future work will include the recruitment of more subjects to determine how prostate mechanical properties may change with normal aging. Properties of prostate sub-zones and stiffness heterogeneity will also be assessed. Improved resolution using higher MRE vibration frequencies and larger acquisition matrices and distortion-reduction techniques, may help advance the clinical application of prostate MRE.Acknowledgements
This work funded by the Fraternal Order of Eagles, Varian Medical Systems, and NIH Grant EB001981.References
1. Daskivich TJ, Fan KH, Koyama T, et al. Effect of Age, Tumor Risk, and Comorbidity on Competing Risks for Survival in a U.S. Population–Based Cohort of Men With Prostate Cancer. Ann Intern Med 2013;158:709-717
2. Dittmann F, Reiter R, Guo J, et al. Tomoelastography of the prostate using multifrequency MR elastography and externally placed pressurized-air drivers. Magnet Reson Med 2017
3. Manduca A, Oliphant TE, Dresner MA, et al. Magnetic resonance elastography: non-invasive mapping of tissue elasticity. Med Image Anal 2001;5:237-254
4. Venkatesh SK, Yin M, Ehman RL. Magnetic resonance elastography of liver: clinical applications. J Comput Assist Tomogr 2013;37:887-896
5. Arani A, Plewes D, Chopra R. Transurethral prostate magnetic resonance elastography: prospective imaging requirements. Magnet Reson Med 2011;65:340-349
6. Arani A, Plewes D, Krieger A, et al. The feasibility of endorectal MR elastography for prostate cancer localization. Magnet Reson Med 2011;66:1649-1657
7. Sahebjavaher RS, Nir G, Honarvar M, et al. MR elastography of prostate cancer: quantitative comparison with histopathology and repeatability of methods. NMR Biomed 2015;28:124-139
8. Wang J, Zhang T, Glaser K, et al. Clinical Evaluation of a Simple Approach for Improving Shear Wave Illumination in Magnetic Resonance Elastography of the Prostate. Proc. Intl. Soc. Mag. Reson. Med. 25 (2017). 4792.
Figures